outubro de 2013
Marina Soraia Gomes de Oliveira
Edible coatings on frozen fish:
Effect of applying a chitosan-based
coating on the quality of frozen salmon
UMinho|20
13
Marina Sor
aia Gomes de Oliv
eir
a
Edible coatings on frozen fish: Ef
fect of appl
ying a chitosan-based coating on t
Dissertação de Mestrado
Mestrado Integrado em Engenharia Biológica
Ramo Tecnologia Química e Alimentar
Trabalho realizado sob a orientação do
Professor Doutor Engenheiro António Augusto
Martins de Oliveira Soares Vicente
e do
Engenheiro Nuno Miguel Ferreira Soares
outubro de 2013
Marina Soraia Gomes de Oliveira
Edible coatings on frozen fish:
Effect of applying a chitosan-based
coating on the quality of frozen salmon
iii
Dedicatória
“Não sei se estou perto ou longe demais, sei apenas que sigo em frente, vivendo dias iguais de forma diferente. Levo comigo cada recordação, cada vivência, cada lição. E mesmo que tudo não ande da forma que eu gostaria, saber que já não sou a mesma de ontem me faz perceber que valeu a pena. Há um tempo em que é preciso abandonar (…) e esquecer os nossos caminhos que nos levam sempre aos mesmos lugares… É o tempo da travessia… e, se não ousarmos fazê-la, teremos ficado, para sempre, à margem de nós mesmos.”
Fernando Teixeira de Andrade À minha família
v
Agradecimentos
À família e amigos pelo amor incondicional, em especial aos insubstituíveis: pais, irmãos, cunhado, padrinho, Margarida, Francisco, Ana, Teresa, Raquel, Filipa e G.J.E..
Ao Engenheiro Nuno Soares pela presença assídua, pelo apoio e companheirismo constantes e pela irrepreensível e generosa parceria.
Ao Professor Vicente por todo o amparo, pela simpatia e otimismo sempre presentes. Ao Departamento de Engenharia Biológica, nas pessoas que nele trabalham, em especial ao pessoal do Laboratório de Instrumentação e Processo e à Plataforma de Microscopia, na pessoa da Doutora Ana Nicolau, pela paciência e cooperação.
À Vanibru pela disponibilização das instalações e equipamentos e pela hospitalidade dos seus trabalhadores.
À empresa Castro Pinto & Costa (LabMaia) pela disponibilização do equipamento de HPLC e pelo fantástico acolhimento e boa disposição permanente, em especial à Engenheira Inês, Filipa e Elizabete, ao João e à Vânia.
Ao IPMA, na pessoa da Doutora Helena Lourenço, pela partilha de conhecimento na aplicação da Norma Portuguesa 3356:2009.
À empresa Konica Minolta/Aquateknica, na pessoa do Físico David Roldán, pelo oportuno esclarecimento na avaliação da cor.
À Tânia, ao Tiago e à Cristina pela atenciosa disponibilidade e gentil companhia.
À Engenheira Susana pelo desafiante convite e pela oportunidade tão bem-vinda de aprendizagem na superfície comercial MercAtlas.
A todos aqueles que direta ou indiretamente colaboraram comigo para que a realização deste trabalho fosse possível, o meu mais sincero OBRIGADA.
vii
Revestimentos edíveis em pescado congelado:
Efeito da aplicação de um revestimento à base de quitosano na qualidade de salmão congelado
Resumo
O aumento do consumo de peixe, devido às suas características nutricionais, obrigou a uma dinamização da indústria do pescado, no que respeita ao melhoramento dos processos de conservação do mesmo. A congelação e a vidragem são técnicas comumente usadas na redução da incidência dos processos de deterioração no pescado. Com o objetivo de encontrar uma alternativa que complementasse a congelação e substituísse o vidrado de água, o presente trabalho visou avaliar o efeito da aplicação de revestimentos edíveis de 0.5% e 1.5% de quitosano na qualidade do pescado congelado. Ambos os revestimentos – o vidrado de água e os revestimentos de quitosano – foram aplicados diretamente em salmão do Atlântico (Salmo salar) congelado e armazenado durante 6 meses a -22 °C. Comparando ambos os revestimentos entre si e com amostras controlo não revestidas, diversos parâmetros como perda de revestimento/vidrado, perda de peso, perda por gotejamento, TVC, TBA, TVB-N, K-value, pH e coordenadas de cor L*a*b* foram periodicamente avaliados. Encontraram-se resultados favoráveis para as amostras de salmão revestidas com 0.5% de quitosano no controlo da perda de revestimento e para as amostras revestidas com 1.5% de quitosano na manutenção da cor do salmão e no controlo da contaminação microbiana de amostras congeladas e descongeladas. Neste trabalho vários parâmetros, como a perda de revestimento/vidrado, perda de peso, perda por gotejamento, TVC, TBA, TVB-N e K-value, revelaram-se bastante estáveis devido à proteção providenciada por uma correta temperatura de armazenamento e por um controlo apropriado da sua manutenção.
ix
Edible coatings on frozen fish:
Effect of applying a chitosan-based coating on the quality of frozen salmon
Abstract
The increase of fish consumption due to its nutritional characteristics, led to a stimulation of fishing industry, as regards the improvement of the processes for its conservation. Freezing and glazing are techniques commonly used in reducing the incidence of fish deterioration processes. In order to find an alternative to complement freezing and replace water glaze, the present work aimed at evaluating the effect of edible coatings of 0.5% and 1.5% chitosan on the quality of frozen fish. Both coatings - water glazing and chitosan coatings - were applied directly on Atlantic salmon (Salmo salar) frozen and stored for 6 months at -22 °C. Comparing both coatings with each other and with control uncoated samples, several parameters such as coating/glazing loss, weight loss, drip loss, TVC, TBA, TVB-N, K-value, pH and color coordinates L*a*b* were periodically evaluated. Favorable results were found for salmon samples coated with 0.5% chitosan in the control of coating loss and for the samples coated with 1.5% chitosan in maintaining the color of the salmon and controlling microbial contamination of samples frozen and thawed. In this work several parameters, such as coating loss, weight loss, drip loss, TVC, TBA, TVB-N, and K-value maintained quite stable due to the protection provided by a correct freezing temperature and a suitable control of its maintenance.
xi
List of Contents
Dedicatória ... iii Agradecimentos ... v Resumo ... vii Abstract ... ix List of Nomenclature ... xvList of Figures ... xix
List of Tables ...xxiii
Introduction ... 1
Part I – State of Art... 3
Chapter 1. Fish... 5
1.1. Fish Industry ... 6
1.2. Fish - Chemical composition and structure ... 7
1.3. Fish Conservation...10
1.3.1. Freezing ...10
1.3.2. Glazing ...12
1.3.3. Edible coatings/films ...13
1.3.3.1. Chitosan ...14
Chapter 2. Fish Quality - Freshness ... 17
2.1. Microbiology ...17
2.1.1. Total Viable Counts (TVC) ...17
2.2. Lipids ...20
2.2.1. 2-Thiobarbituric acid (TBA) ...20
2.3. Volatiles ...22
2.3.1. Total Volatile Basic Nitrogen (TVB-N) ...22
2.4. Adenosine-5’-triphosphate (ATP) ...23
2.4.1. K-value ...23
xii
2.6.1. Color ... 26
2.7. Physical properties ... 33
2.7.1. Temperature and storage time ... 33
Part II – Experimental Work ... 37
Chapter 3. Materials and Methods ... 39
3.1. Fish preparation ... 39
3.2. Preparation of the coating solutions ... 39
3.3. Preparation of the samples ... 40
3.3.1. Preparation of the samples coated with chitosan... 40
3.3.2. Preparation of the samples glazed with water... 41
3.3.3. Preparation of the control samples ... 41
3.4. Storage and transport of the samples... 41
3.5. Samples Analysis ... 42 3.5.1. Coating Loss... 42 3.5.2. Glazing Loss ... 42 3.5.3. Weight Loss ... 42 3.5.4. Drip Loss ... 42 3.5.5. Determination of TVC ... 43 3.5.6. Determination of TBA ... 45 3.5.7. Determination of TVB-N ... 46 3.5.8. Determination of K-value ... 47 3.5.9. Determination of pH-value ... 48
3.5.10. Determination of color parameters ... 49
3.5.11. Statistical analysis ... 50
Chapter 4. Results and Discussion ... 51
xiii 4.2. Weight Loss ...53 4.3. Drip Loss...54 4.4. TVC...55 4.5. TBA...57 4.6. TVB-N ...59 4.7. K-value ...60 4.8. pH-value...61 4.9. Color parameters ...62
Chapter 5. Conclusions and future perspectives ... 67
References ... 71
Appendixes ... 75
A1 – Standard Curve Determination for TBA method ...75
A2 – Illustrations assistants to the implementation of standard NP2930:2009 ...77
A3 – Calibration curves for HPLC determinations ...79
xv
List of Nomenclature
Abbreviations
Abs - Absorbance
ADP - Adenosine diphosphate AMP - Adenosine monophosphate APC - Aerobic Plate Counts Art. - Article
ATP - Adenosine triphosphate
BS EN ISO - British, European and International Standard Organization CFU - Colony forming units
Co. Ltd. - Company Limited DL - Decree - Law
DSC - Differential Scanning Calorimetry EDTA - Ethylenediaminetetraacetic acid ESR - Electron Spin Resonance
FAO - Food and Agriculture Organization FTIR - Fourier Transform Infrared Radiation HPLC - High Performance Liquid Chromatography HQL - High-quality life
Hx - Hypoxanthine HxR - Inosine
ICMSF - International Commission on Microbiological Specifications for Foods IIR - International Institute of Refrigeration
IMP - Inosine monophosphate IV - Infra-red
JND - Just Noticeable Difference K-value - ATP breakdown products MA - Malonaldehyde
MDA - malondialdehyde
xvi MRD - Maximum Recovery Diluent
N - Nitrogen
NMR - Nuclear Magnetic Resonance NP - Portuguese Standard
OSI - Oxidative Stability Instrument p-AnV - p-anisidine value
PCA - Plate Count Agar
PPP - product-processing-packaging PSL - Practical Storage Life
PV - Peroxide Value RGB - Red Green Blue s seconds
S.A. - Anonymous Society SD - Standard Deviation ssp. - specie
TBA - Thiobarbituric Acid
TBA-MDA - Thiobarbituric acid-malondialdehyde complex TBARS - Thiobarbituric Acid Relative Substance
TCA - Trichloroacetic acid TMA - Trimethylamine
TTT - Time Temperature Tolerance TVB-N - Total Volatile Basic Nitrogen TVC - Total viable counts
UV - Ultraviolet
UV/Vis - Ultraviolet-Visible
Symbols
a* - Red and green direction aw - water activity
xvii b* - Yellow and blue direction
C - Concentration of malondialdehyde (μmol) d - Dilution factor corresponding to the first dilution ∆E*ab - Color difference
∆a* - Difference in the value a* found between the sample color and the color of the standard ∆b* - Difference in the value b* found between the sample color and the color of the standard ∆L* - Difference in the value L* found between the sample color and the color of the standard Fc - Volume correction factor (moisture of sample)
H - Moisture content of the sample (%) L* - Lightness
m - Mass of the taking the test (g) M - Molar mass
ms - Mass of the sample (g) N - Number of microorganisms n=3 - Triplicate samples
n1 - Number of dishes retained in the first dilution n2 - Number of dishes retained in the second dilution p - Significance
v - Volume of the extract (mL)
V0 - Volume of hydrochloric acid added in the blank test (mL)
V1 - Volume of hydrochloric acid added in the diffusion control test (mL) V2 - Volume of hydrochloric acid added in the extract test (mL)
V3 - Volume of filtrate added in the periphery of the Conway cell (mL) W1 - Weight of the salmon sample before the coating application (g) W2 - Weight of the salmon sample after the coating application (g) W3 - Weight before the glaze is apply in the samples (g)
W4 - Weight after the glaze is apply in the samples (g)
W5 - Weight of the coated samples after the storage period (g) W6 - Weight of the glazed samples after the storage period (g) W7 - Weight of the uncoated samples (g)
W8 - Weight of the uncoated samples after the storage period (g)
xviii […] - Concentration (μmol/mL)
xix
List of Figures
Chapter 1. Fish
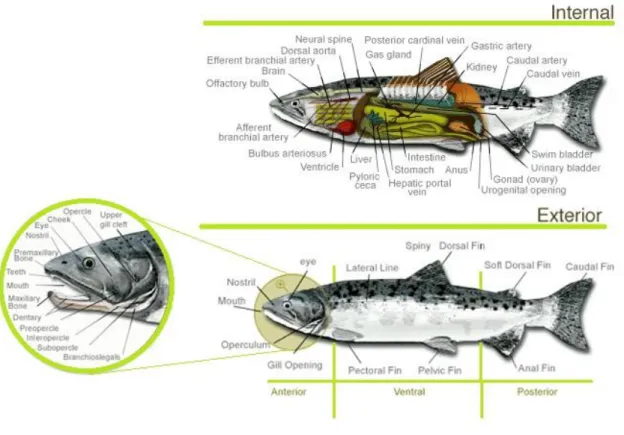
Figure 1.1. Representative scheme of internal and external anatomy of salmon. ... 8
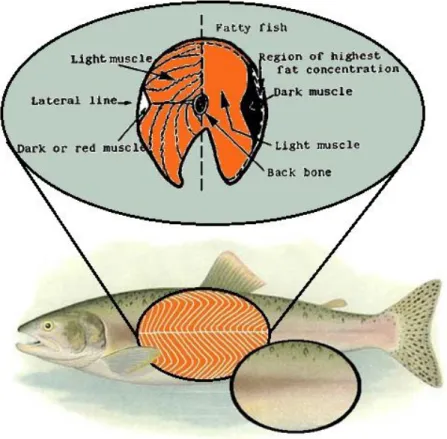
Figure 1.2. Diagram of fish muscle. ... 9
Figure 1.3. Chemical structure of chitin (a) and chitosan (b). ...15
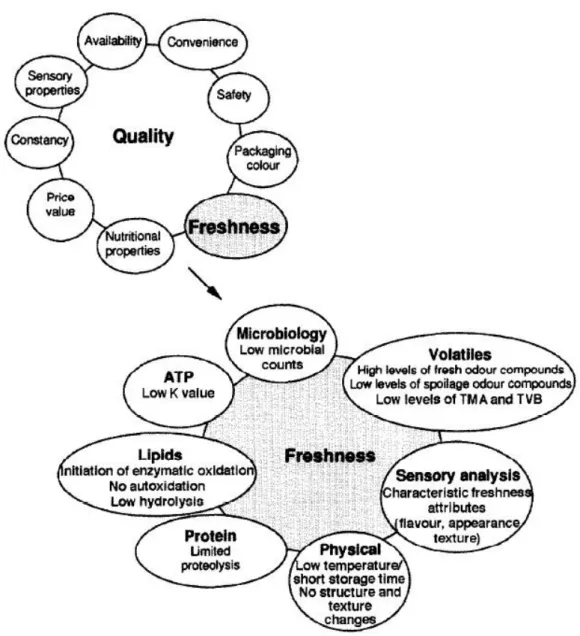
Chapter 2. Fish Quality – Freshness Figure 2.1. Relationship between quality and freshness. ... 18
Figure 2.2. Temperature ranges for different microbial life forms. ... 19
Figure 2.3. Autoxidation of polyunsaturated lipid. ... 21
Figure 2.4. TBA test reaction between 2-thiobarbituric acid and malonaldehyde, forming a colored compound, measured in a spectrophotometer at 530 nm. ... 21
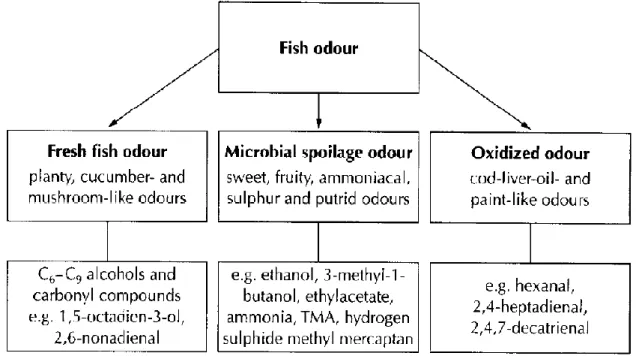
Figure 2.5. Categorization of fish odours and the volatile compounds that contribute to the characteristic odour of fresh, spoiled and oxidized fish. ... 22
Figure 2.6. Aerobic and anaerobic breakdown of glycogen in fish muscle. ... 25
Figure 2.7. Electromagnetic and visible spectra. ... 28
Figure 2.8. Different objects surfaces modifying the light. ... 28
Figure 2.9. RGB system – Color’s Additive Primaries. ... 29
Figure 2.10. Munsell Color System (HSL – the three dimensions of color). ... 30
Figure 2.11. Color space (CIE L*a*b*) – Mapping Color’s dimensions. ... 31
Figure 2.12. Illustrative scheme of perceptible versus acceptable differences. ... 32
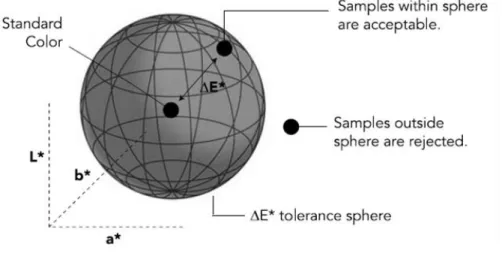
Figure 2.13. Tolerance sphere for acceptable color difference. ... 33
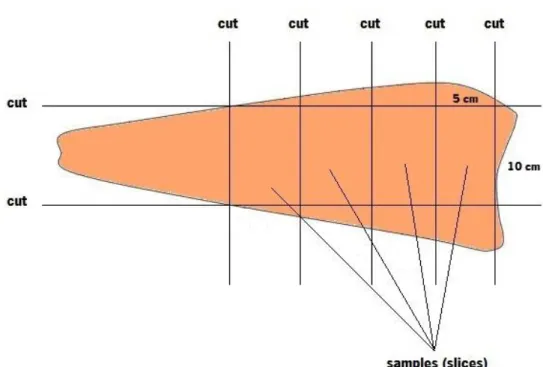
Chapter 3. Materials and Methods Figure 3.1. Illustration of the salmon fillet, exemplifying the scheme of cuts used. ... 39
Figure 3.2. Pilot-scale glazing tank (left) and dipping instrument – mesh (right) constructed in A151 316 stainless steel. ... 40
xx
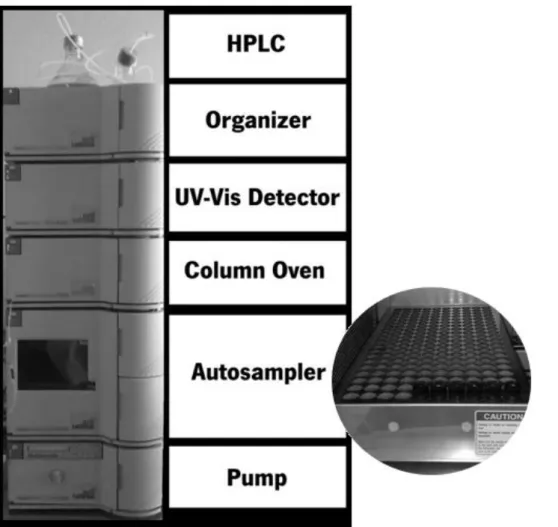
Figure 3.5. Organizational scheme of the HPLC equipment used. ... 48 Figure 3.6. Illustration of the pH meter and pH range typical for freshwater fish. ... 49 Figure 3.7. Illustration of the methodology and equipment used in the measurement of the color of salmon. ... 50 Chapter 4. Results and Discussion
Figure 4.1. Coating Loss (%) for salmon samples glazed with water ( Q0) and coated with 0.5% chitosan ( Q5) and 1.5% chitosan ( Q15) during 6 months of storage at -22 °C. Each bar represents the mean ± standard deviation of three replications. Different small letters in the same day and different capital letters in bars with the same color indicate a statistically significant difference (Tukey test, p<0.05)... 52 Figure 4.2. Weight Loss (%) of uncoated salmon samples from the control group ( QS) during 6 months of storage at -22 °C. Each bar represents the mean ± standard deviation of three replications. Different letters indicate a statistically significant difference (Tukey test, p<0.05). ... 53 Figure 4.3. Drip Loss (%) of salmon samples from the control group ( QS), glazed with water ( Q0) and coated with 0.5% chitosan ( Q5) and 1.5% chitosan ( Q15) during 6 months of storage at -22 °C. Each bar represents the mean ± standard deviation of three replications. Different small letters in the same day and different capital letters in bars with the same color indicate a statistically significant difference (Tukey test, p<0.05). ... 55 Figure 4.4. Thiobarbituric acid (TBA) values for salmon samples from the control group ( QS), glazed with water ( Q0) and coated with 0.5% chitosan ( Q5) and 1.5% chitosan ( Q15) during 5 months of storage at -22 °C. Each bar represents the mean ± standard deviation of three replications. Different small letters in the same day and different capital letters in bars with the same color indicate a statistically significant difference (Tukey test, p<0.05). ... 58 Figure 4.5. Total volatile basic nitrogen (TVB-N) values for salmon samples from the control group (
QS), glazed with water ( Q0) and coated with 0.5% chitosan ( Q5) and 1.5% chitosan ( Q15) during 6 months of storage at -22 °C. Each bar represents the mean ± standard deviation of three replications. Different small letters in the same day and different capital letters in bars with te same color indicate a statistically significant difference (Tukey test, p<0.05). ... 60
xxi
Figure 4.6. K-values for salmon samples from the control group ( QS), glazed with water ( Q0) and coated with 0.5% chitosan ( Q5) and 1.5% chitosan ( Q15) during 6 months of storage at -22 °C. Each bar represents the mean ± standard deviation of three replications. Different small letters in the same day and different capital letters in bars with the same color indicate a statistically significant difference (Tukey test, p<0.05). ... 61 Figure 4.7. pH values for salmon samples from the control group ( QS), glazed with water ( Q0) and coated with 0.5% chitosan ( Q5) and 1.5% chitosan ( Q15) during 6 months of storage at -22 °C. Each bar represents the mean ± standard deviation of three replications. Different small letters in the same day and different capital letters in bars with the same color indicate a statistically significant difference (Tukey test, p<0.05). ... 62 Figure 4.8. Color parameters for salmon samples from the control group for the coordinates L* ( QSL*), a* ( QSa*) and b* ( QSb*) during 3.5 months of storage at -18 °C. Each bar represents the mean ± standard deviation of three replications. Different letters in the same color coordinate indicate a statistically significant difference (Tukey test, p<0.05). ... 64 Figure 4.9. Color parameters for salmon samples from the group glazed with water for the coordinates L* ( Q0L*), a* ( Q0a*) and b* ( Q0b*) during 3.5 months of storage at -18 °C. Each bar represents the mean ± standard deviation of three replications. Different letters in the same color coordinate indicate a statistically significant difference (Tukey test, p<0.05). ... 64 Figure 4.10. Color parameters for salmon samples from the group coated with 0.5% of chitosan for the coordinates L* ( Q5L*), a* ( Q5a*) and b* ( Q5b*) during 3.5 months of storage at -18 °C. Each bar represents the mean ± standard deviation of three replications. Different letters in the same color coordinate indicate a statistically significant difference (Tukey test, p<0.05). ... 65 Figure 4.11. Color parameters for salmon samples from the group coated with 1.5% of chitosan for the coordinates L* ( Q15L*), a* ( Q15a*) and b* ( Q15b*) during 3.5 months of storage at -18 °C. Each bar represents the mean ± standard deviation of three replications. Different letters in the same color coordinate indicate a statistically significant difference (Tukey test, p<0.05). ... 65 Figure 4.12. ∆E*ab values for salmon samples from the control group ( QS), glazed with water ( Q0) and coated with 0.5% chitosan ( Q5) and 1.5% chitosan ( Q15) during 3,5 months of storage at -18 °C... 66
xxii
Figure A.1. Color grading obtained on the calibration curve. ... 75 Figure A.2. Calibration curve for the TBA method. ... 76 Figure A.3. Scheme illustrates the preparation of the various tests on Conway cell. ... 77 Figure A.4. Representation of the alkalization by the action of potassium carbonate to release volatile bases and their reception in a boric acid solution followed by titration, in the interior of Conway cell. ... 77 Figure A.5. Calibration curve of IMP. ... 79 Figure A.6. Calibration curve of ATP. ... 80 Figure A.7. Calibration curve of ADP. ... 80 Figure A.8. Calibration curve of Hx. ... 81 Figure A.9. Calibration curve of AMP. ... 81 Figure A.10. Calibration curve of HxR. ... 82 Figure A.11. Air temperature of industrial freezing chamber registered every 10 minutes by a data logger during frozen storage. ... 83 Figure A.12. Air temperature of freezing chamber registered every 10 minutes by a data logger during frozen storage. ... 83
xxiii
List of Tables
Chapter 4. Results and Discussion
Table 4.1. Total viable counts (TVC) values for frozen salmon samples (-20 °C) from the control group ( QS), glazed with water ( Q0) and coated with 0.5% chitosan ( Q5) and 1.5% chitosan (
Q15) after 6 months of storage at -22 °C; standard deviation corresponds to three replications . 56 Table 4.2. Total viable counts (TVC) values for refrigerated salmon samples (5.9 °C) from the control group ( QS), glazed with water ( Q0) and coated with 0.5% chitosan ( Q5) and 1.5% chitosan ( Q15) after 6 months of storage at -22 °C; standard deviation corresponds to three replications ... 57 Appendixes
Table A.1. Schematic representation of Standard Curve Determination for TBA method ...75 Table A.2. Scheme followed to obtain the calibration curves for K-value method ...79
1
Introduction
Nowadays, the changes in dietary patterns and the benefits credited to a healthy diet revitalized intensively all sectors responsible for food production, leading to the search for alternative processing, preservation and chemical alteration of these products (Fai et al., 2008). Marine foods attract great attention from consumers as a source of important nutritional components for a healthy diet (Simopoulos, 1997 cited in Rodriguez-Turienzo et al., 2011). Consequently, the consumption of fish containing valuable nutrients has recently increased (Kilincceker et al., 2009). In these contexts, the aim of this thesis and primary objective of this work focuses on assessing the effect of applying an edible chitosan-based coating on the quality of frozen fish, in order to study the possibility of using it as an alternative to water glaze, commonly applied in the fish industry. This coating was applied on frozen Atlantic salmon (Salmo salar) directly, and its effect on the shelf life of the fish was assessed, during frozen storage at -22 °C for 6 months.
With this in mind, this thesis was organized in two parts - Part I - State of The art and Part II - Experimental work. Part I is composed of two chapters, Chapter 1 and Chapter 2 and Part II is grouped in three chapters, Chapter 3, Chapter 4 and Chapter 5.
Chapter 1 provides an overview of the importance of fish in a healthy diet and the increased of his demand. This chapter also reflects on the changes in the fish industry in consequence of the increase of its consumption, while time providing an overview of this industry as a major employer. This chapter also mentions the traditional methods of fish conservation, such as freezing and glazing and other emerging methods, such as the edible coatings, in particular those that are based on chitosan. The concept of quality and its relationship with freshness, in addition to the different physical, chemical and biological processes that allows assessing it, are presented in Chapter 2.
Chapter 3 introduces methods, such as sample preparation, the preparation of the coating solutions, the transportation of samples and the determination of the values of TVC, TBA, TVB-N, K-value, pH, and color parameters, regularly used in the evaluation and control of fish quality during frozen storage. In Chapter 4, our results are discussed and in Chapter 5 the key findings of this thesis are summarized, as well as suggestions for improvement and future prospects.
3
5
Chapter 1. Fish
The demand for food that promotes health and well-being has increased in recent years. The populations of many industrialized countries are becoming older, richer, more educated and more health conscious. Fish has a particular prominence in this respect, following mounting evidence confirming the health benefits of eating fish. More stringent demands to assurance food safety are another high-profile issue that has emerged in recent years, in order to earn and maintain consumer confidence in fish (FAO, 2012).
Consumers are increasingly requesting product attributes that depend on the production process. They now demand guarantees that their food has been produced, handled and commercialized in a way that is not dangerous to their health, respects the environment and addresses various other ethical and social concerns. At the same time, they also want convenience and palatability.
Besides trying to address consumer’s requests, producers and major distributors are increasingly concerned about the sustainability, risk of depletion of marine stocks and the transparency in traceability systems – in order to trace the source, the quality, and the environmental and social impacts of food production and distribution (FAO, 2012).
Fuelled by changes in consumer taste and advances in technology, packaging, logistics and transport, the food industry produces appealing and healthy fish products. These diversified products include higher-value products, semi-processed and processed products, and products that are ready to eat or require little preparation before serving. This is accomplished by the insertion of improvements in storage and processing capacity, together with major innovations in refrigeration, ice-making, and food-packaging and fish-processing equipment (FAO, 2012).
6
The growth of the supply and consumption of fish
Capture fisheries and aquaculture supplied the world with about 148 million tonnes of fish in 2010, of which about 128 million tonnes was utilized as food for people. From the fish meant for direct human consumption, in 2010, 46.9% was live, fresh or chilled fish, followed by frozen fish with 29.3%. Prepared or preserved fish and cured fish represented 14.0% and 9.8% respectively from the total fish for human consumption (FAO, 2012).
The world food fish supply has grown in the last five decades, with an average growth rate of 3.2 percent per year in the period 1961–2009, outpacing the increase of 1.7 percent per year in the world’s population. Per capita, the world food fish supply increased from an average of 9.9 kg (live weight equivalent) in the 1960s to 18.4 kg in 2009. There are large variations across countries and regions of the world in the amount of total fish supply for human consumption, reflecting different eating habits and traditions, availability of fish and other foods, prices, socio-economic levels, and seasons. Differences are also evident within countries, with consumption usually higher in coastal areas (FAO, 2012).
Fish industry as an employer
Fisheries and aquaculture also provided livelihoods and income for an estimated 54.8 million people engaged in the primary sector of fish production in 2010, of which an estimated 7 million were occasional fishers and fish farmers. In addition to the primary production sector, fisheries and aquaculture provide numerous jobs in additional activities such as processing, packaging, marketing and distribution, manufacturing of fish-processing equipment, net and gear making, ice production and supply, boat construction and maintenance, research and administration. All of this employment, together with dependants, is estimated to support the livelihoods of 660 - 820 million people, or about 10 – 12% of the world’s population (FAO, 2012).
7
1.2. Fish - Chemical composition and structure
Due to its nutritional characteristics, fish is an important source of high grade protein and the knowledge of its composition is essential if the fullest use is to be made of it (Murray & Burt, 2001). In matter of fact, chemical composition of fish is very important not only for the consumer, but also for the processor, who needs to know the nature of the raw material before he can apply correctly the techniques of chilling, freezing, smoking or canning; the nutritionist, who wants to know what contribution fish can make to the diet and to health; and the cook, who must know the fish in order to prepare it for the table (Murray & Burt, 2001).
However, chemical composition varies widely from fish to fish of the same species and also within an individual fish, making accuracy impossible. Thus, measurement of constituents of fish products is necessary to meet specifications or to comply with regulations (Murray & Burt, 2001).
The scheme in Figure 1.1 shows the part internal and the exterior surface of salmon. The blocks of muscle are separated by thin sheets, which are known as connective tissue; these are curved within the fillet and run from the backbone to the skin. In fresh fish the muscle blocks are firmly attached to the connective tissue and the surface of a cut fillet is smooth and continuous. There are also tiny blood vessels running through the muscle. The connective tissue accounts for only a small percentage of the total weight of the muscle, making the fish less tough to eat than meat (Murray & Burt, 2001).
Fish muscle (Figure 1.2) is of two kinds, light muscle and dark muscle. In white fish, such as cod, there is a small strip of dark or red muscle just under the skin on both sides of the body, running beneath the lateral line. In fatty fish, such as salmon, the strips of dark muscle are much larger in proportion and contain higher concentrations of fat and certain vitamins. Since it is not usually practicable to separate the dark fatty muscle from the light muscle when preparing fish for cooking, as is made with the fat from meat, usually the values given in the tables for composition of flesh are for the total muscle, taking light and dark together (Murray & Burt, 2001).
Components of fish muscle
The principal components of fish muscle, the edible part of the fish, are water, proteins and fat. Other minor components are carbohydrates, minerals, vitamins and extractives (sugars, free amino acids and nitrogenous bases) (Murray & Burt, 2001).
8
Source: adapted from http://www.greatcanadianrivers.com/salmon/species-biology-internal.html, consulted in 09/05/2013
Figure 1.1.Representative scheme of internal and external anatomy of salmon.
According to FAO (2012), fish and fishery products represent a valuable source of nutrients of fundamental importance for diversified and healthy diets. Not only, fish is low in saturated fats, carbohydrates and cholesterol, but also provides high-value protein, a wide range of essential micronutrients, including various vitamins (D, A and B), minerals (including calcium, iodine, zinc, iron and selenium) and polyunsaturated omega-3 fatty acids (docosahexaenoic acid and eicosapentaenoic acid). Therefore, the consumption of fish, even in small amounts can have a significant positive nutritional impact by providing essential amino acids, fats and micronutrients that are scarce in vegetable-based diets. There is also evidence of beneficial effects of fish consumption in relation to coronary heart disease, stroke, age-related macular degeneration, mental health, and in terms of growth and development, in particular for women and children during gestation and infancy for optimal brain development (FAO, 2012).
Water
The main constituent of fish flesh is water, which represents 30 to 90 per cent of the fillet weight. Water, in fresh fish muscle, is tightly bound to proteins in the structure in such a way that it
9
cannot readily be expelled even under high pressure. After prolonged chilled or frozen storage, however, proteins are less able to retain all the water, and some of it, containing dissolved substances, is lost as drip. Frozen fish that are stored at too high a temperature, for example, will produce a large amount of drip and consequently quality will suffer (Murray & Burt, 2001).
Source: adapted from http://www.earthlife.net/fish/muscles.html and http://www.fao.org/wairdocs/tan/x5916e/x5916e01.htm, consulted in 09/05/2013
Figure 1.2.Diagram of fish muscle. Proteins
The amount of protein in fish muscle is usually somewhere between 15% and 20%, but values lower than 15% or as high as 28% are occasionally met with in some species. All proteins, including those from fish, are chains of chemical units linked together to make one long molecule. These units, of which there are about twenty types, are called amino acids, and certain of them are essential in the human diet for the maintenance of good health. Two essential amino acids called lysine and methionine are generally found in high concentrations in fish proteins. Fish protein provides a good combination of amino acids that is highly suited to man’s nutritional requirements (Murray & Burt, 2001).
10
The fat content can vary greatly among the various species of fish; even in the same specie it can be considered a seasonal variation in fat content of fatty fish. The term fat is used for simplicity, although the less familiar term "lipid" is more correct, since it includes fats, oils and waxes, as well as more complex, naturally-occurring compounds of fatty acids. As the fat content rises, so the water content falls, and vice versa; the sum of water and fat in a fatty fish is fairly constant at about 80%. Although protein content falls very slightly when the fat content falls it nevertheless remains fairly constant somewhere between 15% and 18%. The fat is not always uniformly distributed throughout the flesh of a fatty fish. For example in Pacific salmon there may be nearly twice as much fat in muscle from around the head as there is in the tail muscle (Murray & Burt, 2001).
1.3. Fish Conservation
Fish is a very versatile food commodity, appearing in a great variety of ways and product forms, such as live, fresh, chilled, frozen, heat-treated, fermented, dried, smoked, salted, pickled, boiled, fried, freeze-dried, minced, filleted, powdered or canned, or as a combination of two or more of these forms (FAO, 2012). While all of these methods of preserving fish at long-term are used,the most important ones are those based on the action of low temperatures, because they are better able to preserve the nutritional and sensory characteristics of the products (Gonçalves et al., 2009).
Fish processing is evolving, from simple gutting, heading or slicing to more advanced value-addition, such as breading, cooking and individual quick-freezing, depending on the commodity and market value (FAO, 2012).
1.3.1. Freezing
Freezing represents the main method of processing fish for human consumption and it is the most used method in the control and/or reduction of biochemical changes that occur in fish during storage. It accounted for 55.2% of total processed fish for human consumption and 25.3% of total fish production in 2010. The proportion of frozen fish grew from 33.2% of total production for human consumption in 1970 to reach a record high of 52.1% in 2010. Processors of traditional
11
products, in particular of canned products, have been losing market shares to suppliers of fresh and frozen products as a result of long-term shifts in consumer preferences (Fan et al., 2009; FAO, 2012; Kilincceker et al., 2009; Rodriguez-Turienzo et al., 2011; Sathivel et al., 2007). However, there are reports of progressive loss of intrinsic and sensory quality of frozen fish during storage (Vanhaecke et al., 2010). In fact, if on one hand, the use of temperatures below -12 °C inhibit microbial growth and slows down enzymatic activity (Jiang & Lee, 2004 cited in Rodriguez-Turienzo et al., 2011), on the other hand, freezing is not able to completely inhibit microbial and chemical reactions, such as lipid oxidation, protein denaturation and dehydration surface (sublimation and recrystallization of ice crystals) leading to deterioration of fish quality during prolonged storage, resulting in off-flavors, rancidity, dehydration, weight loss, loss of juiciness, drip loss and toughening, as well as microbial spoilage and autolysis (Fan et al., 2009; Gonçalves et al., 2009; Rodriguez-Turienzo et al., 2011 Sathivel et al., 2007).
Although, despite the occurrence of a certain deterioration of the quality of frozen foods during storage, freezing increases the shelf life of the products if carried out correctly. Thus, the extent of loss quality depends on many factors including the rate of freezing and thawing, storage temperature, temperature fluctuations, abuse of freeze-thaw during storage, transport, exposure and consumption. It should be noted that freezing does not improve product quality; the final quality depends of the quality of the product in the moment of freezing and the conditions during freezing, storage and distribution (Gonçalves et al., 2009).
Effect of freezing rate on ice crystal structure
Hayes et al. (1984) cited in Evans (2008) define the freezing rate in relation to the velocity of movement of the ice-water freezing front. The rates of freezing determine the type, size and distribution of ice formation.
Evans (2008) points out that freezing removes water form the food matrix by forming ice crystals. Although ice crystals remain in the food, the remaining water that is in contact with the food matrix becomes concentrated with solutes and it’s aw becomes low. Foods with a lower water activity are more stable, since most microorganisms cease functioning below the water activity of about 0.7. However, the formation of ice crystals can downgrade the quality of the food by three mechanisms: mechanical damage to the food structure, cross-linking of proteins and limited re-absorption of water on thawing (drip loss).
12
Products with a more flexible fibrous structure which separates during freezing instead of breaking, are not seriously damage their texture, while products that have a more rigid cell structure may be damaged by ice crystals. The extent of damage depends on the size of the crystals and hence on the rate of heat transfer. During slow freezing, ice crystals grow in intercellular spaces and deform and rupture adjacent cell walls. Cells become dehydrated and permanently damaged by the growing crystals. On thawing, cells do not regain their original shape and turgidity. The food is softened and cellular material leaks out from ruptured cells, increasing the drip loss. In fast freezing, smaller ice crystals form within both cells and intercellular spaces. There is little physical damage to cells, and minimal dehydration of the cells. The texture of the food is thus retained to a greater extent. However, very high freezing rates may cause stresses within some foods that result in splitting or cracking of the tissues. Zhu et al. (2004) confirms this by saying that freezing process was generally much more important than thawing for drip loss, once slower freezing produces larger extra-cellular ice crystals, resulting in more tissue damage and thawing loss (Fennema, 1973 cited in Zhu et al., 2004).
Another process which causes the same result is migratory recrystallisation, largely caused by fluctuations in the storage temperature. This process causes the melting of ice crystals and movement of moisture to regions of lower vapor pressure, which leads areas of the food nearest to the source of heat to become dehydrated (freezer burn). When the temperature falls again, the existing ice crystals increase their size. There is therefore a gradual reduction in the numbers of small crystals and an increase in the size of larger crystals, resulting in loss of quality similar to that observed in slow freezing. This is minimized by packaging in moisture-proof materials (Fellows, 2000). For this reason, as soon as seafood is removed from a freezer, they should be glazed or wrapped (unless they have been packaged before freezing) and immediately transferred to a low temperature store to rapidly refreeze and to preserve taste, smell and texture as well as to minimize thaw drip loss (Gonçalves et al., 2009; Jose & Sherief, 1993 cited in Jacobsen & Fossan, 2001).
1.3.2. Glazing
The application of a thin layer of ice on the surface of the frozen products by spraying or dipping into a water bath, it is common practice in frozen fish industry, in a process termed glazing (Gonçalves et al., 2009; Vanhaecke et al., 2010). This technique aims at minimizing the impact of
13
undesirable changes on the quality of frozen products during storage (Gonçalves et al., 2009; Vanhaecke et al., 2010). This water glaze excludes air from the surface of the product, thus reducing the rate of oxidation and also serves as a protective barrier to temperature fluctuations, allowing the glaze evaporate instead tissue water, when an increase of temperature occurs (Fossan & Jacobsen, 2001 cited in Gonçalves et al., 2009). It is intended that the entire surface of the product be completely and uniformly glazed, typically with a percentage of glazing applied between 4% and 10%, although it may vary between 2% and 20% (Vanhaecke et al., 2010). This percentage depends on the immersion time, the temperature of fish and water and the size and shape of the fish (Fossan & Jacobsen, 2001; Johnston et al., 1994; Pedersen & Jacobsen, 1997 cited in Gonçalves et al., 2009). Thus, for a glazing less than 6%, a deficiency can occur in product protection and for a glazing greater than 12%, commercial disputes can be generated because excess water would entail additional costs for consumers (Vanhaecke et al., 2010).
According to DL nº 37/2004, in an attempt to protect the consumers interests was adopted an official method for sampling and determination of drained net weight, which gave rise to NP 4355:2002. It has also become mandatory to show in the foodstuffs labels, information about your drained net weight and its price, which allowed consumers to know the amount of water that is being sold with the product.
1.3.3. Edible coatings/films
New technologies are being use to ensure the conformity of frozen fish during storage trying to satisfy the growing demand for this product. In some experiments, natural products were used to ensure the quality of the fish and the extension of its validity (Sathivel et al., 2007; Souza et al., 2010).
Edible films and coatings have become one of the most promising alternatives to protect the products against mechanical damage, physical, chemical and microbiological activities. These are thin layers of edible material that, when applied in food, assist in their preservation, distribution and marketing (Falguera et al., 2011; Pinheiro et al., 2010).
The application of edible coating in foods has been evaluated by several authors as: Ribeiro et al. (2007) on the surface of strawberries; Cerqueira et al. (2009b) in tropical fruits such as acerola (Malpighia emarginata), cajá (Spondias lutea), mango (Mangifera indica), pitanga (Eugenia uniflora) and seriguela (Spondias purpurea); Cerqueira et al. (2009a) on the surface of cheese;
14
Pinheiro et al., 2010). Other examples can be found regarding the development of coatings to protect food products like garlic (Botrel et al., 2007), India cherries (Ziziphus mauritina cv. Cuimi) (Qiuping & Wenshui, 2007) and red pitaya (Hylocereus undatus) (Chien et al., 2007)(cited in Fai et al., 2008).
These coatings/films have particular properties that make them particularly useful for application in perishable products. Some of those properties are structural resistance to water and microorganisms, functional attributes (antibiotics, antifungal, antibacterial, etc.), mechanical properties (tension and flexibility), optical properties (brightness and opacity), the barrier effect against gases flow and high acceptability (Falguera et al., 2011).
The main difference between films and coatings is how they are applied in food. While the coatings are applied by immersion of the product in a solution, the films are first shaped as solid sheets, like a package, and then applied to the product (Falguera et al., 2011; Kilincceker et al., 2009).
Coatings/films can be produced by a variety of biodegradable polymers such as polysaccharides, proteins, lipids, resins, with or without the addition of plasticizers and surfactants. The functionality and behavior of edible films and coatings depend mainly on their mechanical and transport properties, which in turn vary with their composition, formation process, and the method of application in the product (Pinheiro et al., 2010; Rodriguez-Turienzo et al., 2011).
These coatings/films create a modified atmosphere that restricts the transfer of gases such as O2, CO2 and aromatic compounds, influencing several parameters in fresh and minimally processed food, such as color, texture, sensory quality, antioxidant properties, production of ethylene volatile compounds and microbial growth as a result of anaerobic processes (Falguera et al., 2011; Pinheiro et al., 2010; Rodriguez-Turienzo et al., 2011). Developed to reduce, inhibit or prevent the growth of microorganisms on food surfaces where microbial contamination is more significant, their application innovated the concept of active packaging (Falguera et al., 2011; Pereira et al., 2010).
1.3.3.1. Chitosan
Chitosan (Figure 1.3 (b)) is a natural amino-cationic hetero-polymer composed of ß-1.4 D-glucosamine units, linked to N-acetylD-glucosamine residues, which can be obtained by chitin
15
deacetylation. Chitin (Figure 1.3 (a)) is an abundant natural polymer, a linear polysaccharide alkali-acid insoluble, which has ß-1,4 N-acetylglucosamine as monomeric unit. It can be found in the exoskeleton of crustaceans, insects and fungal cell walls (Fai et al., 2008).
The use of chitin in many industrial processes generates a large amount of solid waste. The valorization of these residues through their transformation into other products, such as chitosan, is a way to reduce wastage (Pinheiro et al., 2010).
Chitosan attracts much attention in the food industry due to its viscoelastic properties and its particular properties such as non-toxicity, bioactivity, biodegradability, biocompatibility, reactivity, selective permeability, polyelectrolytic action, the ability to form gels and films, the adsorption capacity, the ability antibacterial, antifungal, antimicrobial and antioxidant. Thus, the chitosan-based materials can be used for producing edible films and coatings resistant, durable and flexible, with mechanical properties comparable to commercial polymers (Fan et al., 2009; Pinheiro et al., 2010; Sathivel et al., 2007).
Source: removed from Fai et al. (2008)
17
Chapter 2. Fish Quality - Freshness
Monitoring and control quality of frozen fish is one of the fundamental purposes of the seafood industry. Many parameters are involved in the definition of quality (Figure 2.1), including safety, nutritional and sensory properties, price, convenience and constancy, color packaging, availability and freshness (Ólafsdóttir et al., 1997; Souza et al., 2010). In fact, the maintenance of quality parameters, by developing effective techniques on their conservation, it is essential to make food more appealing to the end consumers (Gonçalves et al., 2009; Pinheiro et al., 2010). The change of one of these parameters affects largely the product acceptability by the consumers and consequently also the commercial value (Rodriguez-Turienzo et al., 2011).
Freshness is one of the most important parameters for the quality of the final product. In fact, quality is a function of freshness, although this is not a priori a factor sufficient to guarantee it. Freshness can be translated by some sensory, (bio)chemical, physical and microbiological parameters determined by different analyzes, which extend from the time of harvesting to product deterioration. These tests claim to detect variations in flavor, texture, color, odor, and other parameters that affect the freshness and alter perception and consumer satisfaction (Kilincceker et al., 2009; Ólafsdóttir et al., 1997).
2.1. Microbiology
2.1.1. Total Viable Counts (TVC)
The microbial activity is the main factor limiting the shelf life of fresh fish, and the main cause of its deterioration. The total viable count (TVC) is used as an acceptability index in standards, guidelines and specifications, since this method can provide a useful measure of the freshness of fish (Ólafsdóttir et al., 1997). According to ICMSF (1986), an aerobic plate count (APC) is recommended for all products as a good indicator from storage length and conditions of products prior to stabilizing processes such as freezing. Thus APC is indicative of general quality and, to a lesser extent, of handling and storage procedures.
Newly caught fish contain a diverse microflora, usually around 102 -106 CFU/g on whole fish and cut fillets. Usually, in fish products, TVC around 107-108 CFU/g, lies at the point of sensory rejection. Nevertheless, standards, guidelines and specifications often use much lower TVC as
18
use, because a correlation between TVC and the remaining shelf life is assumed, although generally not known (Ólafsdóttir et al., 1997). In matter of fact, an increase in APC to levels in excess of 106 per gram is usually indicative of long storage at chilling temperatures or temperature abuse prior to freezing (ICMSF, 1986).
In order to properly evaluate fish freshness, microbial methods are developed together with mathematical models, which express the effects of storage conditions - such as temperature and atmosphere - on the correlation between microbial numbers and remaining shelf life. The most promising results were obtained with relatively slow detection methods such as plate counts and other growth techniques involving an incubation period (Ólafsdóttir et al., 1997).
Source: removed from Ólafsdóttir et al. (1997)
19 Psychrophilic and psychrotrophic microorganisms
Microorganisms can be classified according to their growth rate at different temperatures. According to this classification, microorganisms that are expected to grow at freezing temperatures will be psychrophiles and psychrotrophs (Figure 2.2).
Source: removed from http://classroom.sdmesa.edu/eschmid/Lecture4-Microbio.htm, consulted in 14/06/2013
Figure 2.2.Temperature ranges for different microbial life forms.
Much of life on Earth has evolved to colonize low-temperature environments. In fact, the cold biosphere (temperatures permanently below 5 °C) represents by far the largest fraction of the global biosphere (Casanueva et al., 2010; Cavicchioli, 2006; Feller & Gerday 2003; Margesin & Miteva, 2011; Siddiqui & Cavicchioli, 2006 cited in Siddiqui et al., 2013). Actually, the lowest temperature limit for life seems to be around -20 °C, which is the value reported for bacteria living in permafrost soil and in sea ice. Microbial activity at such temperatures is restricted to small amounts of unfrozen water inside the permafrost soil or the ice, and to brine channels. Aerobic and anaerobic bacteria are found at these temperatures (D’Amico et al., 2006).
Psychrophilic microorganisms have successfully colonized all permanently cold environments from the deep sea to mountain and Polar Regions. Some of these organisms, depending on their optimal growth temperature, are also known by the terms psychrotolerant or psychrotroph, but the general term used to designate all microorganisms growing well at
20
survive and proliferate at low temperatures implies that they have overcome key barriers inherent to permanently cold environments, such as reduced enzyme activity; decreased membrane fluidity; altered transport of nutrients and waste products; decreased rates of transcription, translation and cell division; protein cold-denaturation; inappropriate protein folding; and intracellular ice formation (D’Amico et al., 2006).
2.2. Lipids
2.2.1. 2-Thiobarbituric acid (TBA)
For measuring lipid oxidation in foods, different analytical methods are used. It is necessary to select a proper and adequate method for a particular application. Five groups divide the available methods to monitor lipid oxidation in foods, based on what they measure: the absorption of oxygen, the loss of initial substrates, the formation of free radicals, and the formation of primary and secondary oxidation products. A number of physical and chemical tests, including instrumental analyses, have been employed in laboratories and the industry for measurement of various lipid oxidation parameters. These include the weight-gain and headspace oxygen uptake method for oxygen absorption; iodometric titration, ferric ion complexes, and Fourier transform infrared (FTIR) method for peroxide value; chromatographic analysis for changes in reactants; spectrometry for conjugated dienes and trienes, 2-thiobarbituric acid (TBA) value, p-anisidine value (p-AnV), and carbonyl value; Rancimat and Oxidative Stability Instrument (OSI) method for oil stability index; and electron spin resonance (ESR) spectrometric assay for free-radical type and concentration; differential scanning calorimetry (DSC) and nuclear magnetic resonance (NMR). In addition, sensory tests provide subjective or objective evaluation of oxidative deterioration, depending on certain details (Shahidi & Zhong, 2005).
Due to its lipid composition, fish is highly susceptible to oxidation, which translates into changes in odor, flavor, texture, color and nutritional value. Oxidation becomes an important factor of deterioration, particularly at temperatures below 0 °C (Ólafsdóttir et al., 1997), and results from the instability of primary oxidation products, such as hydroperoxides, which decompose into secondary oxidation products such as aldehydes, ketones, alcohols, hydrocarbons, volatile organic
21
acids and epoxy compounds, among others (Figure 2.3) (Mendes et al., 2009; Shahidi & Zhong, 2005).
Source: removed from Huss, 1995 available in
http://www.fao.org/docrep/v7180e/V7180e06.htm#5.4%20Lipid%20oxidation%20and%20hydrolysis, consulted in 14/06/2013
Figure 2.3.Autoxidation of polyunsaturated lipid.
Malondialdehyde (MDA), one of the most important products of oxidation, is often used as marker of oxidative damage in biological samples and in food. A simple method for the determination of MDA is the spectrophotometric detection of thiobarbituric acid-malondialdehyde complex (TBA-MDA) obtained after reaction with 2-thiobarbituric acid (TBA) at low pH and high temperature (Figure 2.4)(Mendes et al., 2009).
Source: adapted from Bastos et al. (2012)
Figure 2.4.TBA test reaction between 2-thiobarbituric acid and malonaldehyde, forming a colored compound, measured in a spectrophotometer at 530 nm.
Although the TBA test is frequently used to assess the oxidative state of a variety of food systems, it has limitations, such as lack of specificity and sensitivity, since many other substances may react with the TBA reagent and contribute to absorption, causing an overestimation of the
22
alkanals, 2-alkenals, 2.4-alkdienals, ketones, ketosteroids, acids, esters, proteins, sucrose, urea, pyridines, and pyrimidines, also referred to as TBARS (Shahidi & Zhong, 2005).
2.3. Volatiles
2.3.1. Total Volatile Basic Nitrogen (TVB-N)
Odor is one of the most important parameters used to evaluate fish freshness, which can be monitored by measurement of characteristic volatile compounds. Several of these compounds can be used to monitor the freshness or spoilage stage of fish and to assess its quality, including the value of total volatile nitrogen (TVB-N). These volatile compounds can be divided into three groups based on their origin, as illustrated in Figure 2.5 (Ólafsdóttir et al., 1997). Extractive compounds, particularly the volatiles, whose concentration in fish varies directly with time of storage, have long been studied since they may provide indicators of the quality of fish. When fish is stored after capture, the amount of some of the extractives present will change with time; thus measurement of the amount can often indicate the storage time and hence indirectly the quality (Murray & Burt, 2001).
Source: removed from Ólafsdóttir et al. (1997)
Figure 2.5. Categorization of fish odours and the volatile compounds that contribute to the characteristic odour of fresh, spoiled and oxidized fish.
23
The TVB-N limit established for the various fish categories is:
25 mg nitrogen/100 g Sebastes ssp.
Helicoelenus dactylopterus Sebastichtys capensis
30 mg nitrogen/100 g
species belonging to the family pleuronecitidae (with the exception of halibut) - Hippoglossus sp.
35 mg nitrogen/100 g Salmo Salar
species belonging to the family Merlucciidae species belonging to the family Gadidae
Routine methods used to control the threshold TVB-N are the following:
microdiffusion method described by Conway and Byrne (1933)
direct distillation method described by Antonacopoulos (1968)
distillation of an extract deproteinized with trichloroacetic acid [Codex Alimentarius Committee on Fish and fishery products (1968)] (Directive 95/149/EC).
2.4. Adenosine-5’-triphosphate (ATP)
2.4.1. K-value
Oxidation starts immediately after catch, but becomes particularly important for shelf life only at temperatures below 0 °C, when oxidation rather than microbial activity becomes the major spoilage factor. The initiation of lipid oxidation arises from various early post mortem changes in fish tissues (Ólafsdóttir et al., 1997).
Rigor mortis is one of the most prominent changes in muscle occurring soon after death. When fish are killed while relaxed, creatine phosphate is degraded prior to the breakdown of adenosine triphosphate (ATP) (Figure 2.6). When the creatine phosphate and ATP reach about the same concentration as ATP, ATP content begins to decrease and rigor mortis starts. Rigor mortis occurs when crossbridge cycling between myosin and actin in myofibrils ceases, and permanent actin and myosin linkages are formed. However, rigor mortis is resolved after some time. Possible
24
connective tissue or a weakening of myosin-actin junctions (Wang et al., 1998). In post mortem fish muscle degradation of adenosine triphosphate (ATP) proceeds according to the sequence (Ólafsdóttir et al., 1997; Özogul et al., 1999; Souza et al., 2010):
ATP (adenosine thriphosphate) → ADP (adenosine diphosphate) → AMP (adenosine monophosphate) → IMP (inosine monophosphate) → HxR (inosine) → Hx (hypoxanthine)
Following death, ATP is rapidly degraded to IMP by endogenous enzymes (autolysis). The further degradation of IMP to inosine and hypoxanthine is much slower, and is catalyzed mainly by endogenous IMP phosphohydrolase and inosine ribohydrolase, with a contribution from bacterial enzymes as storage time increases. Therefore, the degradation of ATP is parallel to loss of freshness of the fish. Thus, a chemical index of fish freshness is appealing because it is quantifiable, objective and lends itself to automation. ATP alone cannot be used because it is so rapidly converted to IMP and the concentrations of its intermediate degradation products rise and fall, making them unreliable indexes of freshness. As a result, attention has focused on inosine and hypoxanthine, the terminal catabolites of ATP. Inosine accumulates in some species of fish whereas hypoxanthine accumulates in others as terminal catabolites (Ólafsdóttir et al., 1997). The K-value is used as an index for the estimation of fish freshness and it is defined as the ratio of the sum of inosine and hypoxanthine concentrations to the total concentration of ATP metabolites (Lin, 1993; Ólafsdóttir et al., 1997; Souza et al., 2010). So, a fresh fish will have a low K-value. A shortcoming of the K-value as a freshness index is its dependence on a variety of variables. It varies between species owing to differences in rates of ATP degradation. It also varies with post mortem time and temperature storage conditions, handling conditions and method of kill. Thus, a profile of K-value versus time must be established for each species and its specific handling and storage conditions before K-value measurements can be used to evaluate freshness. Following acid extraction and neutralization, metabolites are separated by ion-exchange chromatography or HPLC and quantified by their absorbance. Although other methods have been used, HPLC method is the most reliable (Ólafsdóttir et al., 1997).
25
Source: removed from Huss, 1995 available in
http://www.fao.org/docrep/v7180e/V7180e06.htm#5.4%20Lipid%20oxidation%20and%20hydrolysis, consulted in 14/06/2013)
Figure 2.6.Aerobic and anaerobic breakdown of glycogen in fish muscle.
2.5. pH
High water-holding capacity, neutral pH values, enzymes contained in the tissues, and lower connective tissue content have acceleratory effects on the process of spoiling (Kilincceker et al., 2009). According to Huss (1995), the knowledge about the pH of fish meat may give valuable information about its condition. At the moment of fish death, the normal respiration process cannot occur, the oxygen supply is interrupted, the blood circulation fails and the production of energy is limited. So, in the beginning, because of rigor mortis, the maximum level of lactic acid is present in the structure, decreasing the pH. Although, the pH of the fish fillet increases, in the post mortem period, in consequence of the decomposition of nitrogenous compounds, by the proteolytic bacteria and autolytic enzymes. This increase in pH has a negative effect on the quality of the product during storage; especially, the sensorial characteristics such as odor, color, and texture (Shenderyuk & Bykowski, 1989 cited in Kilincceker et al., 2009).
Fan et al. (2009) confirms this trend claiming the pH value decreases initially and then increases, indicating similar observations by Alasalvar et al. (2001) and Manju et al. (2007). The initial pH decrease may be attributed to the dissolution of CO2 in the fish sample, while the increase of pH was postulated to be due to an increase in volatile bases produced, e.g. ammonia and trimethylamine (TMA), by either endogenous or microbial enzymes (Manat et al.,2005; Ruiz- Capillas & Moral, 2001 cited in Fan et al.,2009).
26
cause changes in pH values of fish muscle; this is probably due to the increase in concentration of substances in the water that remains unfrozen in frozen foods and modifies the acid–base equilibrium; there is a tendency towards higher acidity (Jiang & Lee, 2004 cited in Rodriguez-Turienzo et al., 2011).
2.6. Sensory Analysis
2.6.1. Color
Color is all around us. Although, an infinite number of colors surround us, nothing really has color. Color is a perception and subjective interpretation, generated in the eye-brain system in response to given stimuli. Color communicates and sells, driving the sale of virtually every consumer product in the world. It evokes a wide range of emotions that draw the buyer to the product (Hewlett-Packard Development Company, 2008; Konica Minolta, 2003; X-Rite, 2004).
Color, as one aspect of appearance, is one of the major attributes that affect the consumer perception of quality. It has to be within an expected range for food acceptance, and the degree of acceptability is judged within that range. Nearly every food product has an acceptable range of color, depending on a wide range of factors, like ethnic origin of the consumer and of the food, age and sex of the consumer, physical surroundings at the time of viewing, health consciousness of the consumer, physical well-being, among others (Francis, 1995; HunterLab, 2008). This makes color an important marketing communication tool and a crucial part of the selling process, interfering in buyer decision (Garber et al., 2000). So, measurement is the key to total production control, allowing the establishment of precise measurement standards that can be repeated in the process production of identical items within quality tolerances (X-Rite, 2004). To use color effectively, it must be kept under control, answering the customer’s specifications. The best way to control color is by measuring it, because if you can measure color, you can control it.
Light, object and viewer are three essential elements to perceive color, since it results from an interaction between them. In matter of fact, in total darkness and if we close our eyes, we cannot see anything, not even colors. And if there is only an object, the color simply does not exist. All three elements must be present for the color as we know it exists. For the viewer to perceive the light as a distinct color, it must be modified by the object (Konica Minolta, 2003; X-Rite, 2004).
27 Light
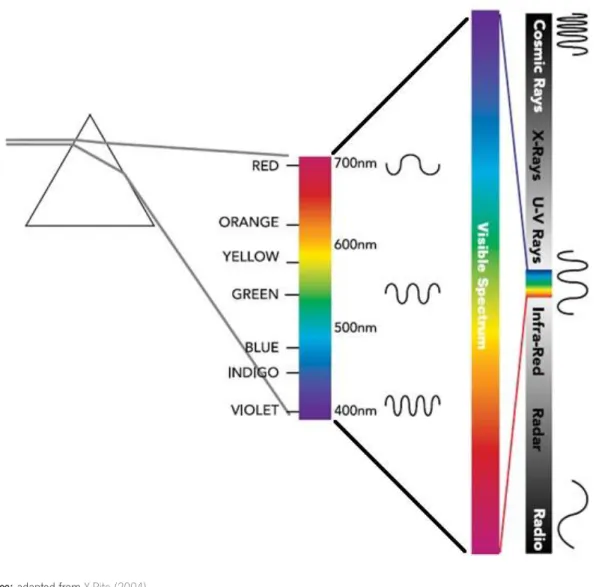
The light is just one of several electromagnetic waves that exist in space and which together constitute the electromagnetic spectrum (Figure 2.7). The region of visible light is only a small part of the spectrum located between about 400-700 nm. The light reflected from an object, which we recognize as being his color, is the mixture of light at various wavelengths, within the visible region. The human eye can see light in the visible region of the electromagnetic spectrum, however, "light" is not the same as "color". The light is radiation that stimulating the retina of the eye, making it vision possible. The stimulation of the eye is transmitted to the brain, and it is here that the concept of "color" first occurs as the brain's response to information received from the eye. These stimuli are perceived by the brain as a particular color. Exactly which color is perceived depends on the composition of wavelengths in the light waves. However, our vision system responds to each individual wavelength. For instance, in passing a beam of white light through a prism, the light is dispersed and different colors are seen as respond of the eyes to each individual wavelength. So, different wavelengths cause us to see different colors. On the other hand, we rarely see all wavelengths at once (pure white light), or just one wavelength at once. Color appears when light is modified into a new composition of many wavelengths by interaction with an object. This is how all objects get their color - by modifying light, which is send to our eyes as a unique composition of wavelengths (HunterLab, 2008; Konica Minolta, 2003; X-Rite, 2004).
Object
Every object absorbs and reflects light spectrum into portions and different amounts. When light waves strike an object, the object’s surface absorbs some of the spectrum’s energy, while other parts of the spectrum are reflected back from the object. The modified light that is reflected from the object has an entirely new composition of wavelengths. Light can be modified by striking a reflective object such as paper; or by passing through a transmissive object such as film. Reflected, transmitted, or emitted light is, in the purest of terms, “the color of the object” (Figure 2.8). There are as many different colors as there are different object surfaces, because each object affects light in its own unique way. The color of the object varies with the viewing conditions, viewing angle and angle measurement (Konica Minolta, 2003; X-Rite, 2004).
28
Source: adapted from X-Rite (2004)
Figure 2.7.Electromagnetic and visible spectra.
Source: removed from X-Rite (2004)
29
Viewer
Without the viewer, there would be no sensory response that would recognize or register the wavelengths as a unique “color.” If an object is not seen, he doesn’t have color. Technically, color is there in the form of wavelengths. So, the concept of color only happens in our minds, after our visual sensory system has responded to those wavelengths. The basis for human vision is the network of light sensors in our eyes. These sensors respond to different wavelengths by sending unique patterns of electrical signals to the brain. In the brain, these signals are processed into the sensation of sight - of light and of color. Our memory system recognizes distinct colors; this system breaks the visible spectrum into its most dominant regions of red, green and blue, and then concentrates on these colors to calculate color information (Figure 2.9) (Konica Minolta, 2003; X-Rite, 2004).
Source: removed from X-Rite (2004)
Figure 2.9.RGB system – Color’s Additive Primaries.
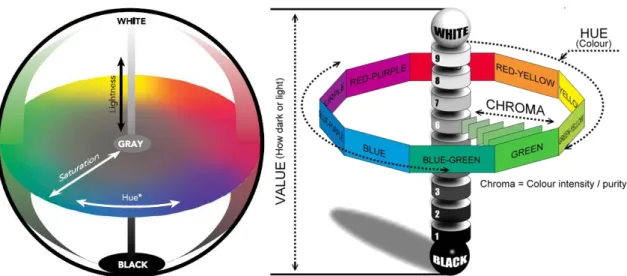
Dimensions of color
When one says ‘measure the color’ what it means is ‘locate the color’ in terms of coordinates in a three-dimensional color solid (Figure 2.10) (Francis, 1995). Color has three attributes - hue (basic color), saturation (vividness or dullness) and lightness (brightness or darkness) - which can be arranged together to create a three-dimensional solid. The wavelength determines the color’s hue; wave purity determines saturation; and wave amplitude (height) determines lightness. Hue, saturation, and lightness demonstrate that visible color is three-dimensional. These attributes provide three coordinates that can be used to “map” visible color in a color space. There are many different types of color spaces and they can be used to describe the range of visible or reproducible colors of a viewer or device. This three-dimensional format is also a very convenient way to compare the relationship between two or more colors (Konica Minolta, 2003; X-Rite, 2004).