A Lean Approach to the Reengineering of an Organization’s
Processes and Design
Filipa Alves Santos
Master’s Dissertation
Supervisor at FEUP: Prof. Américo Lopes Azevedo
Integrated Master’s Degree in Industrial Engineering and Management 2015-07-01
To my mother, father and sister
“It is not necessary to change. Survival is not mandatory.” - W. Edwards Deming (1900-1993)
Resumo
A presente dissertação foi desenvolvida no âmbito da finalização do Mestrado Integrado em Engenharia Industrial e Gestão, pertencente à Faculdade de Engenharia da Universidade do Porto. Este documento foi produzido no decurso de um projeto realizado numa empresa portuguesa cujo negócio se prende com a comercialização de mobiliário e tecnologia associados a espaços laboratoriais. A rápida expansão internacional e diversificação de oferta que a empresa teve nos últimos anos de atividade levaram a um aumento exponencial dos seus problemas operacionais, pelo que se sentiu a necessidade de desenvolver um projeto cujo principal objetivo seria o de identificar e analisar oportunidades de melhoria que pudessem ser implementadas no futuro. Foi adotada uma abordagem lean, que assenta numa filosofia de melhoria contínua.
O trabalho foi realizado num período de cinco meses, que foi organizado em fases e objetivos intermédios. A etapa inicial consistiu em fazer o levantamento dos processos e da estrutura organizacional da empresa, através da consulta dos seus procedimentos, de questões colocadas a vários elementos da empresa, e da observação de uma auditoria ao sistema de gestão de qualidade realizada por uma entidade externa. Uma vez recolhida a informação sobre o funcionamento da empresa, procedeu-se à fase de o representar de uma forma visual, usando-se técnicas de modelação dos processos da cadeia de valor e das dependências hierárquicas. O passo seguinte passou por entender as causas de fundo dos problemas observados na empresa, que tendo sido identificadas serviram de base à última etapa do projeto, que consistiu na formulação de medidas de melhoria.
Verificou-se que as dificuldades sentidas pela empresa se deviam essencialmente à ausência de um método simples e sistemático de resolução dos problemas, a uma estrutura organizacional não adequada às recentes mudanças no negócio da empresa, a um mecanismo ineficaz de transmissão e gestão da informação associada à execução do trabalho, e à inexistência de um modelo de melhoria contínua da empresa. Deste modo, foram modeladas sugestões que abordassem cada um destes aspetos, tendo como base a reformulação do sistema de gestão da qualidade atualmente praticado, e a criação de um mecanismo de gestão visual da informação. Por fim, estas medidas foram classificadas quanto à sua relevância, tempo de implementação, custo associado, esfoço colaborativo necessário, e risco, de forma a se indicar quais as que poderiam ser implementadas mais facilmente num horizonte temporal próximo.
A Lean Approach to the Reengineering of an Organization’s Processes
and Design
Abstract
The present dissertation was developed within the context of the completion of the Integrated Master’s Degree in Industrial Engineering and Management, belonging to the Faculty of Engineering of the University of Porto. This document was produced in the course of a project implemented at a Portuguese company whose core business revolves around the commercialization of furniture and technological solutions for laboratory spaces. The quick international expansion and diversification of offer that the company experienced in the past few years led to the exponential increase of operational problems, which created the necessity of developing a project in which the main objective would be to identify and analyze improvement opportunities that could be implemented in the future. A lean approach was followed, which is based on a continuous improvement philosophy.
The project was executed in a period of five months, which was organized in phases and intermediate goals. The initial stage consisted in understanding the processes and organizational structure of the company, through the consultation of its procedures, the informal interviewing of various employees of the company, and the observation of an audit of its quality management system performed by an external entity. After information was collected about the functioning of the company, the phase of its visual representation began, using techniques for modeling its value chain processes and its hierarchical dependences. The next step involved the finding of the root causes of the problems that were observed in the company, that once identified served as the basis for the last phase of the project, which consisted in the formulation of improvement measures.
It was found that the difficulties felt by the company were essentially due to the absence of a simple and systematic method of resolution of problems, the adoption of an organizational structure that is not adequate to the recent changes in the business of the company, the existence of an ineffective mechanism of transmission and management of information that is associated with the execution of daily work, and the inexistence of a continuous improvement model. Therefore, there were formulated suggestions that addressed each of these aspects, having been based upon the reformulation of the currently practiced quality management system, and the creation of a mechanism of visual management of information. Finally, these measures were classified according its relevance, implementation time, associated cost, required collaborative effort, and risk, so as to indicate which of them could be more easily implemented in a near time horizon.
Acknowledgments
The execution of the project that led to the writing of this dissertation would have never been possible without the support and advice of certain people, to whom I am extremely grateful. In the first place, I would like to thank two key people from the company in which this project was developed, Engr. José Branco and Engr. Rafael Silva, for giving me the opportunity of participating in this project, for making sure I had the best working conditions they could offer, and for kindly granting me a scholarship.
I would like to express my gratitude to Prof. Américo Azevedo and Prof. Eduardo Martins, who were instrumental in the organization and structuring of the dissertation, and whose guidance allowed me to develop new skills and competences, therefore preparing me for the working life. I would like to thank Serafim Araújo, who shared the working experience in this company with me, and who contributed to the development and output of this project as well.
I am grateful to everyone from the company for making me feel at ease and for enabling my integration into the organization. Some of them played an important role in the understanding of the company’s problems and, therefore, in the development of the project, namely Engr. Rafaela Ferreira and Engr. Rafael Couto, whom I want to acknowledge for their cooperation. I express my thankfulness to my family, mainly my parents and my sister, for their unconditional love and support throughout my entire life, without which my personal and academic development would have not been possible.
Last but not least, I would like to acknowledge the love and support of my close friends, who over the years have been filling my life with happy and memorable moments.
vi
Contents
1 Introduction ... 1 1.1 Project Framework ... 1 1.2 Project Goals ... 2 1.3 Research Questions ... 2 1.4 Methodology ... 21.5 Structure of the Dissertation ... 3
2 Theoretical Background ... 4
2.1 The Roots and Main Principles of Lean... 4
2.2 The Emergence of Lean Service ... 6
2.3 Business Process Reengineering and Change Management ... 10
2.4 An Overview of Organizational Design and Structure ... 11
2.4.1 Functional Structure ... 13
2.4.2 Divisional Structure ... 13
2.4.3 Multidivisional Structure ... 13
2.4.4 Matrix Structure ... 13
3 Current State of the Problem ... 14
3.1 Business Analysis ... 14
3.1.1 Business Model Canvas ... 14
3.1.2 SWOT Analysis ... 15
3.1.3 Evolution of Turnover and Workforce ... 15
3.2 Business Process Modeling ... 17
3.2.1 First-level Analysis ... 17
3.2.2 Second-level Analysis ... 19
3.3 Organizational Design Analysis ... 22
3.4 Root Causes of Problems ... 24
4 Identification and Analysis of Improvement Opportunities ... 28
4.1 Organizational Design ... 28
4.1.1 A More Adequate Organizational Structure ... 28
4.1.2 A More Visual Office Layout ... 31
4.2 Quality Management System ... 34
4.2.1 A More Effective Problem Solving Method ... 34
4.2.2 A New Approach to Process Management ... 36
4.3 Other Considerations ... 39
4.3.1 A Better Control of Demand and Stocks ... 40
4.3.2 A More Adequate Approach to the Technological Support ... 41
4.4 Cost-Benefit Analysis ... 42
5 Conclusions and Future Work Recommendations ... 43
References ... 46
ANNEX A: Business Model Canvas ... 48
ANNEX B: SWOT ANALYS ... 49
ANNEX C: As-Is Business Processes Map ... 50
ANNEX E: As-Is Responsibility Matrix – Process 2.0 Receive and Validate Project
Proposal ... 52
ANNEX F: As-Is Responsibility Matrix – Process 3.0 Prepare and Plan Work ... 53
ANNEX G: As-Is Responsibility Matrix – Process 4.0 Execute and Control Work ... 54
ANNEX H: As-Is Responsibility Matrix – Process 5.0 Dispatch and Install Project .. 55
ANNEX I: As-Is VSM – Process 1.0 Elaborate Proposal ... 56
ANNEX J: As-Is VSM – Processes 2.0 to 5.0 (Standard Projects) ... 57
ANNEX K: As-Is VSM – Processes 2.0 to 5.0 (Special Projects without Prototypes) 58 ANNEX L: As-Is VSM – Processes 2.0 to 5.0 (Special Projects with Simple Prototypes) ... 59
ANNEX M: As-Is VSM – Processes 2.0 to 5.0 (Special Projects with Complex Prototypes) ... 60
ANNEX N: Suggestion - Functional Structure ... 61
ANNEX O: Suggestion - Divisional Structure ... 62
ANNEX P: Suggestion - Matrix Structure ... 63
ANNEX Q: As-Is Office Layout ... 64
ANNEX R: To-Be Office Layout ... 65
ANNEX S: To-Be Office Layout – Obeya Room ... 66
ANNEX T: Obeya Room – Template of Macro Plan Poster ... 67
ANNEX U: Obeya Room – Template of Weekly Plan Poster ... 68
ANNEX V: Obeya Room – Template of Project Status Poster ... 69
ANNEX W: Obeya Room – Template of Problem Solving Poster ... 70
ANNEX X: Obeya Room – Template of Problem Registry ... 71
ANNEX Y: Obeya Room – Legend of Problem Registry ... 72
ANNEX Z: To-Be Business Processes Map ... 73
ANNEX AA: To-Be Responsibility Matrix – Process 1.0 Elaborate Proposal... 74
ANNEX AB: To-Be Responsibility Matrix – Process 2.0 Prepare and Plan Work ... 75
ANNEX AC: To-Be Responsibility Matrix – Process 3.0 Execute and Control Work 76 ANNEX AD – KPI for the Work Group Level ... 77
ANNEX AE – KPI for the Management Level ... 78
viii
Abbreviations
BMC – Business Model Canvas
BPR – Business Process Reengineering CT – Cycle Time
ERP – Enterprise Resource Planning IT - Information Technology
JIT – Just-in-Time
JPF – Jefferson Pilot Financial KPI – Key Performance Indicator LEI – Lean Enterprise Institute
LDMS – Lean Daily Management System LT – Lead Time
MRP - Material Requirement Planning PDCA – Plan, Do, Check, and Act PDM – Product Data Management PR – Problem Registry
R&D – Research and Development
R&D&I – Research, Development, and Investigation
SWOT – Strengths, Weaknesses, Opportunities, and Threats TPS – Toyota Production System
TT – Total Time
VAT – Value Added Time VSM – Value Stream Map 5W – Five «Ws»
List of Figures
Figure 1 – The Toyota Production System House (LEI, 2005b) ... 5
Figure 2 – Four Leadership Parameters (Lareau, 2003) ... 8
Figure 3 – Types of Surface Waste (Lareau, 2003) ... 9
Figure 4 – Vertical and Horizontal Differentiation (Jones, 2002) ... 12
Figure 5 – Current Functional Dependencies ... 23
Figure 6 – Suggestion: Multidivisional Structure ... 30
Figure 7 – Amount of Information versus Confusion (Kaizen Institute, 2015) ... 32
x
List of Tables
Table 1 – VSM Parameters by Type of Project ... 21 Table 2 – Advantages and Disadvantages of Different Organizational Structures ... 31
List of Graphics
Graphic 1 – Evolution of Revenue per Market ... 15
Graphic 2 – Evolution of Workforce ... 16
Graphic 3 – Evolution of Revenue per Business Unit ... 16
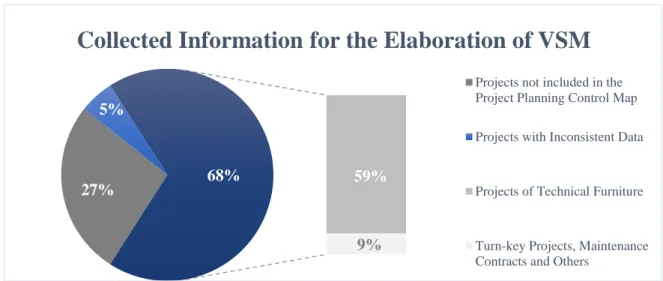
Graphic 4 – Collected Information for the Elaboration of VSM ... 21
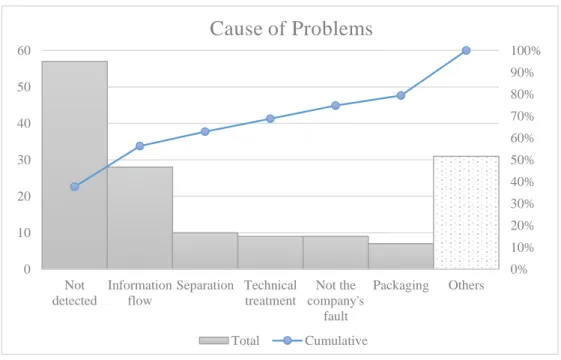
Graphic 5 – Pareto Chart of the Reported Problems ... 25
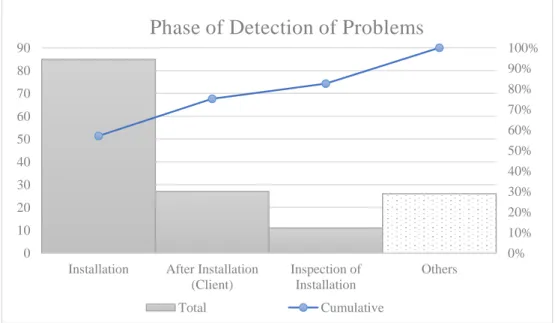
Graphic 6 – Pareto Chart of the Phases of Detection of Reported Problems ... 25
1 Introduction
This initial section of the dissertation aims to provide an insight into the context in which the project was developed, its objectives and the methods employed during its course.
In the first place, the circumstances that led to the need for a solution are explained, enabling the definition of the research questions and the project goals. The method explains how the problem was approached, i.e., the way that work was planned and organized. Finally, the structure of this document is briefly presented.
1.1 Project Framework
The project was developed in a Portuguese company whose core business concerns the commercialization and installation of technical furniture for laboratories1. Founded in 1998, the company began its activity as a national representative of a large furniture firm, having decided to venture into its own business a few years later. It created its own lines of products and expanded its activity to the development of turn-key projects and cutting-edge technology for intelligent laboratories.
Over the years, the company has gained a significant volume of exports, which led to the establishment of subsidiaries in Angola, Morocco, Switzerland, Mozambique and Cape Verde. Nowadays, its international turnover surpasses the national one. This company is considered to be orientated to services rather than to manufacturing, due to buying and subcontracting most of the material.
Alongside its growing international business, the company has been increasing the dimension of its portfolio of products, by means of offering a wide range of standard and customized solutions. While such flexibility translated into a strong competitive advantage, it also required a big internal effort in order to keep up with the growing complexity and customization of customers’ requests. In the past few years, the number of employees has increased significantly, a situation that further complicated the internal coordination.
Taking into consideration these three factors - expansion into international markets, diversification of portfolio and increasing workforce – and the fact that these changes occurred in a short period of time (more or less five years), the company has been experiencing a higher number of errors and problems. Facing these new challenges, it has realized the need to rethink the way its business processes are conducted, and whether it should change its organizational structure, in order to adapt itself to this changing reality.
These circumstances led to the formulation a project in which principles from the lean management philosophy would be applied for the benefit of the company. Using this improvement methodology, the project would comprise three phases: the characterization of the company’s business, processes and organizational design; the identification of the root causes of the problems it has been experiencing; and the formulation and analysis of improvement opportunities.
1 LABORIAL – Laboratory Solutions, S.A.
1.2 Project Goals
Having characterized the general framework of the project, the definition of the goals of its execution constitutes the next critical step. These objectives have not only to be relevant to the necessities of the company, but also to be adequate to the time horizon of the writing of the dissertation, which is about five months.
This project aims to accomplish the following goals:
Explain how the historical evolution of the company and its strategic choices conditioned their operational performance;
Characterize, using lean tools, the current business processes and the way that tasks are assigned to employees involved in them;
Identify and explain the root causes of the problems the company has been facing in recent years;
Propose a «to-be» model of the organization that addresses the identified root causes of the problems;
This dissertation is structured in a way that enables each of the mentioned goals to be clearly addressed.
1.3 Research Questions
The definition of research questions is critical for the organization of the work required to execute the project. These questions are formulated in a way that ensures that the different phases of the project are in line with the stated objectives.
This dissertation was written with the aim of being able to answer the following questions: What types of problems are affecting the company?
Which root cause(s) is/are at the source of the problems?
What is/are the bottleneck(s) that is/are conditioning the operational performance of the company?
Which current aspects could be improved? How could the reforms be implemented?
The following section of this first chapter explains how work was planned and organized so that the research questions could be answered.
1.4 Methodology
The project framework implies the understanding of the functioning of the whole company when it comes to its processes, hierarchical dependencies, strategic choices and evolution over the years. The identification of the critical areas and opportunities for improvement requires both a thorough observation of the daily activities of the company and the representation of such activities in abstract thinking models, so that they can be analyzed through unbiased and clear lenses.
Therefore, both empirical and deductive methods were used in this project. The first one was put into practice by informally interviewing and interacting with employees of the company
meaning «the real place» in Japanese), in which the shop-floor and offices were visited and subject to observation. These two methods enabled the obtainment of qualitative data in form of written descriptions of the relevant facts observed. Another empirical method was used in order to collect data that would validate the qualitative observations. It consisted in data analysis that were run in the company’s Enterprise Resource Planning (ERP) software with the aim of quantifying the workload of the key operational activities, the time required to perform them, and the frequency of the occurrence of operational problems.
The deductive methods used in the investigation consisted in the application of tools from two philosophies: lean management and business process reengineering, which are discussed in the second chapter of this dissertation. Such tools are detailed in chapters three and four.
Before structuring the project schedule it was necessary to define its focus, taking into account the three business units of the company: technical furniture, turn-key projects and intelligent laboratories. Following Pareto’s Principle of the majority of outputs being caused by few critical factors, it was verified that the reported problems were largely related to the technical furniture business unit, the company’s original business and the one that requires a bigger operational effort. Therefore, the project focused on the technical furniture business unit. In the beginning of the project, the three main phases of its execution were outlined: finding the facts, discovering the causes and formulating measures. The first one consisted in characterizing the current state of the company through the prisms of its processes, organizational structure, task delegation, communication mechanisms, quality system, and technological support. In the second stage of the project, the root causes of the problems identified in the previous stage were discovered and explained. Finally, improvement suggestions were enunciated and analyzed in terms of the benefits and difficulties of its implementation.
1.5 Structure of the Dissertation
This dissertation is structured according to the phases of the project based on which it was written.
After this introductory section comes a chapter dedicated to the review of the state of the art of themes related to this project: the main principles and tools of the lean philosophy (both in manufacturing and services businesses), the concept of process reengineering work, the foundations of change management, and the different conceptions of organizational structure. The third chapter comprises the first and second phases of the project and is structured in four sections: an analysis of the company’s business and overall performance over the years; a general and a detailed modeling of its processes and task assignments; a critical look at its organogram; and the identification of the root causes of its problems.
The fourth chapter reflects the final stage of the project, i.e., the suggestion of improvement actions concerning the following change dimensions: organizational redesign, creation of a visual management, reengineering of core processes, and reformulation of the quality system. These are complemented with additional considerations and a brief analysis of the pros and cons of its implementation.
Finally, chapter five refers the conclusions of the project and future work recommendations, which expose the implications of the continuity of this project.
2 Theoretical Background
This chapter presents an overview of the state of the art of the relevant topics of the dissertation, which can be translated into the following keywords and concepts: lean management, business process reengineering, organizational design, and change management.
To conduct this kind of research, a variety of sources was consulted, including books, articles, webpages, and dissertations. The results of the investigation were divided into four sections according to the different themes in which the dissertation is based upon.
The first subchapter introduces the historical background of the lean management philosophy and its core principles. In the second subchapter, it is explained how the lean concept in manufacturing industries and services companies may differ, which is an important question taking into consideration that the company being analyzed is services-oriented, and that lean management is usually associated with manufacturing industries. The third section explains the concept of business processes reengineering, which is related to the one of organizational change, and the final one mentions the varied conceptions of organizational structure.
2.1 The Roots and Main Principles of Lean
The concept of lean management is widely used in today’s business panorama. It often appears in different contexts and situations, which may lead to confusion about its meaning and scope. Therefore, it is important to explain how it was originated and its main principles.
The term «lean» was created in the 1980s by a research team in the United States of America. It is a concept that derives from the Toyota Production System (TPS), developed in the years after the Second World War at Toyota Motor Company, today’s largest car manufacturer in the world. The key figures behind TPS were Kiichiro Toyoda, the founder of the company, and Taiichi Ohno, an engineer who worked there. At the time, the most advanced production system was the one developed by Henry Ford, who is considered the father of mass production (Lean Enterprise Institute [LEI], 2015a). Ford was able to increase the flow of products by implementing the first moving assembling line on the shop floor, but he could not diversify the range of products. Ohno managed to overcome this problem by applying the concept of demand driven production, “(…) right-sizing machines for the actual volume needed, introducing self-monitoring machines to ensure quality, lining the machines up in process sequence, pioneering quick setups so each machine could make small volumes of many part numbers, and having each process step notify the previous step of its current needs for materials (…)” (LEI, 2015a). This production system reduced the lead time of products, i.e., the time it takes to process them, and increased product variety. Ohno published the book The Toyota Production System in 1978, but it was only with the publication of The Machine That Changed the World (1990) by James P. Womack, Daniel T. Jones and Daniel Roos, that the western world gained consciousness of this emergent management mindset.
In lean literature, the book The Toyota Way (2004) by Jeffrey K. Liker indicated the principles behind TPS. According to Lean Blitz Consulting (2015), the principles described in this book are based upon the concepts of continuous process flow, visual management, first-time quality, empowerment of employees, and continuous improvement. This new approach to management was very different from the previous ones, because it focused on the flow of the entire productive process instead of trying to improve the performance of each machine, step or department individually. The work became demand driven, and the main goal was to create
value for the costumer, thereby improving production quality and eliminating everything that did not add value to the customer, i.e. waste.
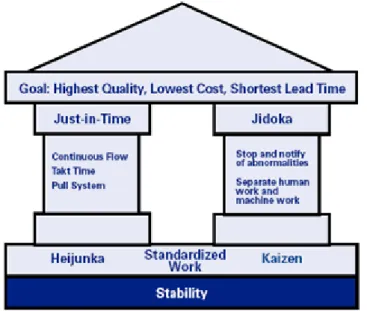
Figure 1 is a representation of the TPS House, a visual depiction of the core values and objectives of this management philosophy. The goals of high quality, low cost and short lead times are achieved through the implementation of Just-in-Time (JIT), Jidoka (which means «autonomation»), Heijunka («production leveling»), standardized work, and Kaizen, which can be translated to «change for better».
Figure 1- The Toyota Production System House (LEI, 2015b)
While Lean is focused on cutting waste, Kaizen is more of a continuous improvement philosophy, therefore acting as a basis upon which lean tools are implemented, such as JIT and
Jidoka (Walters, 2013). The first one is a production mechanism contrary to mass production,
because it limits production to the exact quantity that the customer needs, preventing unnecessary stocks and requiring that resources are able to react quickly to demand shifts. The latter consists in an automatic quality control mechanism that interrupts the process flow each time an error is detected, in order to immediately act upon it and identify its route cause, thereby preventing that the same mistake happens in the future.
The lean methodology consists in “(…) improving the flow of activities and reducing the cost of a process by reducing several forms of waste” (Harmon 2007, 342). According to the traditional view of lean, which is focused on manufacturing, there are seven types of waste, which are described as follows:
Overproduction – when it is produced more output than what is needed by the downstream process;
Waiting – when an upstream process takes more time than usual to deliver inputs to the following process;
Transport – when materials are unnecessarily moved from one place to another;
Extra Processing – when extra work is applied to products, without it being requested by the customer;
Inventory – when raw materials or finished goods are stored and not used to satisfy the customer’s request;
Motion – when employees have to move excessively when accessing the tools they need to perform their work ;
Defects – when products are damaged and need to be reworked or replaced (Harmon 2007, 345-346).
2.2 The Emergence of Lean Service
The previously mentioned types of waste are more common in manufacturing companies. Over the years, there has been a growing interest in trying to understand how lean can be adapted to service companies, despite the common belief that it is only applicable in manufacturing settings. According to LEI (2015c), lean “(…) applies in every business and every process (…)”, because it (…) is not a tactic or a cost reduction program, but a way of thinking and acting for an entire organization”. Therefore, authors and managers have written a variety of articles and books about the services perspective on lean thinking.
According to Swank (2003), lean manufacturing principles can be applied to service companies, as it was the case of Jefferson Pilot Financial (JPF), a full-service life insurance and annuities company from the United States of America that, at the end of the 1990s, was struggling to keep up with a competitive market and higher costumer expectations. This company realized that it could become more competitive if it improved the performance of its operations, by reducing lead times and the percentage of rework. JPF noticed that its product – insurance policies – underwent a series of processes in a continuous flow that greatly resembled the one of physical products in assembly lines. Therefore, the company investigated the case of manufacturing companies that managed to improve its performance by applying the lean manufacturing principles of Japanese companies after the Second World War. The first step in the lean program was to build a model cell, a physical space in which the entire operational process was represented and performed, so that it could be monitored and improved. In this model cell, seven lean manufacturing principles were tested:
Consecutive processes are placed next to each other – this principle reflects the notion that improving operations requires improving the flow of the processes, not the performance of each function or department;
Work procedures are standardized – by standardizing work procedures, it is easier to exchange tasks between employees and to evaluate their performance;
Loop-backs are eliminated – delays occur when products return to a previous resource to be processed, and an extra effort is required to manage time and tasks within the overused resource;
Work is adjusted to the demand rate – by determining the rate of demand it is possible to condition the rhythm of work so that downstream processes are not waiting for the output of the upstream ones;
Work is distributed equally by resources – tasks are delegated in a way that no resource is more occupied than any other at any time, thus reducing waiting times between processes;
Work is divided according to complexity – if certain tasks require different levels of complexity and distinct procedures, it is better to separate them so that resources are used to their maximum potential;
Visual management is applied in performance monitoring – when information about outputs and performance metrics are displayed in a clear way for all employees to see, there is a better notion of the progress of work, and workers are encouraged to improve their performance.
By applying these lean manufacturing principles, JPF was able to reduce the lead times of its operations and the percentage of errors and rework, therefore cutting costs and increasing revenues. Another important lesson can be taken from this example, concerning the way that performance metrics were defined. Instead of focusing on departmental or functional performance, they reflected the customers’ point of view, therefore motivating employees to improve the output of the entire process and not just of what is directly related to their tasks. It is worth mentioning another lean service related article, which introduced and described the idea behind Lean Consumption, stating that it “(…) isn’t about reducing the amount costumers buy or the business they bring. Rather, it’s about providing the full value that consumers desire from their goods and services, with the greatest efficiency and least pain.” (Womack and Jones 2005). This concept implies that in order to optimize service operations, the point of view of the customer has to be adopted. The authors outlined the principles supporting Lean Consumption, which were further detailed in their subsequent book “Lean Thinking”, published in late 2005. They were defined as follows:
The customer’s problem has to be completely solved – this implies that help services need to be able to identify patterns in customers problems, thus acting on its root causes rather than providing quick fixes;
The customer’s time has to be reduced – by mapping the steps the customer has to take when being attended, it is possible to think how the process can be remodeled in order to reduce the amount of time in which value is not being added to the customer;
Offer exactly what the customer wants – this idea goes hand in hand with the one of demand driven production supported by lean thinking, i.e., the pull replenish method in which the customer is provided with only what is needed;
Offer exactly what the customer wants where it is wanted – this means that there are appropriate channels of distribution for certain services or products;
Offer exactly what the customer wants where and when it is wanted – this idea takes into account that customers may not want to decide every detail of their order in the beginning of the purchasing process;
Incorporate integrated solutions to customers’ problems – instead of focusing on one side of the problem, service provides should try to cover every aspect of it, thereby completely satisfying the customer.
The implementation of the lean philosophy in service companies has proved to be successful, although it has also been misused in some cases. In an attempt to apply lean manufacturing to services, some managers have treated internal processes as production steps in an assembly line logic, only to find out that they were not improving. This happened because in order to “(…) make the fundamental change that moving from the present style of management to managing the organization as a system requires managers first to understand their problems” (Seddon et
al, 2009). This means that before choosing the lean tools to be implemented, managers need to
understand the root causes and nature of the problems they are facing, because each service company operates in a specific context under distinct conditions. Therefore, there should be
given more attention to lean management than to its tools. Service companies may be better understood if there is a distinction between value demand and failure demand, the first being related to every customer demand that justifies the purpose of the company, and the latter referring to requests made by customers whose initial requests were not fully or correctly satisfied. Failure demand consists in a very big form of waste for service companies, which is the result of them being treated as manufacturing cells by managers. The two main causes of failure demand are functional specialization and standardization, which leads to a company being unable to lead with variety in demand, a common characteristic in services. Instead of aiming to cut costs by standardizing procedures, managers should try to create value for the company by training employees to deal with volatility in customers’ demand (Seddon et al, 2009).
Failure demand represents just one aspect of waste in service companies. Very often, waste in office environments is not obvious, neither is its impact on profitability. “The waste is the cost of lost business, damage control efforts, lost opportunities that could not be pursued because of the problem, and the diversion of management attention from the critical tasks of planning, leading, and relating to customers” (Lareau 2003, 20). According to this author, waste in office environments occurs even in successful companies, and it is a threat to competitive advantage. Two big groups of waste are identified: surface and leadership waste.
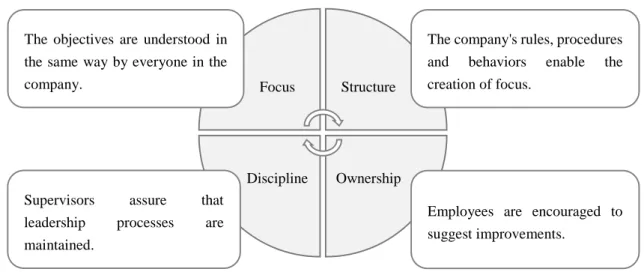
Figure 2 introduces the four parameters supporting leadership in a company: focus, structure, discipline and ownership.
Figure 2 – Four Leadership Parameters (Lareau, 2003)
In order to have a successful leadership in a company, it is necessary to eliminate waste coming from lack of focus, poor structure, and insufficient discipline and ownership. These types of waste usually occur in the following situations:
There is a lack of focus – the vision and goals of managers are not well communicated to the different levels of the company, leading to confusion in different work groups of the company about how the objectives can be achieved;
The structure is weak – the processes and way of working of employees are not well defined and standardized across the different departments and divisions of the company, making it difficult to attain the objectives outlined by the focus;
There is not enough discipline – leaders are not providing regular feedback about the performance of daily activities, there is not a quick and effective reaction by supervisors
Focus Structure
Ownership Discipline
The objectives are understood in the same way by everyone in the company.
The company's rules, procedures and behaviors enable the creation of focus.
Supervisors assure that leadership processes are maintained.
Employees are encouraged to suggest improvements.
whenever employees make mistakes, support and training are not provided to workers when it is necessary;
There is not a sense of ownership – employees are not encouraged to suggest improvements or to solve internal problems by themselves, leading to excessive control by supervisors and demotivation of workers.
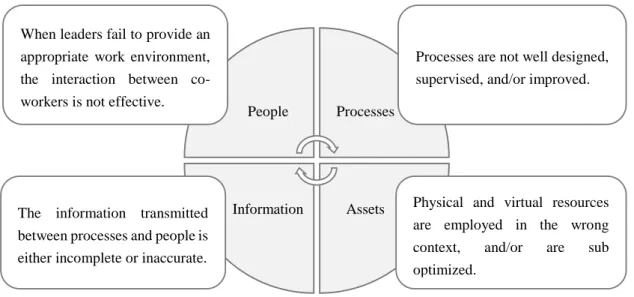
Once leadership waste has been tackled, it is possible to remove surface waste, consisting in “(…) resources consumed by activities that do not add value to a product or service (…) from the perspective of the customer” (Lareau 2003, 21). These types of waste are related to four dimensions: people, processes, information, and assets.
Figure 3 provides a brief explanation of what characterizes each type of surface waste, which are described by Lareau (2003) as «silent killers», i.e., waste that may go unnoticed in a company and cause a great damage to its competitive advantage.
Figure 3 – Types of Surface Waste (Lareau, 2003)
Surface waste comes in the form of people, processes, information and assets, which happen when the following circumstances take place:
Interaction between co-workers leads to waste – this may occur when employees have to wait too long for a piece of information or the completion of a previous activity in order to start working, when work is not well performed due to lack of training, or when workers are assigned to irrelevant and/or unnecessary tasks;
Processes are not well designed, which leads to non-optimal performance –excessive supervision of work, trying to change a process without thinking of all possible consequences, excessive focus on short-term needs, non-standardization of working procedures, or the use of informal work methods instead of the official ones;
Information flow is not clear – when information is processed in different ways while being transmitted between employees and departments, when there are missing or wrong details in the information, or when it is manipulated in order to project a favorable image of one’s performance;
Assets are not used in an optimal way – resources employed in operational bottlenecks create more work-in-process, fixed assets that are not used to their maximum capacity may require an unnecessary investment in additional space.
People Processes
Assets Information
When leaders fail to provide an appropriate work environment, the interaction between co-workers is not effective.
Processes are not well designed, supervised, and/or improved.
The information transmitted between processes and people is either incomplete or inaccurate.
Physical and virtual resources are employed in the wrong context, and/or are sub optimized.
By tackling both leadership and surface waste, companies are able to respond to changing markets and growing competition.
2.3 Business Process Reengineering and Change Management
Business Process Reengineering (BPR) is a management strategy that originated in the 1990s. It is generally considered that the creator of such strategy is Michael Hammer, who in 1990 published the revolutionary article “Reengineering Work: Don’t Automate, Obliterate” in Harvard Business Review. In this article, Hammer described BPR as a work that “(…) strives to break away from the old rules about how we organize and conduct business” (Hammer, 1990). Therefore, a company needs to rethink its traditional structure and mechanisms if it wants to implement BPR. Such radical changes are necessary in order to shift the focus on cost and control to quality and innovation, so that companies are able to adapt themselves to increasingly competitive markets (Hammer, 1990).
BPR requires a cross-functional view of business, an understanding of how a company creates value to its customers. By modeling the current state of its processes - the «as-is» process diagram – it is possible to have a clear view of how product or service flows through the processes, enabling the detection of opportunities for improvement, which are represented in the «to-be» process diagram (Harmon 2007, 248).
This cross-functional view of business consists in one of the main principles defended by Hammer (1990), who advocates the integration of tasks rather than specialization, therefore making people less focused on their individual work, and more aware of the outputs of the entire process. Other core idea behind BPR concerns the incorporation of control mechanisms into the process itself, so that workers doing their job are also responsible for monitoring its quality, rather than having other employees supervising their work (Hammer, 1990). Finally, it is recommended the use of coordination mechanisms while dealing with parallel activities and geographically dispersed resources, and the standardization of communication channels. (Hammer, 1990).
BPR needs to be applied very carefully due to its radical nature. According to Bergey et al (1999), there are common mistakes that companies make while trying to transition from a legacy system (the current mechanisms and rules applied by the organization) to the target system:
The wrong problem is addressed;
Not all steps of the reengineering process are performed;
Consultants and/or contractors are hired without a clear definition of their roles within the company;
The worked force does not receive the necessary training in order to be able to perform new tasks;
There is little or no documentation about the legacy system that may help decision making, such as information about historical evolution and indicators of the required time, capacity, and money to make certain changes;
The requirements of the target system are not well defined and/or validated by key stakeholders of the company;
The reengineering plan does not have clear goals and milestones, and responsibility is not well defined;
There is a lack of long-term commitment by managers supervising the reengineering effort;
Managers define the reengineering project rollout without consulting the project team members, and/or base their decisions in hunches.
BPR is one of the ways through which change can be implemented in an organization. This type of effort takes time and has to be thoroughly structured, monitored and understood by everyone involved in it. To implement it successfully is a big challenge. According to Kotter (2007), there are eight steps in a change program within a company which have to be followed in the correct order, and avoiding common mistakes in each one of them. They are described as follows:
People in the company need to understand why it is urgent to change the status quo, and should avoid resistance based on fear of risk taking;
There should be formed a change project team that clearly understands the plan, whose members interact well together and whose leadership is delegated to an operational manager, due to having a clear notion of the problems the company is facing;
There has to be created a vision for the change project, one that is easy to communicate and to be understood;
The vision has to be communicated through every possible channel, and the project team should be the reflection of that vision through its actions, words and behaviors;
After communicating the vision, the project team has to assure that all obstacles to change are removed, and that innovative ideas are encouraged;
There should be planned short-term wins in less than a year, in order to compensate people for their effort and to show them that change is possible;
Once short-term goals have been achieved, it is important to identify new opportunities for improvement, hire and/or develop people to implement the change vision, and not to declare victory too soon by abandoning the change program;
In the long term, once changes have proven to be successful, managers have to institutionalize new values and practices that translate the vision, and assure the continuity of leadership.
2.4 An Overview of Organizational Design and Structure
The concept of organizational design is not an obvious one, for it may be confused with other terms that are related to the way that companies distribute tasks between employees and organize internal work. According to Jones (2002, 10), organizational design is “(…) the process by which managers select and manage aspects of structure and culture so that an organization can control the activities necessary to achieve its goals”. Therefore, it is through organizational design that companies model its structure and disseminate values through employees, which in the long-term leads to the formation of patterns of behaviors within the organization.
Structure reflects the way that roles and responsibilities are attributed to employees, how workers are grouped in teams and departments and the authority relationships between them.
Culture translates into the ethics, values and norms of an organization, i.e., the way employees deal with internal and external situations.
Organizational design is not an easy and clear-cut process, as it requires the analysis of the company’s profile and the external environment in which it operates. Choosing a certain type of structure usually requires a trade-off between competitive advantages. These trade-offs appear in the form of challenges the company faces while trying to balance its levels of differentiation versus integration, centralization against decentralization, and standardization versus mutual adjustment (Jones, 2002).
Differentiation reflects the division of labor within a company, the degree to which its workers are specialized in distinct departments and functions. It can happen in both vertical and horizontal dimensions, the first referring to the creation of hierarchical levels and authority relationships between them, and the latter consisting in the definition of roles and functions, such as the formation of teams and departments. While increasing specialization enables the development of competitive skills, it may also lead to communication problems between workers and departments. According to Jones (2002, 104), different types of mechanisms may be employed to reinforce integration within a company. They are described as follows:
Hierarchy of authority – this consists in the traditional mechanism of vertical differentiation;
Direct contact – this happens when people meet face-to-face to discuss issues;
Liaison roles – in each department a worker is given the role of coordinating interaction between his/her department and the others;
Team or task force – managers get together in regular or temporary committees (respectively) in order to debate cross-functional issues;
Integrating role or department – a role or department (respectively) is specifically created with the purpose of coordinating communication between managers of different divisions/departments.
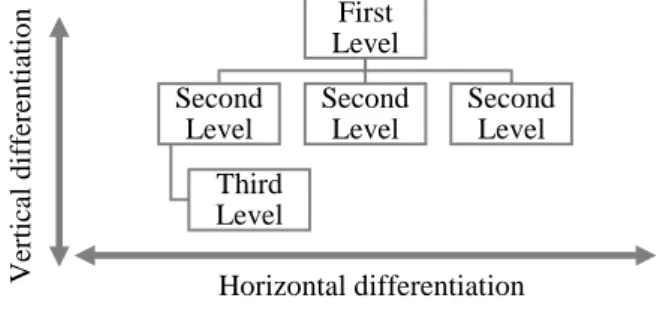
Figure 4 demonstrates how vertical and horizontal differentiation are reflected in an organizational chart. Vertical differentiation occurs with the creation of hierarchical levels, in which the second level reports to the first, the third to the second, and so on. Horizontal differentiation happens when new functions are created at the same level, increasing work specialization.
Figure 4 – Vertical and Horizontal Differentiation (Jones, 2002)
Another important concept related to organizational design is that of span of control. It refers to the number of employees that a superior manages directly, which depends on the complexity and interrelatedness of the tasks they perform. When work is complex and workers are highly dependent on each other, it is difficult for a superior manager to supervise their work. The web of interaction is too wide for just one supervisor, and loss of control of employees is a natural consequence (Jones 2002, 138-139). Ver tical d if fer en tiatio n First Level Second Level Third Level Second Level Second Level Horizontal differentiation
The balance between differentiation and integration, centralization and decentralization, standardization and mutual adjustment, and the definition of the span of control lead to various possibilities of organizational structure.
There are four major types of organizational structure, each functioning in a distinct way and presenting potential advantages and disadvantages once implemented in a company. Four types of structure are further explained: functional, divisional, multidivisional, and matrix.
2.4.1 Functional Structure
In a functional structure, employees using the same resources or doing the same type of tasks are grouped (e.g.: Manufacturing, R&D and Finances are distinct functions).
It has the advantage of helping to increase specialization, technical skills and know-how, but it may lead to coordination and communication problems between functions (Jones 2002, 160-164).
2.4.2 Divisional Structure
In a divisional structure, divisions are created in order to answer to specific requirements of products (goods or services) offered by a company, locations where it is present, or groups of customers it serves. There is also a centralized set of support functions (e.g.: finances) that provides support to all divisions. Managers operating in divisions are at the divisional level of management, and those at support functions belong to corporate management. Divisional managers are subordinates of corporate managers.
This kind of structure has the advantage of helping to develop specialization in a way that a company is better prepared to deal with specific requirements in its business. However, it is only adequate to a company operating in one business (Jones 2002, 167-169).
2.4.3 Multidivisional Structure
In this structure, there are divisions and corporate head staff like in the divisional structure, with the difference that each division has its own set of support functions. Managers in these support functions are at the function level of management. Therefore, in multidivisional companies there are three levels of management: corporate, divisional and functional, in which functional managers report to divisional ones, who in their turn are subordinated to corporate-level managers.
Unlike divisional structures, this one is adequate to a company operating in different businesses. It increases both differentiation and integration, because it is possible for each division to have its own functional structure while at the same time being coordinated by a central corporate management. Therefore, there is the disadvantage of arising conflicts between corporate and divisional managers, and of poor communication between divisions (Jones 2002, 170-176).
2.4.4 Matrix Structure
The company’s structure has a vertical dimension and a horizontal one. Vertically, there are functional roles (e.g.: purchasing), and horizontally there are business teams (e.g.: product division). This means that each worker has to report to two supervisors: the functional manager, and the team manager.
This cross-functional approach helps to reduce functional barriers, and facilitates the internal rotation of employees between roles, which leads to greater flexibility. On the other hand, the existence of two bosses per employee may lead to confusion about who exerts more authority, therefore compromising the decision-taking process (Jones 2002, 183-186).
3 Current State of the Problem
In this chapter, the current situation of the company is analyzed through four dimensions: the performance of its business, the functioning of its business processes, its organizational structure, and the systematic causes of the problems it has been facing. Each dimension is characterized and analyzed in different sections of this chapter. The facts of the current situation are the basis for the formulation of the proposed changes for the company.
3.1 Business Analysis
Two tools are used to qualitatively characterize the business of the company: a Business Model Canvas (BMC) and an analysis of its strengths, weaknesses, opportunities and threats (SWOT). It is made as well a quantitative analysis in terms of the evolution of the revenue of the company and its level of internationalization.
3.1.1 Business Model Canvas
A BMC is a powerful tool used when trying to characterize a startup business or an already existing one. It is a strategic method of characterization because it helps managers to decide how to conduct their business and how to form a strong network of alliances. These strategic decisions are reflected in nine building blocks, which should be defined in the following logical order:
Customer Segments – the types of customers the company wants to serve, and whether their needs are distinct from each other;
Value Propositions – what the company is willing to offer to each segment of customers in order to satisfy the identified needs;
Channels – which channels the company employs in order to deliver its value propositions to customers;
Customer Relationships – how the company keeps customers satisfied and loyal over time;
Revenue Streams – how the company generates revenue by offering its value propositions;
Key Resources – which assets and infrastructures are crucial to deliver the value propositions;
Key Activities – which activities does the company need to excel at in order to deliver the value propositions;
Key Partnerships – the web of strategic partners that a company must develop so as to be able to outsource resources and competences that are out of its core business; Cost Structure – the kind of costs that are intrinsically associated with the performance
of the key activities (Business Model Generation, 2015).
A BMC was developed to explain the business model of the company. It can be consulted in Annex A. The most important aspects represented in the BMC are synthesized in the following ideas:
There are three business units in the company: technical furniture (its core), turn-key projects and intelligent laboratories, each offering a distinct value proposition;
The three value propositions serve the same type of customer (industrial companies in the laboratory and health clusters), each with different needs;
The order winners that keep customers loyal to the company are the flexibility in the product offering, the quick response to requests, and the lower prices compared to those practiced by competitors;
Customers are reached through commercial managers in headquarters and subsidiaries; The activities intrinsically associated with the company’s businesses are sales management, budgeting, outsourcing, and technological development in the case of intelligent laboratories;
These key activities require key resources like a deep knowledge of market characteristics and tendencies, and technological know-how;
These resources are developed with the help of strategic partners like suppliers and educational institutions;
The majority of costs supported by this mainly-services company are related to the outsourcing of material, equipment, and engineering/technical services;
The revenue streams come mainly from commissioned projects from international markets.
3.1.2 SWOT Analysis
A SWOT analysis is tool used for the assessment of a company’s current situation. It characterizes both the internal and external environments in which a company operates, by highlighting the strengths and weaknesses inherent to its activity, and the opportunities and threats that the surrounding context presents.
Annex B contains a SWOT analysis of the company that is being analyzed.
3.1.3 Evolution of Turnover and Workforce
Since its foundation in 1998, the company has significantly changed the level of customization and variability of the solutions it offers to its customers. Alongside this portfolio expansion, the company has been increasing its revenue streams from international markets and has quadrupled its number of employees in a ten year time horizon.
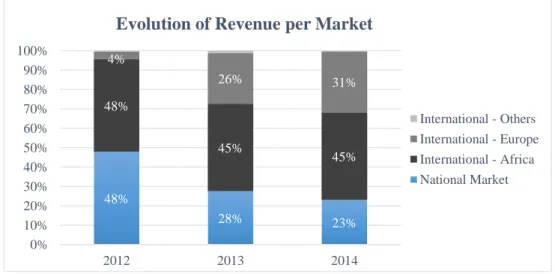
Graphic 1 is an overview of the company evolution in the past few years (from 2012 to 2014), in terms of national and international revenue.
Graphic 1 – Evolution of Revenue per Market
It is evident from this graphic that the company has reshaped its range of customers in the past few years. Once strictly oriented to the national market (from 1998 to 2009), it is now covering five continents: Europe, North America, South America, Asia, and mainly Africa. It has
48% 28% 23% 48% 45% 45% 4% 26% 31% 0% 10% 20% 30% 40% 50% 60% 70% 80% 90% 100% 2012 2013 2014
Evolution of Revenue per Market
International - Others International - Europe International - Africa National Market
established subsidiaries in Angola (2010), Morocco (2012), Switzerland, Mozambique, and Cape Verde (all of them in 2013). These subsidiaries consist in teams of commercial managers, which means that all operations remain centralized in Portugal.
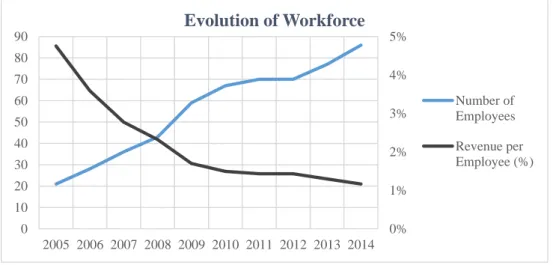
In order to keep up with more demanding markets and to coordinate activities between subsidiaries and headquarters, it was necessary to hire new employees and to subsequently restructure departments and functions within the company. Graphic 2 demonstrates the workforce growth from 2005 to 2014, and how the revenue per employee has been slowly decreasing, despite the increase in the number of employees.
Graphic 2 – Evolution of Workforce
Since its foundation, the company’s core business is the commercialization of technical furniture for laboratories. Turn-key projects became a business unit in 2005, and intelligent laboratories in 2011. The company also operates in the business of maintenance contracts and specialized technical services, although on a very small scale.
In the last few years, the revenue generated by the technical furniture business has been increasing, and the one coming from turn-key projects has decreased. Despite having more operational problems than the turn-key projects, there are significantly more technical furniture projects than turn-key ones.
Graphic 3 shows how revenue was generated from 2012 to 2014.
Graphic 3 – Evolution of Revenue per Business Unit 60% 77% 80% 38% 19% 19% 0% 10% 20% 30% 40% 50% 60% 70% 80% 90% 100% 2012 2013 2014
Evolution of Revenue per Business Unit
Others Intelligent Laboratories Turn-Key Projects Technical Furniture 0% 1% 2% 3% 4% 5% 0 10 20 30 40 50 60 70 80 90 2005 2006 2007 2008 2009 2010 2011 2012 2013 2014 Evolution of Workforce Number of Employees Revenue per Employee (%)
3.2 Business Process Modeling
Once the company’s business has been characterized, it is important to understand how its operational processes flow, i.e., how the company internally operates in order to create value for its customers.
In this subchapter, the business processes of the company are analyzed in two phases, first in a general way, and then following a detailed and quantitative approach.
3.2.1 First-level Analysis
A business process is generally defined as a set of tasks that start with a specific input, and that once performed generate an output, which is the input of the following process. Therefore, it represents the flow of products and/or services across all departments and functions of a company. The representation of activities in the form of interrelated and cross-functional processes consists in a business process map.
A business process map makes a distinction between core processes, management processes and support processes. Core processes are the ones which are part of the value chain, i.e., that contribute to the flow of the product/service from the point when it starts to be developed (usually, at a customer’s request), up until the moment it is delivered to the customer. Therefore, these processes add value to what is being offered. On the other hand, support processes are not directly related to the value chain. Their role is to assure that core processes function over time. Management processes are related to the control and monitoring of core processes, and to strategic decision-making (Harmon 2007, 86).
In order to develop this first-level analysis, it was conducted an empirical research of the company’s processes, whether through gemba walks or by directly questioning employees about their daily functions.
The value chain of the company being analyzed is represented in Annex C. The following core processes were identified:
Elaborate Proposal – the process is trigged by a request from a customer, involves a set of activities related to the negotiation of a budget, and delivers a proposal report once the budget has been approved;
Receive and Validate Project Proposal – the process starts once the proposal report is communicated internally, consists in making a first rectification of the approved budget, and delivers the rectified budget;
Prepare and Plan Work – the process begins with the insertion of the approved project in the dispatch plan, involves the planning of the dispatch and installation, the technical treatment of project specifications, the planning of production, stock picking, and purchase orders, and delivers these orders;
Execute and Control Work – the process is triggered by the reception of production, stock picking, and purchase orders, consists in executing these orders, monitoring on-going projects, preparing the dispatch, and delivers separated and packaged materials and equipment;
Dispatch and Install Project – the process starts with the predefined dispatch date, involves the transportation of packaged materials and equipment for the construction site and subsequent installation, and delivers a final inspection of the installation work.
The management processes of the company are defined as:
Develop Business Strategy – plan and monitor the implementation of strategic decisions related to the three business units;
Develop Research, Development, and Investigation (R&D&I) Processes – plan and monitor processes related to research, development, and investigation;
Develop Sourcing Strategy – plan and monitor the implementation of strategic decisions concerning the selection and evaluation of suppliers and business partners; Develop Marketing Plan – plan and monitor the implementation of a marketing plan
indicating the positioning of the company in the market in which it operates, and manage the relationships with customers, suppliers, and other key stakeholders;
Develop Quality System – plan and monitor a quality system that promotes a continuous improvement culture.
Finally, the core processes of the company are backed up by the following support processes: Develop Human Resources – provide adequate training and support to employees; Control Finances – assure the financial health of the company by managing cash flows
and financial investments;
Control Accounting – monitor the costs and revenues of the company;
Maintain Information Technology (IT) System – make hardware updates and assure that the software is adequate to the requirements of the company business.
Once core, management, and support processes have been described, it is necessary to identify who performs them, and what kind of responsibility is attributed to each functional role. The stakeholders involved in the core processes are represented through the following roles:
Project Managers – they deal directly with the client by analyzing their request and negotiating conditions with them, acting as an interface between the client and the rest of the company;
Estimators – they make budget proposals once project managers have identified the customer’s requirements;
Project Technicians – after the customer has approved the budget, they work on specific technical details of the project, such as the rectification of measures (two technicians are assigned to do this), the elaboration of technical drawings for production (a task specifically performed by a distinct technician), and the management of net necessities (executed by a separate technician);
Purchasers – they send and control purchasing orders issued by the project technician responsible for the management of net necessities;
Warehouse – the warehouse comprises employees responsible for production, stock picking, and reception of purchased items;
Chief of Operations – this functional role supervises the work of project technicians, purchasers, and warehouse employees;
Developers – they are responsible for the development of new solutions for the company’s technical furniture portfolio, and for assisting project technicians whenever doubts arise about a line of products they have developed;
Construction Supervisor – this figure makes a first rectification of the approved budget before it is handed to project technicians (due to having a significant working experience), decides the date of dispatch and the assembly team, and controls the state of projects that have been already dispatched;