Emma Nika Ciric
Methane Escape from Lowland
Terrestrial Seepages
Links to Deglaciation and Permafrost Dynamics
UNIVERSIDADE DO ALGARVE
FACULDADE DE CIÊNCIAS E TECNOLOGIA
2019
i
Emma Nika Ciric
Methane Escape from Lowland Terrestrial Seepages
Links to Deglaciation and Permafrost Dynamics
Master in Marine and Coastal Systems
Universidade do Algarve
Supervisors:
Andrew J. Hodson (UNIS)
Óscar M.F.C. Ferreira (CIMA, UAlg)
UNIVERSIDADE DO ALGARVE
FACULDADE DE CIÊNCIAS E TECNOLOGIA
ii
Methane Escape from Lowland Terrestrial Seepages
Links to Deglaciation and Permafrost Dynamics
“Declaro ser a autora deste trabalho, que é original e inédito. Autores e
literatura consultados estão devidamente citados no texto e constam da listagem de
referências incluída.”
“I declare I am the author of this work, which is original and unpublished.
Authors and literature consulted have been cited in the text and are included in the
list of references.”
___________________________________________
iii
“A Universidade do Algarve reserva para si o direito, em conformidade com
o disposto no Código do Direito de Autor e dos Direitos Conexos, de arquivar,
reproduzir e publicar a obra, independentemente do meio utilizado, bem como de a
divulgar através de repositórios científicos e de admitir a sua cópia e distribuição
para fins meramente educacionais ou de investigação e não comerciais, conquanto
seja dado o devido crédito ao autor e editor respetivos.”
“The University of the Algarve reserves the right, in accordance with the
provisions of the Code of the Copyright Law and related rights, to file, reproduce
and publish this work, regardless of the used mean, as well as to disseminate it
through scientific repositories and to allow its copy and distribution for purely
educational or research purposes and noncommercial purposes, although due credit
will be given to the respective author and publisher.”
iv
Acknowledgements
Completing this degree would not have been possible without the support of my family and my friends. My mother Valentina, my brother Boris, and my dog Schneider gave me so much strength these past two years. I would also like to thank my wonderful friends in Canada, Portugal, and Svalbard that encouraged me and lifted me up even when I doubted myself. Thank you to Naomi and Craig for your meticulous editing and for letting me ramble about pingos for hours on end.
I would also like to thank Dr. Óscar Ferreira for accepting me into MACS and being a kind and reliable advisor during my time in Portugal and in Svalbard. He was always ready to help me when I needed it, even when it involved signing (and faxing!) a thousand documents from Ontario. My life would be very different today had I not been accepted to the University of the Algarve.
I want to thank Dr. Andy Hodson for seeing something in me and bringing me to Svalbard. Not only was he a caring and supportive supervisor, but he took me snowmobiling hundreds of kilometers across glaciers and sea ice and had me clambering up steep cliffs with a rifle on my back. The field work I got to do in Svalbard was truly special.
I was lucky to have two supervisors who were encouraging and supportive of me even through health challenges. I would also like to thank my incredible friends, in no particular order- Laura, Dannie, Curtis, Carly, Dan, Rosalie, Chris, and Gustavo for giving me their ear whenever I needed to vent about my thesis.
I have become a very different person in the past two years. I am very lucky to have been supported by such wonderful people during my Master’s degree.
v
Abstract
In the Norwegian archipelago of Svalbard, 90%-100% of exposed land is underlain by continuous permafrost. Permafrost is estimated to store over 1600 gigatons of carbon worldwide. Pingos, features that only exist in permafrost, ventilate methane in much the same manner as pockmarks can ventilate methane clathrates on the ocean floor. In winter 2019, pingos identified on satellite imagery were studied in the field via water samples. This was done to better
understand these uncommon periglacial features and of the methane they release. A database was created using elevation datasets, GIS analysis, winter satellite photography, and geological data to identify pingos in Svalbard as well as the factors that influence their formation and behaviour. The spatial distribution of pingos and fault lines suggests a relationship between fault zones and the formation of pingos, possibly due to the discontinuity caused by the faults allowing for easier flow of groundwater.
In addition, carbon dioxide and methane had a correlation which is probably associated to the microbial processes leading to the formation of methane. Deuterium was another important compound, likely due to the marine sediments within the Holocene marine limit. A predictive model was then established to show the relationship of carbon dioxide and deuterium with methane. This model estimates the amount of methane ventilated based on other compounds measured in pingos. By combining these scientific approaches, this data provides a step forward in understanding methane reservoirs within permafrost environments, particularly relevant in an unstable and changing climate.
Keywords: Svalbard; methane ventilation; open system pingos; continuous permafrost; GIS;
vi
Resumo
No arquipélago norueguês de Svalbard, 90% a 100% da terra exposta assenta em permafrost. Estima-se que o permafrost armazene mais de 1600 gigatoneladas de carbono, em todo o mundo. Pingos são morfologias que só existem no permafrost e que ventilam metano da mesma maneira que as pockmarks podem ventilar clatratos de metano no fundo do oceano. No inverno de 2019, os pingos identificados por imagens de satélite foram estudados no campo, através de amostras de água. Tal foi feito para melhor se entender as características destas incomuns estruturas periglaciais e o metano que elas libertam.
Foi criada uma base de dados que congrega um conjunto de dados de elevação, análise de SIG, fotografia de satélite de inverno e dados geológicos que permitem identificar os pingos. A distribuição espacial dos pingos em relação às linhas de falhas parece indicar uma relação entre as zonas de falha e a formação de pingos, possivelmente devido às descontinuidades causadas pelas falhas, permitindo um fluxo mais fácil das águas subterrâneas.
Além disso, verificou-se que o dióxido de carbono e o metano estão correlacionados, o que é provavelmente devido aos processos microbianos que levam à formação de metano. O deutério foi outro composto importante, provavelmente devido aos sedimentos marinhos dentro do limite marinho do Holocénico. Um modelo preditivo foi então estabelecido para mostrar a relação do metano com dióxido de carbono e deutério. Este modelo estima a quantidade de metano ventilada com base em outros compostos medidos em pingos. Ao combinar várias abordagens científicas, estes dados são um passo em frente na compreensão dos reservatórios de metano em ambientes de permafrost, particularmente relevantes numa situação climática instável e em mudança.
vii
Table of Contents
Sumário ... x 1. Introduction ... 1 2. Study Area ... 4 2.1 Geography ... 4 2.2 Geology ... 52.3 Historical Glaciation and Climate ... 7
2.4 Current Climate Trends ... 9
3. Literature Review ... 12 3.1 Glaciers ... 12 3.2 Pingos ... 13 3.3 Permafrost ... 14 3.4 Arctic Hydrology ... 16 3.5 Methane Ventilation ... 17
3.6 Microbes as a Source of Methane ... 18
4. Materials and Methods ... 20
4.1 Cartography... 20
4.2 Sampling in the Field ... 21
4.3 Statistical Analysis ... 23
5. Results ... 24
5.1 Spatial Distribution of Pingos ... 24
5.2 Methane in Nordenskiöld Land... 27
5.3 Elements of Pingo Formation ... 30
5.4 Relationship Between Methane and Other Compounds ... 35
6. Discussion ... 39
6.1 Physical Geography of Pingos on Svalbard ... 39
6.2 Compounds Associated with Methane ... 42
6.3 Limitations ... 44
7. Conclusion ... 45
8. References ... 47
viii
Index of Figures and Tables
Figure 1.1. Lagoon Pingo in Spitsbergen, Svalbard with two snowmobiles for scale………...2
Figure 2.1. The Arctic Ocean and its marginal seas……….……….5
Figure 2.2. Svalbard’s stratigraphic regions………..6
Figure 2.3. Location map representing the Svalbard archipelago………...7
Figure 2.4. The Svalbard-Barents ice sheet during the LGM………8
Figure 2.5. Historical average temperatures in Longyearbyen and hours of sunlight……….…...10
Figure 2.6. Global temperature anomalies from 2000-2009………11
Figure 3.1. Schematic of a pingo in Kunlun Mountain, China………14
Figure 3.2. Permafrost distribution in the circumpolar north………..16
Figure 3.3. An example of an icing in Adventdalen, Spitsbergen, Svalbard………...17
Figure 4.1. Water from a groundwater icing being passed through membrane detectors………...22
Figure 4.2. A Pro Oceanus laser detector measuring methane in July 2019………22
Figure 5.1. Location of all identified (98) pingos (purple circles) at Svalbard………24
Figure 5.2. The locations of pingo-associated icings on Svalbard………...25
Figure 5.3. Colour-coded groundwater icings on Nordenskiöld Land………26
Figure 5.4. Pingo elevations throughout the archipelago of Svalbard………...27
Figure 5.5. Locations of the four pingos sampled between 2015 and 2017 in Adventdalen………...27
Figure 5.6. The locations of winter sites in Nordenskiöld Land visited in 2019………...28
Figure 5.7. Methane at different sites visited in Nordenskiöld Land in winter of 2019………..29
Figure 5.8. High methane release is generally associated with low oxygen release………30
Figure 5.9. Known fault lines on Svalbard relative to the position of pingos………...31
Figure 5.10. Distance of pingos on Spitsbergen to the nearest fault in kilometers………..32
Figure 5.11. Pingos closely associated with major fault lines on Andrée Land………..32
Figure 5.12. Pingos closely associated with major fault lines on Wedel Jarlsberg Land………33
Figure 5.13. Pingos closely associated with major fault lines on Nordenskiöld Land………34
Figure 5.14. Example of three pingo groups in valleys on Svalbard………...35
Figure 5.15. Index of pingos relative to their position in the valleys………..35
Figure 5.16. Linear regression of methane with deuterium………...37
ix
Table 5.1. Component analysis from four pingos in Adventdalen, Spitsbergen, Svalbard……...36 Table 5.2. Regression statistics for methane with carbon dioxide and deuterium………...37 Appendix Table 0.1. The locations and parameters measured at icings in Nordenskiöld Land…………..55 Appendix Table 0.2. Data taken from Adventdalen pingos years 2015 to 2017…...………..57 Appendix Table 0.3. A list of the 98 pingos found on Spitsbergen and Edgeøya………...60
x
Sumário
O permafrost é um estado térmico descrito como solo que permanece abaixo de 0 ° C por dois ou mais anos. O permafrost está subjacente a 25% da área total da terra, mas não foi ainda adequadamente estudado porque ocorre principalmente em regiões polares e alpinas isoladas. No arquipélago norueguês de Svalbard, 90% a 100% da terra exposta assenta em permafrost, sendo que 60% da área total de Svalbard se encontra coberta por glaciares. Estima-se que o permafrost armazene mais de 1600 gigatoneladas de carbono em todo o mundo. Quando o permafrost derrete, o carbono é libertado na forma de dióxido de carbono ou de metano. O metano é
liberado em quantidades menores que o dióxido de carbono, mas os seus efeitos no aquecimento da atmosfera são 28 vezes mais fortes que os do dióxido de carbono. Embora exista um grau considerável de investigação sobre hidratos de metano emanados no oceano, pouco se sabe sobre os reservatórios de metano no permafrost, em terra.
Pingos são morfologias que só ocorrem no permafrost, no Ártico e no subártico, e que ventilam metano da mesma maneira que as pockmarks podem ventilar clatratos de metano no fundo do oceano. Pingos são morfologias que se assemelham a colinas e que ocorrem
isoladamente ou em pequenos grupos, em terrenos baixos, como vales ou planícies costeiras. Em Svalbard, a elevação isostática foi superior à subida do nível médio do mar. Isso permitiu que antigas pockmarks marinhas se tornassem pingos através da injeção de água subterrânea. As injeções de água subterrânea que formam coberturas de gelo (icings) são geralmente ricas em metano proveniente de reservatórios em profundidade, de sub-permafrost. A água é originária dos glaciares de Svalbard e também podem formar coberturas de gelo nas moreias terminais dos glaciares. As coberturas de gelo associadas a pingos apresentaram as maiores taxas de emissão de metano e, portanto, foram o foco deste trabalho. Os pingos e hidrologia associada foram pouco estudados, particularmente em regiões de Svalbard que não são facilmente acessíveis. No inverno de 2019, os pingos foram estudados através de imagens de satélite e amostragem de água, no campo. Tal foi efetuado para melhor entender as características destas incomuns
estruturas periglaciais e o metano que elas libertam. Dados suplementares recolhidos nos anos de 2015-2017 foram utilizados para estimar a emissão de metano e sua relação com a libertação de outros compostos.
xi
Foram identificados 98 pingos em Svalbard, encontrados apenas nas ilhas de Spitsbergen e Edgeøya. Spitsbergen é a única ilha com coberturas de gelo em água subterrânea associadas a pingos. A maioria das coberturas de gelo ocorre na península de Nordenskiöld Land, no centro de Spitsbergen, e, assim, esses pingos foram o foco deste trabalho. A distribuição espacial dos pingos e de linhas de falha parece indicar uma relação entre as zonas de falha e a formação de pingos, possivelmente devido à descontinuidade nas rochas, facilitando o fluxo das águas subterrâneas. Apenas vinte e cinco pingos na ilha de Spitsbergen estavam localizados a mais de dez quilómetros da falha mais próxima e 33,7% dos pingos em Spitsbergen estavam a um
quilómetro ou menos da falha mais próxima. Muitos desses pingos aparecem alinhados de forma paralela às linhas de falha que ocorrem nos vales e ao lado delas.
Um modelo preditivo foi estabelecido para estimar a quantidade de metano ventilada, tendo por base outros compostos medidos em pingos que estão dentro do Holocénico. Foi ainda criado um banco de dados usando conjuntos de dados de elevação, análise em SIG, fotografia de satélite de inverno e dados geológicos. O objetivo foi identificar os pingos em Svalbard, bem como os fatores que influenciam a sua formação e o seu comportamento. As coberturas de gelo associadas a pingos eram mais abundantes na península de Nordenskiöld Land, no centro de Spitsbergen. Em Svalbard, as maiores quantidades de metano libertado, identificadas até agora, estão no vale de Adventdalen, perto da povoação de Longyearbyen. O metano libertado nas coberturas de gelo associadas a pingos atingiu 59% neste vale.
Além disso, verificou-se que o dióxido de carbono e o metano estão correlacionados, provavelmente devido aos processos microbianos que levam à formação de metano. O deutério também está intimamente relacionado com o metano, provavelmente em associação com os sedimentos marinhos localizados dentro do limite marinho do Holocénico. O metano nos pingos é de origem biogénica devido à decomposição de materiais orgânicos. A ventilação de metano ocorre a taxas muito mais altas no inverno do que no verão. Tal decorre do degelo no verão que dilui a água e das bactérias metanogénicas estarem inativas no inverno, permitindo maior libertação de metano. Num clima em mudança, é importante entender o comportamento e a quantidade de libertação de metano no Ártico. Mais investigação de campo deve ser feita em pingos em Svalbard, particularmente em outras áreas de Spitsbergen que logisticamente não são fáceis de alcançar. O metano é um dos principais gases de estufa, e o aumento da sua libertação
xii
pode ser prejudicial para o Ártico. O IPCC considerou Svalbard como um ambiente climático sensível e em grande risco de aquecimento devido a um feedback positivo e à amplificação polar do efeito climático. Ao combinar as abordagens científicas descritas, espera-se que estes dados sejam um passo importante na compreensão dos reservatórios de metano em ambientes de permafrost, particularmente relevantes em situações de instabilidade e mudança climática.
1
1. Introduction
There have been many studies on submarine methane hydrate ventilation, but little research has been published on this phenomenon occurring on land (Stotler et al, 2010). Understanding the dissociation of methane hydrates is vital for recognizing the impact of these features on both the ocean and the atmosphere. The Arctic has stored a vast quantity of methane in permafrost because low annual temperatures prevent the decay of organic matter. Permafrost alone is estimated to contain 720 gigatons of organic carbon globally (Zimov et al, 2006). Svalbard, an archipelago that is part of the Norwegian Arctic, is 60% glaciated with its
remaining land area underlain by continuous permafrost. Since the end of the Little Ice Age in the early 20th century and with global climate change in recent decades, Svalbard has seen an increase in annual temperatures (Norwegian Meteorological Institute, 2011). This increase in temperature is most pronounced in winter. With a low mean annual precipitation, cold winter temperatures are necessary for the preservation of sea ice, permafrost and glaciers. In the summer of 2012, a record minimum of sea ice was reached in Svalbard (Nordli et al, 2014; Metfies et al, 2016). The loss of sea ice, thinning of glaciers, and thaw of permafrost would have local as well as global consequences.
Svalbard, Norway is an excellent place to study the behaviour of methane because it is a unique environment even when compared to other regions in the High Arctic. It is surrounded by shallow seas that contain methane hydrates. Methane is kept from disassociating due to low temperatures and high pressure. Because of isostatic rebound that has occurred since the end of the Last Glacial Maximum, uplift of Svalbard has outpaced rising sea levels (Ingólfsson, 2011). Isostatic uplift better enables methane to ventilate to the atmosphere (Wallmann et al, 2018). In coastal waters surrounding Svalbard, the dissociation of methane clathrates could occur more frequently if bottom water temperatures are increased. On land, methane ventilation can be facilitated by unique periglacial structures known as pingos (figure 1.1). These are conical, ice-cored hills that can only exist in continuous permafrost. The remnants of pingos can be indicators of past periglacial environments. Most studies have been completed on the island of Spitsbergen, the largest island in Svalbard. Because it is the only island that has permanent human
2
Figure 1.1. Lagoon Pingo in Spitsbergen, Svalbard with two snowmobiles for scale. Photograph taken by Craig Hammock in March 2019.
Recent studies suggest that pingos on coastlines form because of the occurrence of pockmarks occurring in shallow bays, fjords, estuaries, and other bodies of water (Hodson et al, 2019). Open-system pingos in parts of Svalbard that were once below the marine limit are thought to originate from former pockmarks. Pockmarks are particularly well-preserved in glacio-marine sediments (Portnov et al, 2016). Pingos presently exist in many parts of coastal Spitsbergen that were recovered from the sea due to isostatic uplift and the reduction of glacial ice. These features release a small amount of methane each year. Although a significant amount of this methane is consumed by methanotrophic bacteria in the sediment in summer, these bacteria are inactive in winter and so methane emissions are significantly increased during this season (Hodson et al, in review). Future research should consider how much methane is being added to the atmosphere by these features (Marín‐Moreno et al, 2013). Although many papers have been written on the release of methane by pockmarks and pingos in the ocean (e.g. Paull et al, 2007; Forwick et al, 2009; Riedel et al, 2018), relatively little attention has been given to these features on land. In light of warming temperatures and increased global attention on the Arctic, it would be educative to research how methane seepage on land will contribute to the overall volume of carbon in the atmosphere.
The main goal of this research topic was to research pingos on Svalbard and the quantity of methane they ventilate to the atmosphere. To accomplish this, the active emission of methane was examined on Spitsbergen, Svalbard, Norway. Factors such as electroconductivity, PH, and other chemicals were also measured. Using GIS, the concentration and distribution of features that may be associated with methane release were characterized. Pingos were the main focus of
3
the study as well as associated groundwater icings. The amount of gaseous methane released from these icings in 2019 was quantified and compared to results on four major pingos
researched in central Spitsbergen from 2015-2017. Component analyses and multiple regression were two statistical methods used to identify compounds associated with methane. Throughout geologic history, freeze-thaw cycles in permafrost and methane ventilation have occurred as part of natural cycles. However, in a warming climate this natural process is changing and needs to be studied. Understanding these processes in the past and in the present is necessary to comprehend the future behaviour of methane ventilation in a warming climate.
4
2. Study Area
2.1 Geography
Svalbard is an archipelago measuring about 63 000 km2. It is international territory that is administrated by Norway, located between latitudes 74° to 81° N and from longitudes 10° to 35° E. Located in the Arctic Circle, the closest landmass is Greenland to the west. The islands are located between the Barents Sea to the east, the Greenland Sea to the west, the Norwegian Sea to the south, and the Arctic Ocean to the north (figure 2.1). In most parts of the world, soil,
vegetation, and anthropogenic activities have made geological formations indistinct to the naked eye. However, Svalbard acts as a natural archive of the earth’s geological history. There are relatively few animals and plants found on the island because of the extreme climate (Rønning, 1996). Winter lasts from October to May and summer from June to September. Often, snow and ice from winter will persist into the month of June. There has been very little human
development due to historically limited human habitation. Svalbard has never had an indigenous human population.
Apart from humans and domestic dogs, there are only three terrestrial mammals- Svalbard reindeer (Rangifer tarandus platyrhynchus), southern vole (Microtus levis), and the Arctic fox (Vulpes lagopus). The coasts have a multitude of marine mammals including polar bears, walruses, seals, and many species of migratory whales and dolphins. Svalbard is also the breeding ground of many migratory seabirds such as the Arctic tern and black-legged kittiwake. Because of the polar latitude, the growing season for plants in Svalbard is only a few weeks long. Permafrost beneath the surface of the soil prevents roots from growing very deep. Consequently, plants on Svalbard are rarely higher than 10 cm in height. The biome of Svalbard’s largest island, Spitsbergen, is designated as an Arctic tundra, and so many Arctic plants such as Saxifraga sp., Salix sp., Potentilla sp., and Ranunculus sp. are found throughout the island (Rønning, 1996).
5
Figure 2.1. The Arctic Ocean and its marginal seas (Piepenburg, 2005). Svalbard is located within the confines of the black box.
2.2 Geology
The islands of Svalbard have a basement complex of igneous and metamorphic rocks as well as sedimentary covers deposited from the Devonian to the Permian periods (Hjelle, 1993). Svalbard also has a great deal of unconsolidated deposits from the erosion of glaciers
(Norwegian Polar Institute, 2015). Presently, 60% of the islands are covered in glacial ice and polythermal glaciers. The landforms of Svalbard have been affected by multiple glacial periods that have eroded valleys and deposited sediments that influence its environment today (Benn and Evans, 2014). Furthermore, Svalbard is geologically unique because of how well-preserved its stratified sedimentary layers are (figure 2.2). Because the islands were below sea level for much of history, deposition has occurred in nearly perfect stratified columns. Today, this stratification is plainly visible because of the lack of vegetation on the island. The bedrock lies open and exposed, revealing the ancient basement from the Precambrian period all the way to the unconsolidated sediment of the Quaternary period (Hjelle, 1993).
6
Figure 2.2. Svalbard’s geologic regions (Bøggild et al, 2007).
This case study will mainly focus on the island of Spitsbergen, the largest of the islands that make up Svalbard. Spitsbergen contains all of the permanent inhabitants of Svalbard, with the capital, Longyearbyen, located roughly in its geographical center (figure 2.3). The area around Longyearbyen is mainly comprised of coastal lowlands and glacial valleys. Glaciers have greatly impacted the geology and environment on Spitsbergen. These glaciers are cold-based, meaning they are frozen to their beds, or polythermal, meaning they contain both temperate ice at 0°C and cold ice below 0°C (Benn and Evans, 2014). Glaciers nourish groundwaters near the coast and create the valleys found throughout Spitsbergen. This thesis will focus on the central area of Spitsbergen, which is called Nordenskiöld Land. This is a peninsula with the settlements of Longyearbyen, Barentsburg, and Sveagruva. Nordenskiöld Land has tertiary lithology, and is mainly composed of sandstone and shale with many coal deposits. Human habitation has mainly
7
existed in this area due to the coal fields that have been mined since the early 20th century, so
data on this region dates back to the early 1900s. Coastal valleys at low elevation on
Nordenskiöld Land are of interest because they are where most pingos (see description below) occur on the island.
Figure 2.3. The Svalbard archipelago with settlements on the island of Spitsbergen (Norwegian Polar Institute, 2016). Nordenskiöld Land on Spitsbergen is the peninsula found within the boundaries of the black box.
2.3 Historical Glaciation and Climate
In Svalbard, there is a direct link between climate patterns and the mass balance of ice sheets and glaciers. Svalbard was entirely covered by an ice sheet during the Weichselian
8
glaciation in the Quaternary period, the last glaciation in northern Europe. The ice sheet covering Svalbard and its shelf area was known as the Svalbard-Barents ice sheet (figure 2.4), and it depressed the entire archipelago. The ice sheet began declining around 15 000 years ago via iceberg calving, but a fraction of the ice sheet persisted until about 11 000 years ago when rapid deglaciation followed the Younger Dryas glacial readvancement (Matsuoka et al, 2004). Since the reduction of the ice sheet at the end of the glaciation, Svalbard has been subject to isostatic rebound. During the past 11 000 years, Svalbard has risen approximately 130 meters due to isostasy and continues to rise (Ingólfsson, 2011). Shells can be found on former marine terraces on Svalbard’s coastline as evidence that they were once submerged. Although glaciation in the Holocene is at a lesser extent than during the Last Glacial Maximum (LGM), Svalbard’s current landscape is largely shaped by the actions of glaciers. The ice sheets eroded fjords and wide U-shaped valleys, particularly in the northern and eastern regions. Svalbard’s very thin soil cover was mostly formed during the Quaternary period from erosion and glaciation (Hjelle, 1993). The coastal plains, marine terraces, and other regions that now form part of the Holocene marine limit have saline sediments.
Figure 2.4. The Svalbard-Barents ice sheet during the LGM with ice streams denoted by arrows (Ingólfsson, 2011).
Data on glaciers worldwide was limited prior to the 19th century, but Svalbard even more
so due to its geographic isolation. No measurements were taken until official scientific expeditions were mounted beginning in the late 19th century. Temperature was observed
9
extensively in western Spitsbergen starting in 1898 and was compiled into a composite series extending between 1898 and 2012 (Nordli et al, 2014). However, these observations are not continuous. The data will often have gaps from the moving of stations and settlements in the early 20th century as well as events such as World War II. Although this data is not complete; it is vital for understanding the behaviour of glaciers during the Little Ice Age. The Little Ice Age (LIA) was a climate phenomenon that greatly affected Northern Europe as well as the High Arctic (Hjelle, 1993). The LIA ended approximately before 1918, resulting in slightly warmer temperatures throughout northern Europe and Svalbard. This coincided with an observed
reduction in the mass balance of glaciers throughout Svalbard over the past century (Hambrey et al, 2005). It can therefore be argued that climate patterns are among the most important factors in glacier mass balance. In a glacier-dominated landscape such as Svalbard, receding glaciers can have many effects. These include terrestrial erosion rates and changes to the sediment loads added to the surrounding fjords. In turn, benthic communities in the fjords of Svalbard can be affected, changing the dynamics of marine ecosystems (Lønne and Lyså, 2005).
2.4 Current Climate Trends
For the purpose of this research paper, climate data from Longyearbyen was used.
Longyearbyen is found on the western coast of Spitsbergen. The town is defined as having an ET (tundra) climate using the Köppen Climate Classification System (Eckerstorfer and Christiansen, 2011) because the warmest month on average is between 0°C and 10°C. However, it is important to note that temperatures widely vary across Spitsbergen due to the variation in elevation,
proximity to the sea, and oceanic currents (Nordli et al, 2014). Although designated as a polar climate due to its high latitude, Svalbard sees warmer average temperatures than other places at similar latitude such as northern Russia and Greenland (Christiansen et al, 2013). This moderate climate is due to the West Spitsbergen Current that brings warm water from the North Atlantic (Nordli et al, 2014). The seas around western Spitsbergen are navigable and ice-free year-round, particularly when compared to other polar regions. Conversely, the East Spitsbergen Current originates from the Arctic Ocean and brings very cold water. The eastern coast of Spitsbergen is thus much colder and ice-covered than the western side (Aagaard et al, 1987). Because cold and warm air meet at Spitsbergen, this creates very high wind speeds in the winter. Precipitation falls year-round but in small amounts, averaging about 177 mm per year (Norwegian Meteorological Institute, 2011). Svalbard also has the phenomenon of polar days and polar nights. From
10
November to February, the sun does not rise, and from May to August, the sun does not set (figure 2.5). As a region in the High Arctic, Svalbard is very sensitive to climatic changes such as the phenomenon of polar amplification. This climate sensitivity was highlighted in the IPCC’s fifth report (Aas et al, 2016).
Figure 2.5. Historical average annual temperatures in Longyearbyen and hours of sunlight received. This figure was created using data from the Norwegian Meteorological Institute (2011).
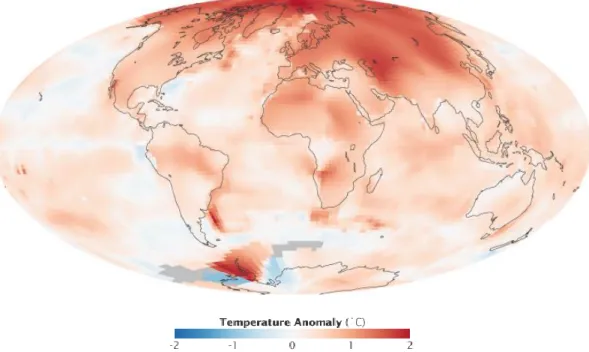
Warming in the Arctic has become a recognized issue worldwide. Svalbard is sensitive to climate differences due to polar amplification. Changes in the net radiation balance produce larger changes in temperature near the poles than in tropical or temperate latitudes (figure 2.6). The result is that the present warming of the Arctic is estimated to be twice that of the global average. Reduced sea-ice cover leads to less albedo, creating a positive feedback of increased warming. Furthermore, moist and warm air masses are carried northward towards the Arctic (Voiland, 2013). This can increase precipitation, mostly in the form of rain rather than snow. As a result, increased warming is most pronounced in the winter season. Temperatures can increase by as much as 10˚C in the winter while only increasing by 1˚C in the summer. As a polar desert, Svalbard has little annual precipitation. An increase in rain rather than snow cannot maintain glaciers and snow cover (Hansen et al, 2014).
-20 -15 -10 -5 0 5 10 0 50 100 150 200 250 300 Temper atu re ° C H o u rs of S u n lig h t Month
Longyearbyen Annual Climate Averages (1961-1990)
11
Warmer temperatures recorded in the past thirty years are the likely cause of glacier recession in Svalbard, and continued warming climate trends will most likely exacerbate the loss of mass balance. Moholdt et al (2010) found that small glaciers in Svalbard, particularly those at low elevations, have experienced the highest loss of mass balance. This effect is most
pronounced in western Spitsbergen, which overall has warmer temperatures than the east. Glaciers rely on accumulation from winter precipitation in order to maintain a positive mass balance. Although precipitation will increase, this will be in the form of rain and not snow. Without enough accumulation to recover their mass in winter, it is likely that glaciers will experience increased recession rates. Increased recession will affect the hydrology and drainage of Svalbard, which in turn will influence permafrost (van Pelt et al, 2016). The Arctic has natural climate variability and anomalies that occur outside of climate change. It is important to research these natural fluctuations to provide a more comprehensive understanding of how the Arctic environment will respond to a warming climate.
Figure 2.6. Global temperature anomalies from 2000-2009 compared to the global annual mean in the past 50 years. This was created with GISS surface analysis (Voiland, 2013).
12
3. Literature Review
3.1 Glaciers
A glacier is a persistent body of dense ice formed over centuries of snow accumulation that is massive enough to flow under its own weight. Glaciers are a major component of the physical geography and hydrology of Svalbard. Glaciers are not understood as a physical object but more as a system. They gain and lose water and debris. They contribute to the volume of oceans via eustatic sea level rise as well as the atmosphere. Glaciers have an ablation zone, which is defined as the part of the glacier that experiences melting, breakage, and evaporation. Conversely, the accumulation zone is where snow and ice gather. These gains and losses are collectively referred to as the mass balance (Benn and Evans, 2014). Glaciers have historically formed where the accumulation of snow and ice could match or exceed the loss of snow and ice. This naturally means that glaciers are associated with regions of high latitude as well as high altitude where air density and a low solar angle result in low average temperatures and high snow accumulation. They are irrevocably linked with eustatic sea level rise due to their ability to store enormous volumes of ice (Ingólfsson, 2011). Glaciers have eroded the many fjords and valleys found throughout Spitsbergen. The islands of Spitsbergen, Kvitøya, and Nordaustlandet are almost entirely glaciated. The few areas that are seasonally ice-free have evidence of past glacier activity such as moraines. Glaciers have shaped the geomorphology of Svalbard by scouring out massive channels and glacial valleys and by depositing sediment and till. Spitsbergen has valley glaciers as well as ice caps, which are areas of ice smaller than 50 000 km2 (Pälli et al, 2003).
There are three main classifications of glaciers- temperate, cold, and polythermal (Benn and Evans, 2014). Temperate glaciers are defined by being relatively warm, usually at or near 0°C. They require high precipitation to combat melting rates in summer. Cold-based glaciers have temperatures that are significantly lower than 0°C and are generally frozen to their beds. The type of glaciers found on Svalbard cold-based and polythermal. A polythermal glacier is the most common type of glacier geographically and contains a mixture of temperatures. Different parts of the glacier are below or at the melting point. The temperature of a glacier determines whether or not there is liquid water at the bed and if meltwaters can access or exit the glacier interior without refreezing (Wadham et al, 1998). Spitsbergen has polythermal glaciers which behave in a specific manner due to the polar marine climate. In spring, temperate ice is created in
13
the accumulation zone when meltwater is refrozen. In the ablation zone, freezing temperatures in winter create a near-surface layer of cold ice. The glaciers found on Spitsbergen have cold as well as temperate ice (Hodson and Ferguson, 1999).
Many of Spitsbergen’s coastal areas were once submerged beneath the Arctic Ocean. These areas have now lifted above sea level due to the phenomenon of isostatic rebound. The weight of an ice sheet can depress the earth’s crust beneath it. During the Last Glacial Maximum (LGM), the massive weight of glaciers deformed the asthenosphere below Spitsbergen. Many lakes, such as Vårfluesjøen in the north of Spitsbergen, were once marine environments. The shells of prehistoric marine fauna found in these freshwater lakes strongly supports this theory (Røthe et al, 2018). During the LGM, Svalbard was connected with the rest of Europe because of the Scandinavian Ice Sheet. Over the past 8000 years, isostatic rebound in Svalbard has outpaced eustatic sea level rise (Wallmann, 2018). Isostatic rebound rates are not uniform in Svalbard (Bondevik et al, 1995).
3.2 Pingos
A pingo is a type of periglacial feature that consists of a core of massive ice with layers of sand and gravel (Yoshikawa, 1993). It appears as a mound or hill that can be ten to forty meters in height and may have a cratered top containing liquid water in summer. Although pingos can be conical, they often have oblong, irregular shapes (Liestøl, 1996). Pingos are
traditionally classified into two different forms- open-system, or hydraulic, and closed-system, or hydrostatic. Hydraulic pingos are generally found in continuous permafrost while hydrostatic pingos are features of discontinuous permafrost (Burr et al, 2009). Open-system pingos are the most common type of pingo on Svalbard. Hydraulic pingos develop when groundwater that is under artesian pressure reaches the surface (Müller, 1959). In general, they occur as isolated features or as small groups within the same locality. They generally form in areas with topographic relief, such as lower hillslopes, alluvial fans, or valley bottoms. Groundwater seepages causes icings to form on their domes or at their flanks, which are most visible in late winter (French, 2007).
On Svalbard, many of the larger pingos are related to geologic faults that facilitate the transport of ice melt from glaciers (Liestøl, 1976). This theory is corroborated by studies done on pingos in China (Burr et al, 2009). A discontinuity in the bedrock allows for better transport of
14
groundwater (figure 3.1). The presence of groundwater can influence the formation of permafrost features such as pingos. Hydraulic pingos grow from ice injection of groundwater from artesian pressure, and three variables are very important to maintain their form. Pingos that are cut off from a supply of groundwater will eventually collapse, such as pingos in Reindalen, Svalbard. Water pressure, which is determined by conditions external to the pingo, overburden strength, and rate of freezing, which depends upon temperature (Yoshikawa and Harada, 1995). Since all three may change independent of the others, this balance will rarely be maintained for the total growth period of a pingo. This is likely why pingos are not common permafrost features.
Figure 3.1. Schematic of a pingo in Kunlun Mountain, China, located near South Kunlun Fault and its associated minor fault line (Burr et al, 2009).
3.3 Permafrost
On land, pingo growth is associated with the aggradation of permafrost. Permafrost refers to a thermal state when a feature remains at or under 0°C for two years or more (Osterkamp, 2005). Permafrost can contain ice, but it is not defined by the presence of ice because it can occur in ground that does not contain any water. The presence of permafrost influences the population diversity of flora and fauna in Arctic and sub-Arctic environments as well as greatly impacting carbon storage and hydrology. Permafrost makes up a significant part of the physical geography of Svalbard as well as Russia, Canada, China, Mongolia, Alaska, and some parts of Antarctica. Permafrost can exist underneath the ocean and can also be found at high altitudes, such as in the Andes Mountains (Hong et al, 2017). There are four types of permafrost
distribution- continuous, discontinuous, sporadic, and isolated. This defines areas that are nearly or completely underlain by permafrost (90%-100%), widespread regions underlain by permafrost (50%-90%), partial coverage (10%-50%), and areas where permafrost only exists in isolated patches (0%-10%) (Brown et al, 1997). Svalbard is underlain by continuous permafrost, as seen in figure 3.1.
15
Permafrost is well-known for storing high amounts of organic carbon. This is mainly due to the low decomposition rates of organic matter in cold environments. Several studies have described permafrost as a cryosphere cap that prevents or inhibits carbon emissions (Shakhova et al, 2007; Anthony et al, 2012). When permafrost thaw occurs, this organic matter can decompose very quickly and more carbon is added to the atmosphere. Permafrost thaw can also cause issues such as subsidence, which is when the ground collapses because of the loss of volume associated with melting. Frost heave is a similar occurrence that causes ground to expand by up to 9% when water freezes. Permafrost was first described and studied by engineers attempting to reduce the effects of thaw subsidence and frost heave on infrastructure (French, 2007).
Permafrost is a vital component of Arctic geomorphology and hydrochemistry.
Permafrost does not exist directly at the surface, where the top layer of soil experiences thawing and freezing cycles associated with seasonality. This layer is known as the active layer, and this is where processes such as microbial activity can occur. Beneath the active layer is a transient layer which is in some years part of the active layer and in some years part of the underlying permafrost (van Everdingen, 1998). Groundwater movement in permafrost can be restricted to the active layer, where seasonal thawing and freezing occur. It can also be restricted to sub-permafrost, unfrozen ground beneath permafrost that can contain deep aquifers (Haldorsen et al, 2010). Within permafrost, there can be unfrozen pockets referred to as taliks. In continuous permafrost, taliks can be created from local heat sources or form following a change in the ground’s thermal regime (Ling et al, 2012). Finally, sediments that are saline can be unfrozen below 0°C due to salt water’s lower freezing point. In Svalbard, isostatic uplift has exceeded rising sea levels. This means that much of Svalbard’s land area was submerged during the Last Glacial Maximum approximately 11 000 years ago and thus contains salty sediments (Elverhøi et al, 1995).
16
Figure 3.2. Permafrost distribution in the circumpolar north. Image by Philippe Rekacewicz. Data was used from the International Permafrost Association, 1998. Available on the National Snow and Ice Data Center website
(nsidc.org).
3.4 Arctic Hydrology
Permafrost is an important component of Arctic hydrology. Although the presence of permafrost does not necessarily inhibit the movement of groundwater, it is an important factor in water storage as well as responsible for reducing reaction and dissolution rates. Carbon dioxide, calcites, dolomites, gypsum, and siderites are more soluble at lower temperatures (Woo, 2012). The composition of groundwater largely depends on its origin as well as residence time. For instance, siderites are often found in shale and sandstone, which are a vital part of the tertiary geology of Nordenskiöld Land. Groundwater springs can be saline, brackish, or iron-enriched and acidic. Evidence of groundwater flow in winter can be seen in the form of groundwater icings. Groundwater icings are most visible in late winter (figure 3.2), when the active layer has
17
been frozen for months and air temperatures are not yet sufficient for melting to occur (Anthony et al, 2012).
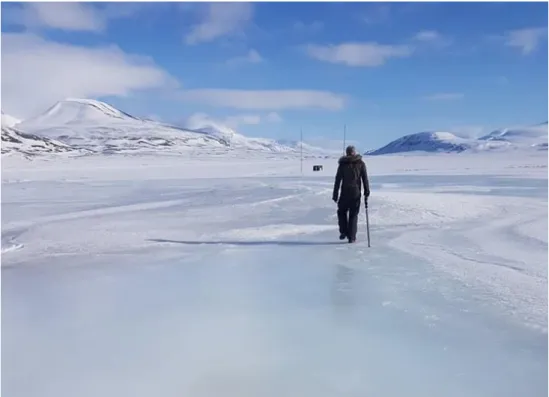
Figure 3.3. An example of an icing in Adventdalen, Spitsbergen, Svalbard with person for scale. Photograph taken by Emma Ciric in April 2019.
3.5 Methane Ventilation
Pingos are unique to continuous permafrost environments, but are not common
structures. They require certain hydrological, elevational, and geomorphological conditions in order to form. Pingo-like features that are associated with the decomposition of methane clathrates have been studied on the ocean floor (e.g. Frederick and Buffett, 2014; Berndt et al, 2014; Forwick et al, 2009). Rather than being driven by ice accumulation, the sediment in places like the Beaufort Sea has been expanded and moved by gases. The warming effect of methane per unit mass is 28 times higher than that of carbon dioxide (Mau et al, 2017). Methane
clathrates, used synonymously with methane hydrates, are substances formed when methane gas is forced into a solid form by a combination of high pressure and low temperatures. Methane clathrates are crystalline and can have the same appearance as ice (Portnov et al, 2016). An increase in temperature or decrease in pressure can cause rapid ventilation of methane through the water column and into the atmosphere.
18
The dissociation of methane hydrates in submarine sediments can be an indication of past climate change. Because the stability of a methane clathrate relies on temperature and pressure, dissociation can be used to study previous variations in ocean conditions (Marín‐Moreno et al, 2013). Because so little is known about methane hydrates in the present, this information could be used for present implications of methane affecting the Arctic carbon budget (Westbrook et al, 2009). In Russia, several studies have been done on the link between subsea permafrost and methane hydrates (Serov et al, 2015; Portnov et al, 2013; Portnov et al, 2014). This is because permafrost can act as a seal for methane, one that either traps methane entirely or limits its release. The thaw of coastal and subsea permafrost throughout Svalbard is very likely to affect the natural emissions of methane. Permafrost-associated methane hydrate deposits are found at shallow depths within the sediments of Arctic continental shelves. Frederick and Buffett (2014) found that taliks can provide an escape for methane when dissociation occurs. This temperature anomaly can occur due to hydrological, geochemical, or thermal conditions. On Spitsbergen, taliks have been found beneath open-system pingos (Riedel et al, 2018).
It has been shown in previous studies (Hodson et al, 2019; Portnov et al, 2016) that significant contributions to methane in the atmosphere can be made by methane reservoirs located in or below sub-permafrost ground water. In Nordenskiöld Land, methane can escape via open-system pingos. The creation of open-system pingos has been linked to isostatic uplift and permafrost aggradation as a result of ice sheet retreat since the Last Glacial Maximum. Open-system pingos can also originate from pockmarks on the ocean floor, which act as a conduit for methane escape much like pingos do on land. Pockmarks have similarly been associated with the retreat of the ice sheets since the LGM (Crémière et al, 2016).
3.6 Microbes as a Source of Methane
Strong evidence supports microbiological activity as a major source of methane in Svalbard. Compounds converted into hydrogen and carbon dioxide and then reduced to methane are an indicator of microbiological activities. Studies (Müller et al, 2018; Mackelprang et al, 2011; Wagner and Lieber, 2010) have shown that Adventdalen in particular has such a large amount of methane due to particularly high rates of anaerobic microbiological activity. These bacteria form methane in a process known as methanogenesis. Methanogenic archaebacteria belonging to the families Methanobacteriaceae, Methanomicrobiaceae, Methanosarcinaceae,
19
and Methanosaetaceae (Wagner and Lieber, 2010) have been identified in Arctic permafrost environments. Adventdalen has been the valley that has been studied most in Svalbard, due to its proximity to the capital of Longyearbyen and thus ease of access. It is possible that
methanogenic archaea are the source of methane that is emitted in other valleys such as
Reindalen and Grøndalen. As these microbes are most active during the thaw, it can be estimated that their activity will increase if temperatures warm. However, little is known on the current population and the density of existing methanogenic archaea in Svalbard.
20
4. Materials and Methods
4.1 Cartography
Using topographic maps of Svalbard provided by the Norwegian Polar Institute (2016), pingos were identified throughout Svalbard to create a database. Pingos are visible on satellite imagery as singular or grouped craters or hills on lowland terrain. A map of all pingos found in coastal lowlands across Svalbard was created using QGIS and Sentinel satellite imagery
provided by the Norwegian Polar Institute (2016). Lowlands are parts of Svalbard that are light brown in maps (figure 2.1), generally in the form of valleys and coastal plains. Pingos were located using topographic maps. Icings were located using winter satellite imagery. Icings that appear in late winter are indicative of pressurized groundwater. These icings can be associated with mountain springs, glaciers, or pingos.
Although pingo icings were located across the island of Spitsbergen, the geographic focus was on the peninsula of Nordenskiöld Land on the island of Spitsbergen because of the quantity of pingos and ease of access for field work. Icings of mountain spring and glacial origin were denoted on Nordenskiöld Land. In addition to locating icings, fault zones were mapped across all of Svalbard. Faults occur frequently and in large clusters across Spitsbergen,
particularly in areas associated with pingos. The distance between pingos and the nearest fault line was measured to find an association between the two features.
It is hypothesized that thicker marine infill at the Holocene marine limit allows for less groundwater passage because of low permeability. Essentially, groundwater is forced out the sides of the valley where the marine infill is thinner (Røthe et al, 2015). Based on this
hypothesis, pingos should be found at the valley margins in the Holocene marine limit and closer to the center outside of this limit. To achieve this, distance was measured between the pingo and the center of the valley. This distance was then divided by the total width of the valley in order to obtain a 0-1 index for proximity of the pingos to the valley center, with 0 being near the margins and 1 being at the center.
21
4.2 Sampling in the Field
Field work was completed from March to May 2019 with visits to wide glacial valleys on Nordenskiöld Land. Data collection was completed over three months. Field sites were chosen based on the locations of icings found on satellite imagery. Many of these sites have been sampled in previous studies (Hodson et al, 2019). The purpose of these visits was to make observations of the presence of pingos previously identified on satellite imagery, or other features with methane seepages such as pro-glacial groundwater icings. Well-known, active pingos that have been well documented in literature (Yoshikawa and Harada, 1995; Liestøl, 1977) were visited as well as new icings. Snowmobiles and boats were used to reach the field sites as well as for transferring materials back to the University Centre in Svalbard. Camping supplies in case of emergency always accompanied the snowmobiles. The following factors were measured: gaseous methane, carbon dioxide, oxygen, electroconductivity, PH, and oxidative-reductive potential.
The purpose of sampling in valleys in Spitsbergen was to check for methane evasion using a headspace methane detector. Sites were selected based on the presence of groundwater icings. Icings were located using winter satellite imagery from the Norwegian Polar Institute (2016) with a resolution of 1:15 000. A Panasonic power drill was used to pervade the ice and allow the liquid water to escape. Water that was not pressurized and did not rapidly spout from the core was not measured, as this indicated standing water that was not near the source. Three syringes were filled with water directly from the drilled core and passed into a flow cell. The flow cell was heated to prevent freezing and had four membrane detectors to analyze pH, electrical conductivity, oxidation-reduction potential, and dissolved O2 (figure 4.1). The
detectors were read using a Hach HQ40 multimeter. OxyGuard and Pro Oceanus laser detectors (figure 4.2) were used to measure free carbon dioxide and gaseous methane concentration as x% of total gases, respectively. One measurement for each substance was made per station. This information was entered into a field laptop. The elevation, geographical area, geological area, and associated groundwater icings were described and annotated in a notebook. Using the measured data, the distribution of methane concentration throughout Nordenskiöld Land was mapped and compared to known sites.
22
Figure 4.1. Water from a groundwater icing being passed through membrane detectors. Photograph taken by Emma Ciric in May 2019.
Figure 4.2. A Pro Oceanus laser detector measuring methane parts per million at a glacial spring near Foxfonna Glacier, Svalbard. Photograph taken by Emma Ciric in July 2019.
23
4.3 Statistical Analysis
Mass spectrometry was intended to be completed on water samples taken in winter 2019, but these results were not possible due to mechanical failure. In order to supplement this, data was obtained from previous sampling done in four pingo sites in Adventdalen, Nordenskiöld Land, Spitsbergen (Hodson et al, in review). These pingo sites release very high quantities of methane and thus data from the years 2015 to 2017 has been used to conduct statistical analysis. Measurements from 2015-2017 refer to aqueous methane expressed as mg/l while the samples collected in 2019 (within this thesis) refer to gaseous methane and are expressed as x% of the total measured gases.
Using data from the above-mentioned paper, SPSS was used to conduct a factor analysis of correlations between various substances detected in the water at four different sites in
Adventdalen between the years 2015 and 2017. The factor analysis was done on winter samplings from Lagoon Pingo, Førstehytta Pingo, Innerhytta Pingo, and River Pingo. The variables used were: methane, carbon dioxide, ammonium, silicate, bicarbonate, chloride,
sulfate, sodium, potassium, magnesium, calcium, strontium, iron, manganese, and total dissolved solids. Microsoft Excel was used to form a linear regression for methane at these four sites to identify what components can be used as explanatory variables for methane. Methane was used as the dependent variable with deuterium and carbon dioxide used as independent variables against it.
24
5. Results
5.1 Spatial Distribution of Pingos
A total of 98 pingos were found on two islands in Svalbard. The vast majority (92) are on Spitsbergen, the largest island in the archipelago. There were 6 pingos found on the island of Edgeøya. Of the 92 pingos on Spitsbergen, 60 are located on the peninsula of Nordenskiöld Land located at the center of the island (figure 5.1).
Figure 5.1. Location of all identified (98) pingos (purple circles) at Svalbard. The largest cluster is located on Nordenskiöld Land, in the center of Spitsbergen.
25
Groundwater icings visible in the winter can have multiple sources such as mountain springs, glaciers, and pingos. Figure 5.2 shows the locations of pingo-associated icings across all of Svalbard. Pingo icings are mainly confined to the peninsula of Nordenskiöld Land in central Spitsbergen. No pingo icings were found on any other islands.
Figure 5.2. Location of pingo-associated icings on Svalbard.
Pingo clusters are found in multiple areas of Svalbard, but only the ones in Nordenskiöld Land have visible groundwater recharge. In Nordenskiöld Land, there are many groundwater icings visible in winter that are not associated with pingos. These icings are typically of
26
mountain spring or glacial origin. Figure 5.3 shows the locations of all icings derived from pingos, mountain springs, and glaciers on Nordenskiöld Land in central Spitsbergen.
Figure 5.3. Groundwater icings on Nordenskiöld Land. The colour-coding distinguishes what features are associated with the icings.
Pingos are features that only occur at low elevations (figure 5.4). Of the 98 pingos, 67 are located on flood plains or valley bottoms that are at or below 100 meters above sea level. Only one pingo was found above 200 meters, in a valley bottom 213 meters in elevation.
27
Figure 5.4. Pingo elevations throughout the archipelago of Svalbard.
5.2 Methane in Nordenskiöld Land
River Pingo, Innerhytta, Førstehytta, and Lagoon Pingo in Adventdalen (figure 5.5) were the four pingos that were the focus of studies from 2015 to 2017 (Hodson et al, in review). In this paper, aqueous methane was reported in mg/l while. The Lagoon pingo had 59% gaseous
methane, River pingo had 7%, and Innerhytta pingo had 15% when sampled in winter 2019. Førstehytta pingo was not sampled in 2019 because there was no visible icing.
Figure 5.5. The locations of the four pingos sampled between 2015 and 2017 (red circles) in Adventdalen Valley, Nordenskiöld Land, Spitsbergen by Hodson et al (in review).
28
A total of 20 sites in Nordenskiöld Land were identified and chosen for measurement based on the presence of groundwater. All locations chosen were valleys that had known pingos, terminal glacier moraines, or both (figure 5.6).
Figure 5.6. The locations of winter sites in Nordenskiöld Land visited in 2019.
Methane was the focus of the compound analysis (figure 5.7). A map was created to show the spatial distribution of different amounts of methane throughout Nordenskiöld Land. Values ranged from 0% to 59% gaseous methane in pingo icings. By far, the highest amounts of methane were in the valley of Adventdalen. Other valleys such as Reindalen and Grøndalen had pingo icings with up to 6% gaseous methane, but most sites with methane in Adventdalen exceeded 10%. Furthermore, only two glacial icings in Nordenskiöld Land had any traces of methane. Both of these values were under 4%.
Reindalen Adventdalen
Grøndalen
29
Figure 5.7. Gaseous methane expressed as a percentage of the total gases at sites throughout Nordenskiöld Land. One measurement was made at each site during a sampling period from March to May of 2019.
Of the other components analyzed in winter 2019, free oxygen had the most visible correlation with gaseous methane. Sites that had free oxygen often correlated with low levels of methane (figure 5.8). In the valley of Trodalen, a site had already been drilled prior to study in March of 2019. The water within had equilibrated and become enriched with oxygen, and no methane was detected.
30
Figure 5.8. Based on data collected in winter 2019 from Nordenskiöld Land, high methane release from icings is generally associated with low oxygen release.
5.3 Elements of Pingo Formation
No pingos were found further than 20.4 km away from the nearest fault line on the island of Spitsbergen (figure 5.9). Of the 92 pingos on the island, only 25 were farther than 10 km from the nearest fault line. 31 pingos were one kilometer or less from the nearest fault line. Mean distance was 5.45 km while median distance was 2.98 km. The mean distance is greater than the median distance, which results in data that is positively skewed (figure 5.10). The island of Edgeøya was not included in the analysis or in figure 5.10 because no data on fault lines was found east of Svalbard. Faults exist with high density in Spitsbergen, and in regions such as Andrée Land (figure 5.11) pingos follow the normal fault lines along several valleys. Only one pingo icing was found in Andrée Land. In regions such as Wedel Jarlsberg Land (figure 5.12) and Nordenskiöld Land (figure 5.13), pingo icings were found near reverse fault lines.
0 100000 200000 300000 400000 500000 600000 700000 0 2 4 6 8 10 12 14 16 18 M e th an e ( mg /l ) Oxygen (mg/l)
31
Figure 5.9. Known and assumed normal fault lines on Svalbard (red lines) and reverse fault lines (blue lines) relative to the position of pingos (purple circles) and pingo icings (blue circles) on Edgeøya and Spitsbergen.
Edgeøya
32
Figure 5.10. Distance of pingos on Spitsbergen to the nearest fault in kilometers. The island of Edgeøya was not included due to the fact that there is no geological data east of the island.
33
Figure 5.12. Relationship between pingos (purple circles) and pingo icings (blue circles) relative to normal faults (red lines) and reverse faults (blue lines) in Wedel Jarlsberg Land, Spitsbergen.
34
Figure 5.13. Relationship between pingos (purple circles) and pingo icings (blue circles) relative to normal faults (red lines) and reverse faults (blue lines) in Nordenskiöld Land, Spitsbergen.
Pingos being found at the valley margins closer to the marine limit and at the center of the valleys father from the marine limit only occurred in a few regions (figure 5.14). The
distribution of pingos across the valleys is slightly bimodal, but the peaks are not distinct enough to be significant (figure 5.15).
35
Figure 5.14. Example of four pingo groups in valleys on Svalbard and their proximities to the valley center. On the index, 0 is the valley margins while 1 is the exact center of the valley.
Figure 5.15. Index of pingos relative to their position in the valleys, with 0 being as close as possible to the sides of the valley and 1 being as close as possible to the center of the valley.
5.4 Relationship Between Methane and Other Compounds
Principal component analysis was used to reduce the dimensions of the 2015-2017 dataset (Hodson et al, in review) and facilitate interpretation of the dominant factors linked to methane. The SPSS analysis of winter data sampled between 2015 and 2017 permitted the identification of four major components that justify correlations between different substances in the groundwater. Four factors were retained on the basis of their eigenvalues being greater than
0 5 10 15 20 25 0 0.2 0.4 0.6 0.8 1 D istan ce fr o m Oce an ( km )
Proximity of Pingo to Valley Center Index
Grondalen Eskerdalen Aurdalen Kjellstromdalen
36
1. As a consequence, four components were retained that described x% of the total variance in the dataset. Each major component justifies the relationship between certain elements and compounds (table 5.1). In component 1, carbon dioxide and methane appear to be closely correlated with values of 0.72 and 0.70, respectively. In component 2, total dissolved solids are strongly associated with sodium and with bicarbonate. Component 3 explains the association between ammonium and strontium, while the fourth and final component is largely responsible for manganese. Component 1 explained 38.7% of the variance, while component 2 explained 29.0% of the variance. Component 3 justified 14.7% of variance, and component 4 was 10.4% of variance. In total, 92.8% of the variance was cumulatively justified by the four components.
Table 5.1.Component analysis of the measured chemical elements, compounds, and total dissolved solids (TDS) from four pingos in Adventdalen, Spitsbergen, Svalbard.
Substance Component 1 2 3 4 CH4 .70 .25 .50 .35 CO2 .72 .43 -.07 .41 NH4 -.27 .12 .86 .34 Si -.64 -.18 -.63 .28 HCO3 -.24 .92 -.21 -.07 Cl- .93 .05 .26 -.03 SO4 -.89 .40 .00 .08 Na .39 .91 -.02 -.09 K -.96 .20 .07 -.01 Mg -.72 .63 -.04 .01 Ca .44 .84 -.22 .04 Sr .59 -.08 -.72 .26 Fe .69 -.23 -.29 -.38 Mn .05 .25 .20 -.92 TDS .07 .98 -.09 -.02
Deuterium (D) and carbon dioxide (CO2) were found to be the most statistically
significant when compared against methane (figure 5.16, figure 5.17). The p-values were all very small (table 5.2), indicating that the test was statistically significant. When a multiple regression was done in Microsoft Excel, they accounted for 91.0% of the variance of methane. Originally δ18O was used instead of deuterium because it is generally associated with methanogenesis, but δ18O only justified 87% of the variance of methane. Thus, deuterium was used. The R-squared
37
value of deuterium and carbon dioxide was 0.910 and the adjusted R-squared value was 0.902. This means that very few variables were not significant. Using this regression, an equation was proposed to estimate methane based on the proportions of carbon dioxide and of deuterium.
Table 5.2. Regression statistics with methane used as the dependent variable and with carbon dioxide and deuterium as the independent variables. All values are significant as they have significance levels lower than 0.05.
Coefficients
Standard
Error t Stat P-value
Multiple Regression Intercept 195.1 24.58 7.939 6.70E-08
Carbon Dioxide 0.019 0.004 4.583 1.45E-04
Deuterium 1.758 0.226 7.759 9.75E-08
Figure 5.16. Relationship between deuterium and methane based on data from Hodson et al (in review). The methane described here is aqueous methane expressed as mg/l. Significance was 3.78E-10.
y = 0.3383x - 110.46 R² = 0.824 -112.0 -110.0 -108.0 -106.0 -104.0 -102.0 -100.0 -98.0 -96.0 -94.0 0.00 10.00 20.00 30.00 40.00 50.00 De u terium (% v s VSMOW) Methane (mg/l)
38
Figure 5.17. Relationship between carbon dioxide and methane based on data from Hodson et al (in review). The methane described here is aqueous methane expressed as mg/l. Significance was 7.19E-07.
Using the linear regression equation 𝑦 = 𝑎 + 𝑏𝑥 and the coefficients of the intercept, carbon dioxide, and deuterium, the following equation was created as a predictive model for methane concentration based on levels of deuterium and carbon dioxide. The expression 𝑦𝐶𝐻4 is the
concentration of dissolved methane in water in mg/l. The variable 𝑥𝐶𝑂2 is the concentration of dissolved carbon dioxide in water in mg/l, and 𝑥𝐷 is a percentage of deuterium compared to VSMOW (Vienna Standard Mean Ocean Water).
𝑦𝐶𝐻4= 195.1 + 0.019𝑥𝐶𝑂2+ 1.758𝑥𝐷 y = 15.959x + 35.698 R² = 0.6636 0.00 100.00 200.00 300.00 400.00 500.00 600.00 700.00 800.00 900.00 1000.00 0.00 5.00 10.00 15.00 20.00 25.00 30.00 35.00 40.00 45.00 Carb o n Dio xid e (mg /l) Methane (mg/l)