A monetary union for the ASEAN?
An empirical assessment
by
Vu Thi Ha Van
Master Dissertation in Economics
Faculdade de Economia, Universidade do Porto
Supervised by:
Prof. João Loureiro
Biographic note
Vu Thi Ha Van was born in Hanoi, Vietnam in 1989. In 2011, she graduated with the bachelor in Banking and Finance at the Foreign Trade University, Hanoi, Vietnam. From October 2010 to December 2012, she worked as a corporate sales in a multinational travel agency. From April 2013 to August 2015, she worked as a business analyst and a coordinator in the project of building the socio-economic analysis and forecast model for the Ministry of Planning and Investment, Vietnam. In September 2015, she has enrolled in the Master in Economics at Faculty of Economics (FEP), University of Porto, Portugal.
Acknowledgments
First of all, I would like to express my sincere and deepest gratitude to my supervisor, Prof. João Loureiro, who gave me the best advice, guidance, feedback as well as criticism during the time I conducted my dissertation. It was my pleasure to have the chance to work with him, learn from his knowledge and receive his great support.
I also would like to send my grateful appreciation to Prof. Manuel M. F. Martins, who spent some of his valuable time in explaining me the methodology for calculating business cycles and in answering my questions.
I would like to give my special thanks to my Professors at the Master in Economics program for the knowledge they shared with me during the last two years.
Finally, I would like to dedicate this work to my family and my friends, who have always been behind me to encourage and support me.
Abstract
The Asian financial crisis in 1997 has brought to the discussion the creation of a regional monetary union for the Association of Southeast Asian Nations (ASEAN). Grounded on the Optimum Currency Areas (OCA) theory, this dissertation assesses whether there is economic support for such a move. The assessment is based on post-crisis data, focusing on a set of essential criteria suggested by the OCA theory, namely, similarity of inflation rates, degree of trade integration and correlation of business cycles. According to the empirical results, it seems that, at the current stage, only Myanmar does not seem to ex-ante obey all the three basic requirements analyzed. Would the creation of a monetary union be based only on the three criteria, there would be no strong reason for the remaining nine ASEAN countries not sharing a common currency.
JEL-codes: E31, E32, F15
Key-words: ASEAN, ASEAN monetary union, Optimum Currency Areas, inflation rates, trade integration, business cycle synchronization
Contents
Biographic note ... i Acknowledgments ... ii Abstract ... iii List of tables ... v List of figures ... viGlossary of Abbreviations ... vii
Chapter 1. Introduction ... 1
Chapter 2. The Optimum Currency Areas: Theory and Applications ... 4
Optimum Currency Areas Theory ... 4
The Euro Area: A living example of a monetary union ... 8
ASEAN monetary union: A review of the literature ... 10
Chapter 3. A brief overview of ASEAN ... 13
Chronology of ASEAN economic integration ... 13
Some key indicators of ASEAN countries ... 14
3.2.1 Population ... 14
3.2.2 GDP ... 16
3.2.3 GDP per capita ... 18
Exchange rate arrangements of ASEAN countries ... 20
The recent exchange rate behavior of ASEAN currencies ... 24
Chapter 4. An ASEAN monetary union? Empirical evaluation ... 28
Inflation ... 28
Trade integration ... 32
Business cycles synchronization ... 36
Chapter 5. Conclusions ... 42
List of tables
Table 3.1 - Population of ASEAN countries ... 15
Table 3.2 - GDP of ASEAN countries in 2015 ... 16
Table 3.3- GDP of ASEAN countries in 1999, 2007 and 2015 ... 17
Table 3.4 - GDP per capita of ASEAN countries in 2015 ... 18
Table 3.5 - GDP per capita of ASEAN countries in 1999, 2007 and 2015 ... 20
Table 3.6 - Nominal effective exchange rates against ASEAN partners (2010=100) .... 25
Table 3.7 - Real effective exchange rates against ASEAN partners (2010=100) ... 26
Table 4.1 - Inflation rates in ASEAN countries, 2000-2015 ... 29
Table 4.2 - Average and standard deviation of inflation rates, 2011 – 2015 ... 31
Table 4.3 - International trade in goods, 2003-2015 ... 33
Table 4.4 - Correlation of business cycles between ASEAN nations, 1998-2015 ... 38
Table 4.5 - Correlation of business cycles with ASEAN, 1998-2015 ... 39
List of figures
Figure 3.1 - Population of ASEAN countries ... 14
Figure 3.2 - GDP of ASEAN countries in 1999, 2007 and 2015 ... 17
Figure 3.3 - GDP per capita of ASEAN countries in 1999, 2007 and 2015... 19
Figure 4.1 - Inflation rates in ASEAN countries, 2000-2015 ... 30
Glossary of Abbreviations
AEC - ASEAN Economic Community AFTA - ASEAN Free Trade Union
ASEAN - Association of Southeast Asian Nations CEPTS - Common Effective Preferential Tariff Scheme OCA - Optimum Currency Areas
EMU - European Monetary Union (or, Euro Area) EU - European Union
NEER - Nominal effective exchange rates NTMs - Non-tariff measures
Chapter 1.
Introduction
Founded in 1967, the Association of Southeast Asian Nations (ASEAN) is currently one of the largest economic zones in the world, having an important role in global international trade. As of 2017, ASEAN has 10 official member states, namely, Brunei Darussalam, Cambodia, Indonesia, Lao PDR, Malaysia, Myanmar, the Philippines, Singapore, Thailand and Vietnam. According to 2015 statistics for the world, ASEAN is ranked as the sixth largest economy as measured by the Gross Domestic Product (GDP), having the third largest population, and the fourth largest international trade.1
In the early years of the Association, ASEAN was aimed to ensure security and political stability in the region. From the late 1970s onwards, ASEAN countries changed their attention to closer economic cooperation. The creation of the ASEAN Free Trade Union (AFTA) in 1992 shows the determination of ASEAN countries to increase regional economic integration. Later on, in 2007, the members of ASEAN signed the Declaration
on the ASEAN Economic Community Blueprint which, ultimately, led to the establishment
of the ASEAN Economic Community (AEC) in 2015. The AEC aims at building an ASEAN single market and production base (through free flow of goods, services, investment, skilled labor and freer flow of capital), a highly competitive region, with equitable economic development, and fully integrated into the global economy (ASEAN Secretariat, 2015).
The financial crisis that hit East Asian in 1997 was an ignition for discussing greater monetary and exchange rate cooperation among ASEAN countries. The crisis started in Thailand when the Thai baht was hit by speculative attacks, forcing local authorities to give up the exchange rate peg against the US dollar and devalue. Then, the crisis spread over Asia, forcing other ASEAN countries, such as Indonesia, to abandon their exchange rate regimes and letting their currencies float.
The 1997 crisis revealed that, acting individually, most of the ASEAN countries were vulnerable to speculation. One way to overcome such weakness could be a regional
1 In 2015, the GDP of ASEAN was USD 2.4 trillion, accounting for a 3.3% share of world GDP. ASEAN’s population was 629 million persons and its total trade amounted to USD 2.3 trillion, accounting for 7.6% share of the world’s total trade (ASEAN Secretariat, 2016).
currency arrangement able to rebuild a stable ASEAN exchange rate environment while providing members with flexibility against major international currencies, namely the US dollar, the euro, and the yen (Bayoumi and Mauro, 2001). It is not thus surprising that the demand for greater economic integration and better monetary co-operation since the aftermath of the Asian financial crisis has brought to the discussion the creation of a monetary union in the region. A monetary union could promote trade by eliminating transaction costs and enhance the allocative efficiency of the price mechanism, by reducing exchange rate uncertainty (De Grauwe, 1993).
The theoretical support for establishing a monetary union is the theory of Optimum Currency Areas (OCA). Under the traditional OCA theory, there are several prerequisites that need to be fulfilled before establishing a monetary union, such as: price and wage flexibility, labor mobility, financial market integration, fiscal and political integration, a high degree of trade openness, similarity of inflation rates, and synchronization of business cycles. More recent approaches consider the hypothesis of endogeneity (e.g., Frankel and Rose, 1997). According to this hypothesis, a set of countries that do not fulfill the relevant OCA criteria before joining a monetary union may fulfill them ex-post, just as a result of participation in the union.
Published research supporting (or not) the creation of an ASEAN monetary union is scarce. Furthermore, the available research mainly focuses on a narrow set of ASEAN members as in the case of Ng (2002), Ramayandi (2005), and Cortinhas (2007). The likely explanation for the existing studies to consider a monetary union only for a subset of countries is the heterogeneity that can be found in the ASEAN group. The potential candidates to a monetary union analyzed in the mentioned studies are the founding members of ASEAN, that happen to be the most developed countries and that did not belong to the former “Communist bloc”.
This dissertation tries to fill the gap in the existing literature on the feasibility of an ASEAN monetary union, particularly in two aspects. Firstly, it examines the whole set of ASEAN countries (i.e., the 10 members), taking into account the recent political changes and economic integration in the ASEAN region. Secondly, it uses updated data
(up to 2015), covering the period of rapid social and economic development and growth of the more recent members of ASEAN.2
In order to assess if the creation of an ASEAN monetary union is economically grounded, this dissertation uses a set of criteria suggested by the OCA theory. In particular, the investigation focuses on the historical behavior concerning the similarity of inflation rates, the degree of trade integration and the correlation of business cycles among ASEAN members.
The rest of this document is organized as follows. Chapter 2 provides a brief review of the OCA theory, refers to the European Monetary Union, and overviews the existing literature discussing a monetary union for the ASEAN. For familiarity, chapter 3 presents some key indicators of ASEAN members and also their exchange rate regimes. Chapter 4 contains the empirical analysis that provides (or not) support to establishing a monetary union in the ASEAN region. This chapter describes the data and methodology adopted, and comments the results obtained. Chapter 5 concludes with some remarks and recommendations based on the study.
2 This is the case of Cambodia, Myanmar, Lao and Vietnam (CMLV). According to SCB (2015), “over the
past few years, CMLV has experienced a rapid social and economic development due to numerous factors such as abundant low-cost labor and natural resources, open trade policy, and the strategic position in the center of ASEAN.”
Chapter 2.
The Optimum Currency Areas: Theory and
Applications
Optimum Currency Areas Theory
The term “Optimum Currency Area” (OCA) was first mentioned by Mundell (1961), who considered that a currency area should be “a domain within which exchange
rates are fixed”, with borders not necessarily coinciding with national borders.
More recently, more specific definitions of OCA have been provided. For example, for Mongelli (2002), “an OCA is defined as the optimal geographic domain of
a single currency, or of several currencies, whose exchange rates are irrevocably pegged and might be unified. The single currency, or the pegged currencies, can fluctuate only in unison against the rest of the world. The domain of an OCA is given by the sovereign countries choosing to adopt a single currency or to irrevocably peg their exchange rates.”
The OCA theory has evolved from the pioneering work of Robert Mundell to the current days. Along about half a century of history, different approaches can be found, starting from the so-called traditional OCA theory and developing to the “new” approaches.
The traditional approach mainly emphasized the cost side in a cost-benefit analysis of a monetary union (De Grauwe, 1993). Following this line, various OCA criteria have been suggested. Some of the main OCA criteria in the early stage of the OCA theory include:
1) Prices and wages flexibility
According to Friedman (1953), when prices and wages between and within countries are flexible, the imbalance caused by the shift in demand is less likely to result in unemployment in one country and inflation in another. Suppose that there are two countries having flexible prices and wages. If an adverse demand shock hits country A in favour of country B, in country A there will be a decrease in GDP and an increase in unemployment, while in country B demand increases, causing an inflationary pressure. With flexible wages, they would fall in country A, making the country more competitive relative to country B. As a result, demand in country A would rise while the inflationary pressure in country B would diminish. Therefore, the need for adjusting the exchange rate
decreases, thus reducing the cost of losing the control over the exchange rate instrument. 2) Mobility of production factors
Mundell (1961) argued that the mobility of labor and capital is an essential criterion in forming an OCA. He explained this by considering a mechanism of coping with unemployment and inflation. Suppose that the world consists of two countries which have their own currencies and is divided into two regions which do not correspond to their national borders. If there is a demand shock causing unemployment in region A and inflationary pressure in region B, central banks in both countries in region A would have to expand money supplies to reduce unemployment, while in region B, central banks in both countries would have to reduce money supply to curb the inflation. Thus, unemployment may be decreased in both countries, but in the cost of increasing their inflation. However, if there is a high mobility in production factors across countries, the movement of labor and capital from one place to the other would reduce both unemployment and inflation pressure without using exchange rate adjustments. He concluded that if the world can be split into regions with internal factor mobility and external factor immobility, each region should have their own currency which can fluctuate against other currencies.
3) Correlation of shocks
Another criterion suggested by Mundell (1961) for deciding the set of countries that should join a monetary union is the similarity of shocks: countries having high correlated economic shocks are more recommended to join a monetary union than those facing uncorrelated shocks. The reason is that by joining a monetary union, countries lose control over monetary policy. Therefore, if shocks are idiosyncratic (which means that one - or some - country in the union may face a crisis, while others do not), hurting countries may not use national monetary instruments to adjust their imbalances. Instead, if all countries in the union experience the same shocks, a common monetary policy fits all.
4) Financial market integration
Ingram (1962) argued that financial integration can reduce the necessity for using exchange rate instruments. If the domestic financial markets are highly integrated with capital markets in the region, countries may quickly response to adverse disturbances, through international capital flows (countries with a surplus lend to countries with a
deficit), In highly integrated financial markets, even a small change in interest rates would induce capital mobility across partner nations, creating an equilibrium. These equilibrating flows would reduce the financing of external shocks and improve the efficient allocation of capital. Therefore, under a high degree of financial integration, countries would be able to finance their temporary deficits without any exchange rate adjustments.
5) Degree of economic openness
McKinnon (1963) underlined the degree of openness (which can be defined as the ratio of tradable goods to non-tradable goods) as another crucial criterion for assessing an OCA. He suggests that a high degree of openness leads to more incentive to have a pegged exchange rate or to form a monetary union, because in a very open economy, it is more likely that the international price of tradable goods is transferred to the national cost of living. Under those circumstances, adjusting exchange rates would highly affect wages and prices, making the policy tool less effective. In general, the higher the degree of openness, the lower is the cost of giving up the national currency to join a monetary union. 6) Diversification of production and consumption
Kenen (1969) emphasized the diversification in production and consumption for supporting a monetary union. He suggests that countries with a high degree of diversification in production and consumption are less prone to asymmetric shocks since the corresponding diversification in the trading structure would reduce the impact of shocks on a specific sector. Thus, a country with a highly diversified economy would not be so pressured to adjust exchange rates to cope with disturbances. Such a country would be in a situation to peg the exchange rate and join a monetary union.
7) Fiscal integration
Kenen (1969) stressed the need for a fiscal union, as a condition for having a monetary union. The rationale is that a member of a monetary union that is hit by an idiosyncratic shock needs an instrument that replaces foregone monetary policy instruments. A supranational fiscal policy would, through international transfers, help in recovering from this type of disturbances.
8) Political integration
Some economists (e.g., Mintz, 1970)3 consider political integration a relevant
criterion for deciding the adoption of a single currency. The rationale is that political integration among members of the union promotes conformity to joint commitments, maintains collaboration on different economic policies, and strengthens institutional linkages.
9) Similarity of inflation rates
According to Fleming (1971), similar inflation rates are of utmost importance to maintain a fixed exchange rate system. Thus, participants in a monetary union should have similar preferences concerning price stability.
Under the traditional OCA theory, the set of criteria described above have been taken as pre-requisites that candidates to a monetary union should observe before joining such an arrangement. Under this approach, the decision of joining or not a monetary union is thus based on a backward view of the performance of candidates. More recently, a forward looking view has also emerged, with opposing conclusions. Two good examples of this “new” approach are Frankel and Rose (1997) and Krugman (1993).
Having in mind the case of the European monetary union, Frankel and Rose (1997) have raised the OCA endogeneity hypothesis. Focusing on two of the conventional pre-requisites for participation in a monetary union, namely a high level of trade integration and high correlation of business cycle among members, Frankel and Rose argue that the behavior of the two indicators is endogenous. According to the researchers, by joining a monetary union, a country may improve their trade integration since a reduction in trade costs occurs. Furthermore, closer trade links may lead to more correlated business cycles among members of the union, particularly because intra-industry trade in the union increases and common demand shocks become more relevant. Frankel and Rose thus conclude that “a country is more likely to satisfy the criteria for
entry into a currency union ex-post than ex-ante”.
Besides the endogeneity of trade and business cycles analyzed in Frankel and Rose (1997), further OCA endogeneities have latter on been addressed. For example, in the study by De Grauwe and Mongelli (2005), the potential OCA endogeneities include economic integration, financial integration, symmetry of shocks, and product and labor market flexibility.
Contrasting arguments were raised well before by Krugman (1993). According to the author, the increase of international trade that follows from participation in a monetary union leads member countries to become more specialized in the production of goods and services. If this “specialization hypothesis” applies, participation in a monetary union would not increase business cycles synchronization but, rather, would have an opposite impact.
The issue is, thus, an empirical one, namely the assessment for existing monetary unions whether they (i) have increased trade among members, and (ii) have altered the correlation of business cycles. According to Glick and Rose (2002), “a pair of countries
which joined/left a currency union experienced a near-doubling/halving of bilateral trade.” These conclusions have, meanwhile, been disputed and, in a reassessment, Glick
and Rose (2015) came to the conclusion that estimations of the effect of currency union on trade are sensitive to the used methodology.
The Euro Area: A living example of a monetary union
Around the world, one can find both formal and informal monetary unions, being the Euro Area the most well-known and the largest one. Members of the European monetary union share a common currency, the euro, which currently is the official currency in 19 out of the 28 European Union countries, being used by 338.6 million people in their daily lives.4;5The euro was introduced in 1999, first as a virtual currency for non-cash payments and accounting purposes, and since 2002 also in the form of cash (banknotes and coins).
Since its launching, the euro has become the second most important currency in the world after the US dollar (European Commission, 2014). According to the Treaty of the European Union, all members of the European Union will eventually join the monetary union and replace their currencies by the euro.
4 Actually, the number of euro users is ampler, since the euro is also officially used by some States that, although not belonging to the European Union, have made agreements with the European authorities for using the euro (e.g., Andorra, San Marino, Vatican, and Monaco). For details on the use of the euro, see http://europa.eu/european-union/about-eu/money/euro_en
5 Information cited from: European Union (2016), The Euro. Available at: http://europa.eu/european-union/about-eu/money/euro_en.
In order to become a member of the Euro Area, a member of the European Union has to fulfill a set of pre-requisites. This is in line with the traditional OCA theory, as referred above. The criteria that have to be observed ex-ante are the following:
- Inflation: the rates of inflation of the candidate country have to be aligned with the lower inflation rates observed in the monetary union.
- Interest rates: rates on 10-year government bonds have to be close to the lower rates observed in countries participating in the monetary union.
- Government budget: the candidate country cannot observe a government deficit that exceeds 3 percent of the GDP.
- Public debt: the candidate should have a public debt below 60 percent of its GDP; in case of being higher, it must show a trend converging to the reference value.
- Exchange rates: the exchange rate of the candidate’s currency has to show stability against the euro for, at least, the last two years.
This set of conditions became known as the “convergence criteria” of the European monetary union.
In 1999 the Euro Area was launched with 11 countries (Austria, Belgium, Finland, France, Germany, Ireland, Italy, Luxembourg, Netherlands, Portugal, and Spain). In 2001, Greece also became a member. The next enlargement took place in 2007 when Slovenia joined the Euro Area. Later, between 2008 and 2015, six countries were qualified to accede the Euro Area, including Cyprus and Malta in 2008, Slovakia in 2009, Estonia in 2011, Latvia in 2014, and Lithuania in 2015.
Whether the Euro Area is, or is not, an OCA is a question that the empirical literature has extensively dealt with. An example of ex-ante assessment is, among others, Bayoumi and Eichengreen (1996).6 Based on the actual working of the Euro Area, many other studies have also assessed Euro Area optimality. One example is Wortmann and Stahl (2016).7 In general, the conclusion drawn from these empirical studies is that not all the countries in the European Union and/or in the Euro Area form an OCA.
6 Bayoumi and Eichengreen (1996) examined countries’ readiness for EMU. They suggested that European countries were divided into three groups: those with a high level of readiness (Austria, Belgium, the Netherlands, Ireland and Switzerland), those with a tendency to converge (Sweden, Italy, Greece, Portugal and Spain), and those with little or no convergence (UK, Denmark, Finland, Norway and France). 7 Wortmann and Stahl (2016) proposed an assessment of core-periphery structures within the European Union. According to their study, “countries such as the United Kingdom, Denmark, and Sweden would also
Since the eruption of the global financial crisis of 2008, which was followed by an economic crisis and by public debt crises in some countries, the Euro Area has been in trouble. The events observed in recent years have revealed weaknesses in the institutional arrangements and in the economic governance framework of the European monetary union. This led to a number of reforms, such that the improvement in the functioning of the Euro Area is still a process in course.
The experience of the Euro Area is, no doubt, a case from which a lot can be learned by any set of countries, in any part of the world, intending to share a common currency.
ASEAN monetary union: A review of the literature
The literature on the creation of an ASEAN monetary union is relatively scarce. The existing work typically consists of ex-ante assessments on the optimality of an ASEAN monetary union, using for that purpose the conventional OCA criteria. Most of the papers only focus on a subset of ASEAN countries, namely the founding members, which happen to be the most developed ones. This is the case in Ng (2002), Ramayandi (2005), Cortinhas (2007), and Tawadros (2008). In general, the existing literature provides partial support for a monetary union in ASEAN. In what follows, the relevant papers are reviewed.
Bayoumi and Mauro (2001) analyzed the costs, benefits, preconditions, and implications of forming an ASEAN regional currency union using data from 1988 to 1997. Regarding intra-regional trade, macroeconomic stability and level of economic development, the conclusion is that ASEAN countries appeared to be less suitable for adopting a single currency than European Union nations before signing the Maastricht Treaty (the European treaty that has created the Euro Area). Further, the authors stressed the need for a lasting and firm political commitment among ASEAN members as a condition to tackle difficult policy decisions such as maintaining central bank independence, obeying fiscal and exchange rate arrangements, and complying with supranational directives.
fit well within such a hypothetical euro area. However, Greece, Ireland, Italy, Portugal, and Spain plus Cyprus and Croatia on the southern periphery, as well as most of the countries of the eastern enlargement are found to form very distinct clusters in terms of competitiveness, indebtedness, and economic performance.”
Ng (2002) evaluated the support for five members of ASEAN (Indonesia, Malaysia, the Philippines, Singapore, and Thailand) forming a currency union. For that purpose, the criteria used were the correlation of shocks, intra-regional trade, and consensus on monetary policy. The conclusions are (i) regarding the correlation of shocks, the five ASEAN countries were suitable for forming a monetary union; in particular, the shocks of Indonesia, Singapore, and Malaysia were found highly correlated. Moreover, the five members of the Association exhibit stronger correlated shocks, as compared with European Union countries; (ii) regarding trade, the analyzed ASEAN countries had large tradable sectors, which supported a shift to a common currency. However, the share of intra-regional trade among them was lower than that of European Union members; (iii) regarding an agreement on monetary policy, the study underlined some diversity in inflation and interest rate policies of ASEAN members. While Malaysia and Singapore have pursued relatively low inflation and interest rates, other ASEAN countries have maintained higher inflation and interest rates.
Ramayandi (2005) also examined the feasibility of a monetary union for the five ASEAN countries above mentioned. Regarding the trade pattern and the symmetry of economic shocks, the conclusion is that the five countries would potentially obtain considerable benefits from a cooperative monetary policy or even a single currency. However, the dispersion in the level of economic development was considered a potential obstacle. The details of the institutional arrangement were considered an open issue, deserving a deeper analysis.
Using data for the period 1962-1996, Cortinhas (2007) examined whether the observed large increase in intra-regional trade between the five mentioned ASEAN countries has contributed to closer economic integration and, thus, helped in satisfying the prerequisites for a currency union. The conclusion is that the increase of intra-industry trade amongst all members but Indonesia has increased business cycle synchronization. This is a relevant conclusion since when intra-industry trade is dominant, the costs of forming a currency union decrease.
Bacha (2008) analyzed the common linkages of a wide set of countries that included the ASEAN members, plus China, Japan, Korea, Australia and New Zealand. The purpose of the study was to identify the sub-set of countries recommended to share a common currency. The assessment was made with data for the period 1970-2003, using
three key criteria, namely, business cycle synchronization, similarity of inflation rates and policy congruence. The results suggest that there were no broad-based common linkages. However, several pairs of countries were found to be promising candidates such as Malaysia/Singapore, Japan/Korea, Indonesia/Thailand and Australia/New Zealand. The author considered that, by the time of the study, it would not be recommended to form a region-wide common currency area, but there was support for forming paired clusters, that could eventually lead to an enlarged currency union.
Tawadros (2008) tested whether observed increase in trade flows led to more synchronized business cycles. The analysis focused on seven ASEAN members (Brunei Darussalam, Indonesia, Malaysia, Myanmar, the Philippines, Singapore, and Thailand), using data from 1960 to 2004. The author found that the relationship between the level of trade intensity and the degree of business cycle synchronization was almost non-existent. Despite the fact that greater trade flows between the analyzed countries caused business cycles to be less divergent, the conclusion is that a sufficient synchronization was not reached yet to allow for the creation of a monetary union.
Chapter 3.
A brief overview of ASEAN
Chronology of ASEAN economic integration
The ASEAN was founded in 1967 with five members, namely Indonesia, Malaysia, the Philippines, Singapore, and Thailand. Later on, the Association was enlarged by Brunei Darussalam in 1984, Vietnam in 1995, Lao PDR and Myanmar in 1997, and Cambodia in 1999. Currently, the ASEAN is composed of 10 member states.
In the beginning, ASEAN was established with the main purpose of ensuring security and political stability as well as preventing the dissemination of communist ideology (Eccleston et al., 1998). From the 1990s onwards, ASEAN countries changed their attention to closer economic cooperation. The Framework Agreement on Enhancing
ASEAN Economic Cooperation, signed in 1992 in Singapore, marked the beginning of
the economic integration process in the region. The main objective of the Agreement was to improve intra-regional economic co-operation to foster economic growth and development of all ASEAN members. The 1992 Agreement stressed the role of cooperation in trade, in industry, minerals and energy, in finance and banking, in food, agriculture, and forestry, and in transport and communications. The Framework
Agreement was the cornerstone of two crucial agreements for the effective improvement
of intra-regional: (i) the Agreement on the Common Effective Preferential Tariff Scheme (CEPTS) for the ASEAN Free Trade Area (AFTA), signed in 1993 (then replaced by the
ASEAN Trade in Goods Agreement in 2010); and (ii) the ASEAN Framework Agreement on Services signed in 1995.
In 2003, it was first announced the establishment of an ASEAN Economic
Community (AEC) with “the agreed goal of regional economic integration”. Later, in
2007, the AEC Blueprint 2015 was signed, setting out the goals to build: “(a) a single market and production base, (b) a highly competitive economic region, (c) a region of equitable economic development, and (d) a region fully integrated into the global economy”.
In 2015, the AEC was officially launched, marking an important milestone in the regional economic integration process (ASEAN Secretariat, 2015).At the same time, the
AEC Blueprint 2025 was adopted, providing guidelines for the AEC from 2016 to 2025.
innovative and dynamic; with enhanced connectivity and sectoral cooperation; and a more resilient, inclusive, and people-oriented, people-centered community, integrated with the global economy”.8
Despite the several commitments among ASEAN countries toward economic integration in ASEAN region, the idea of having a common currency has not yet been formally discussed by ASEAN leaders.
Some key indicators of ASEAN countries
3.2.1 Population
The ASEAN is quite heterogeneous in what concerns the size of the members, as measured by different indicators. This can be seen in Figure 3.1 for population. The Figure displays information for three milestone years: (i) 1999, when the last enlargement of ASEAN occurred; (ii) 2007, the year the AEC Blueprint was agreed; and (iii) 2015, the year the AEC entered into force.
Figure 3.1 - Population of ASEAN countries
Source: The World Bank (accessed in March 2017),available at
http://databank.worldbank.org/data/reports.aspx?source=world-development-indicators&preview=on#
Figure 3.1 shows that the ASEAN is composed by “big” countries (e.g., Indonesia) and by “small” countries” (e.g., Brunei Darussalam). To overcome the scale problem of the Figure, Table 3.1 also provides the dimension of the populations of ASEAN members.
Table 3.1 - Population of ASEAN countries
Countries 1999 2007 2015 % 1999-2015 Brunei Darussalam 323,812 374,459 423,188 30.7 Cambodia 11,928,306 13,728,700 15,577,899 30.6 Indonesia 208,644,079 232,296,830 257,563,815 23.4 Lao PDR 5,256,207 5,939,634 6,802,023 29.4 Malaysia 22,898,579 26,730,607 30,331,007 32.5 Myanmar 47,106,923 50,698,814 53,897,154 14.4 Philippines 76,285,225 88,965,508 100,699,395 32.0 Singapore 3,958,723 4,588,599 5,535,002 39.8 Thailand 61,973,957 66,353,572 67,959,359 9.7 Vietnam 76,596,700 84,218,500 91,713,300 19.7 ASEAN 514,972,511 573,895,223 630,502,142 22.4
Source: The same as in Figure 3.1.
Between 1999 and 2015, the whole ASEAN population grew by 22.4%. Among ASEAN countries, Indonesia has the largest population and ranks 4th in the world, after China, India and the United States. The Philippines and Vietnam have the second and third largest populations among ASEAN members, ranking 12th and 14th in the world,
respectively. On the contrary, Brunei Darussalam, Singapore and Lao PDR have the smallest populations among ASEAN members. The Brunei’s population represents only 0.15% of Indonesia’s population, while the populations of Singapore and Lao PDR are slightly higher, corresponding to less than 3% of Indonesia’s population.
In 2015, with a total number of over 630 million people, ASEAN population was the 3rd largest in the world, after China and India. Furthermore, more than half of ASEAN’s residents were young (below the age of 30), comprising a big portion of the workforce (ASEAN Secretariat, 2015).
3.2.2 GDP
The relative size of the ASEAN countries, as measured by the GDP in 2015 at current USD prices, is provided in Table 3.2. Overall, it is clear that ASEAN members contributed differently to the total regional GDP. In 2015, the five founding members contributed to 90% of the whole ASEAN’s GDP, whereas the remaining five countries accounted only for 10%. Like for population, Indonesia is the biggest country of ASEAN when GDP is the reference indicator. In 2015, Indonesia represented over 35% of the region’s output. This figure is more than the double of Thailand’s GDP, the second largest country, and more than 70 times the GDP of Lao PDR, the country having the smallest GDP in the Association.
Table 3.2 - GDP of ASEAN countries in 2015
Countries USD 106 % Brunei Darussalam 12,930.4 0.5 Cambodia 18,050.0 0.7 Indonesia 861,934.0 35.4 Lao PDR 12,369.1 0.5 Malaysia 296,283.2 12.2 Myanmar 62,600.9 2.6 Philippines 292,451.4 12.0 Singapore 292,739.3 12.0 Thailand 395,168.0 16.2 Vietnam 193,599.4 7.9 ASEAN 2,438,125.6 100.0
Source: The World Bank (accessed in March 2017):
http://databank.worldbank.org/data/reports.aspx?source=world-development-indicators&preview=on#
In recent past, the economies of ASEAN show remarkable growth. Such performance can be observed in Figure 3.2, which displays total GDP for the reference years 1999, 2007, and 2015 at constant 2010 prices. The data used as input in the Figure is also described in Table 3.3, which further provides the percentage increases in GDP between 1999 and 2015.
Figure 3.2 - GDP of ASEAN countries in 1999, 2007 and 2015 (USD 106, constant 2010 prices)
Source: The World Bank (accessed in March 2017)
http://databank.worldbank.org/data/reports.aspx?source=world-development-indicators&preview=on#
Table 3.3 - GDP of ASEAN countries in 1999, 2007 and 2015 (USD 106, constant 2010 prices; %)
Countries 1999 2007 2015 %1999-2015 Brunei Darussalam 11,639.5 13,869.1 13,637.7 17.2 Cambodia 4,787.6 9,935.6 15,903.6 232.2 Indonesia 432,151.5 640,863.5 987,514.1 128.5 Lao PDR 3,385.8 5,666.1 10,415.4 207.6 Malaysia 149,295.9 236,695.4 329,952.5 121.0 Myanmar 14,053.0 37,073.0 70,537.7 401.9 Philippines 120,052.4 176,022.6 265,833.2 121.4 Singapore 123,502.7 202,775.9 287,018.0 132.4 Thailand 208,427.7 314,057.5 392,474.6 88.3 Vietnam 57,259.9 97,817.4 154,508.6 169.8 ASEAN 1,124,556.1 1,734,776.0 2,527,795.4 124.8
Source: The same as in Figure 3.2
As can be seen from Figure 3.2 and Table 3.3, real GDP of ASEAN countries have grown significantly in the first years of the current century. As of 2015, total GDP of ASEAN had increased 124.8% as compared to 1999 (when the tenth member joined
0 100,000 200,000 300,000 400,000 500,000 600,000 700,000 800,000 900,000 Brunei Darussalam Cambodia Indonesia Lao PDR Malaysia Myanmar Philippines Singapore Thailand Vietnam 1999 2007 2015
ASEAN) and 45.7% as compared to 2007 (when the AEC Blueprint entered into force).Looking at the individual economies, between 1999 and 2015, nine out of ten ASEAN nations experienced high and stable growth rate. In general, the smaller economies, namely Cambodia, Lao PDR and Myanmar had higher growth rates than the other countries in the region. During this period, only Brunei Darussalam did not witness a permanent growth trend. Real GDP of Brunei Darussalam rose from 11,639 USD in 1999 to 13,869 USD in 2007, then declined slightly to 13,637 in 2015. Overall, between 1999 and 2015, Brunei Darussalam experienced modest real output growth of only 17.2%, a remarkable low figure when compared with the performance of the partners.
3.2.3 GDP per capita
Combining the data from the two previous sub-sections, in what follows information on GDP per capita is provided. Table 3.4 describes the GDP per capita of ASEAN members in 2015, using current USD prices. It also informs how the GDP per capita of each member compares with ASEAN’s GDP per capita. Figure 3.3 contains information on GDP per capita in the reference years of 1999, 2007, and 2015, using 2010 USD constant prices. The data from the Figure is also described in Table 3.5. The Table further informs about the increase in real GDP per capita between 1999 and 2015.
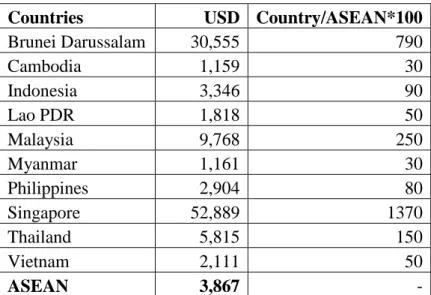
Table 3.4 - GDP per capita of ASEAN countries in 2015
Countries USD Country/ASEAN*100
Brunei Darussalam 30,555 790 Cambodia 1,159 30 Indonesia 3,346 90 Lao PDR 1,818 50 Malaysia 9,768 250 Myanmar 1,161 30 Philippines 2,904 80 Singapore 52,889 1370 Thailand 5,815 150 Vietnam 2,111 50 ASEAN 3,867 -
Source: The World Bank (accessed in March 2017)
As can be seen from Table 3.4, in 2015, four countries had GDP per capita higher than that of the region, namely Brunei Darussalam, Malaysia, Singapore and Thailand. It is clear that Singapore is far ahead of the nine remaining ASEAN countries. In 2015, GDP per capita of Singapore was 52,889 USD, ranking 10th in the world. Brunei Darussalam, the country having the smallest population in the region is also one of the wealthiest country in the world. Its GDP is mostly contributed by exporting crude oil and natural gas. In 2015, GDP per capita of Singapore and Brunei Darussalam was, respectively, almost six times and three times higher than that of Malaysia, the country having the third highest GDP per capita in the region.. On the other hand, GDP per capita of Singapore in 2015 was fifty times higher than that of Cambodia and Myanmar, the countries having the lowest GDP per capita in the region.
To better understand the recent path of real GDP per capita of each ASEAN country, Figure 3.3 presents the information for the three milestones years (1999, 2007 and 2015).
Figure 3.3 - GDP per capita of ASEAN countries in 1999, 2007 and 2015 (USD, 2010 constant prices)
Source: The World Bank (accessed in March 2017)
http://databank.worldbank.org/data/reports.aspx?source=world-development-indicators&preview=on# 0 10,000 20,000 30,000 40,000 50,000 60,000 Brunei Darussalam Cambodia Indonesia Lao PDR Malaysia Myanmar Philippines Singapore Thailand Vietnam 1999 2007 2015
The data used as input in the Figure 3.3 is also described in Table 3.5, which further provides information on the percentage increase of real GDP per capita between 1999 and 2015.
Table 3.5 - GDP per capita of ASEAN countries in 1999, 2007 and 2015 (USD, 2010 constant prices; %)
Countries 1999 2007 2015 %1999-2015 Brunei Darussalam 35,945 37,038 32,226 -10.3 Cambodia 401 724 1,021 154.4 Indonesia 2,071 2,759 3,834 85.1 Lao PDR 644 954 1,531 137.7 Malaysia 6,520 8,855 10,878 66.8 Myanmar 298 731 1,309 338.7 Philippines 1,574 1,979 2,640 67.7 Singapore 31,198 44,191 51,855 66.2 Thailand 3,363 4,733 5,775 71.7 Vietnam 748 1,161 1,685 125.4 ASEAN 2,183.7 3,022.8 4,009.2 83.6
Source: the same as in Figure 3.3.
Overall, it can be seen that, between 1999 and 2015, there was a remarkable increase in real GDP per capita of ASEAN countries. The real GDP per capita of ASEAN has almost doubled. Myanmar, the country with the lowest GDP per capita in the region in 1999, had the highest growth rate, growing by more than 300%. Following Myanmar, the less-developed countries in ASEAN, namely Cambodia, Lao PDR and Vietnam also achieved high growth rates of real GDP per capita, with increases in the period that amount to 154.4%, 137.7%, and 125.4%, respectively. In contrast, among the ASEAN members, in the period, only Brunei Darussalam experienced a negative growth rate of real GDP per capita. In 1999, Brunei Darussalam had the highest real GDP per capita in ASEAN. However, in 2015, the real GDP per capita in Brunei Darussalam was behind Singapore.
Exchange rate arrangements of ASEAN countries
If the ASEAN countries decide to create a monetary union, they actually decide to move to an irrevocable internal pegged exchange rate system. An additional required
decision is the exchange rate system of the common currency against non-member countries.
In order to better understand how a single currency would change the exchange rate policy of the participants in an ASEAN monetary union, in what follows the current exchange rate regime of each country is briefly described.
Brunei Darussalam
The official currency of Brunei Darussalam is the Brunei Dollar (BND), which started being in use in 1967. Since the adoption of the BND, Brunei Darussalam has a currency board arrangement with Singapore, which is still in effect until today. This agreement gives permission for the BND and the Singapore dollar being exchanged at a 1:1 ratio, which aims at promoting bilateral trade between the two countries.9
Cambodia
The official currency of Cambodia is the Cambodia Riel (KHR). The Riel currently in use was first introduced in 1980. The Cambodia Authority has maintained a market-oriented exchange rate policy, which targets to pursue price stability. Following the managed floating arrangement, the National Bank of Cambodia may intervene in the foreign exchange rate market, being the US dollar the relevant reference currency.10
Indonesia
The official currency of Indonesia is the Indonesian Rupiah (IDR), introduced in 1946. From 1971 to 1978, Indonesia maintained a fixed exchange rate against the US dollar (415 IDR per USD). In 1978, following a sharp decrease in oil prices and foreign exchange reserves, there was a significant devaluation of the Rupiah, which led to a shift from the fixed exchange rate regime to a managed floating. The Indonesian authorities maintained the managed floating regime until 1997, when the Asian financial crisis broke out. Bank Indonesia made an effort to cope with high inflation but eventually had to replace the managed floating exchange rate system by free floating. This new regime started in August 1997 (Frederick et al., 2011). In 2005, Bank Indonesia adopted an
9Source: Autoriti Monetari Brunei Darussalam (http://ambd.gov.bn). 10 Source: National Bank of Cambodia (https://www.nbc.org.kh).
inflation targeting strategy for monetary policy, while keeping the free-floating exchange rate regime. However, Bank Indonesia has the right to take some actions to avoid excessive exchange rate fluctuations.11
Lao PDR
The official currency of Lao PDR is the Lao Kip (LAK). The Kip currently in use was introduced in 1979. From 1979 to 1988, to manage inflation, Lao PDR authorities adopted a system of multiple official exchange rates, through which the rates applied were depending on the type of international transaction. In September 1987, there was a 900 percent devaluation of the LAK against the US dollar for commercial purposes, and the multiple exchange rates system was replaced by a single floating exchange rate system applied to all transactions (Savada and Whitaker, 1995). Nowadays, the exchange rate is determined by the market and officially adjusted, based on the daily average trading rate of the inter-bank market (where the participants are commercial banks and foreign exchange bureaus). In some circumstances, the Bank of Lao PDR can decide the exchange rate on its own for the commercial banks and foreign exchange bureaus.12
Malaysia
In 1967, the Bank Negara Malaysia first issued the Malaysian dollar. In August 1975, the Malaysian dollar was replaced by the Malaysian Ringgit (MYR), which has been the official currency of Malaysia until now. From 1975 to 1998, Malaysia adopted a floating exchange rate system, based on a basket of foreign currencies issued by the main trading partners. In September 1998, to protect the economy from the negative impact of the 1997 financial crisis, the Malaysian authorities decided to peg the Ringgit to the US dollar at the rate of 3.8 MYR per USD. In July 2005, Malaysia replaced the fixed exchange rate system with a managed float system. The exchange rate of the Ringgit against other currencies is determined by market forces. The Malaysian central bank only intervenes in case of excess volatility.13
11 Source: Bank Indonesia (http://www.bi.go.id).
12 Presidential Decree Law No. 01/OP dated August 9, 2002, Governing the Management of Foreign
Exchange and Precious Metals. Available at:
http://www.bol.gov.la/english/Decree%20law%20on%20management%20of%20FC%20%20PM2.html 13 Source: Bank Negara Malaysia (http://www.bnm.gov.my).
Myanmar
The official currency of Myanmar is the Myanmar Kyat (MMK), being in circulation since 1952. From 1974 to March 2012, the Government adopted a fixed exchange rate regime. The MMK was pegged to the Special Drawing Rights (SDR) at the rate of 8.5 MMK per SDR and this official rate was only applied to the public sector. In 1989, foreign trade in Myanmar has been legalized for the private sector, but no official market for the private sector was available to convert currencies. Therefore, for more than 20 years, the informal/parallel market was the only place for the private firms to exchange currencies (Bangkok Research Center, 2014). In April 2012, Myanmar replaced the pegged exchange rate system with a managed floating system. Immediately after implementing the new exchange rate regime, the exchange rate of MMK against USD jumped from around 6 MMK per USD to circa 820 MMK per USD. Since then, the Kyat has been continuously depreciating against the USD. Recently, the observed exchange rate was of about 1,300 MMK per USD.14
Philippines
The official currency of the Philippines is the Philippine Peso (PHP), which was introduced in 1949. Before 1997, the Philippines adopted a managed floating exchange rate system. The relevant exchange rate for the authorities was an effective rate composed by a basket of foreign currencies, where the USD had the highest weight (Walker, 1999). However, following the Asian financial crisis of 1997, the Philippines had to let the Peso fluctuate freely. At present, the Philippines have a freely floating exchange rate regime, under an inflation target framework for monetary policy. Although exchange rates are normally determined by market forces. The central bank of the Philippines intervenes in case of sharp fluctuations in the exchange rate.15
Singapore
The official currency of Singapore is the Singapore dollar (SGD), being in circulation since 1967. In the beginning, the SGD was pegged to the British pound. This system lasted until 1973 when the authorities of Singapore decided to replace it by a peg
14Source: Myanmar Legal (http://www.myanmarlegalservices.com) 15 Source: Bangko Sentral ng Pilipinas (http://www.bsp.gov.ph).
to “a fixed and undisclosed trade-weighted basket of currencies”. From 1985 onwards, the SGD is allowed to fluctuate within an undisclosed bandwidth, closely supervised by the Monetary Authority of Singapore (Mele, 2015). The main task of the monetary authorities is the management of the exchange rate with the ultimate goal of ensuring price stability.16
Thailand
The official currency of Thailand is the Thai baht (THB). It has been officially used as national currency since 1897. From 1990 to 1997, Thailand maintained a peg against the US dollar at a rate of 26 THB per USD (Walker, 1999). Following the 1997 Asian financial crisis, Thailand had to give up the peg to the USD and adopted a managed float exchange rate system. This new managed float system is still in effect. Under this system, the exchange rate of the THB is determined by the market, and the Bank of Thailand intervenes in case of excess volatility.17
Vietnam
The official currency of Vietnam is the Vietnamese dong (VND). The dong currently in use was introduced in 1986. In the past, Vietnam maintained a crawling peg with the USD, and the exchange rate was only allowed to fluctuate within a band. Recently, the State Bank of Vietnam decided to shift to a more flexible exchange rate system. 18 According to IMF (2016), currently the exchange rate regime of Vietnam is classified as stabilized arrangement. Vietnam maintains an exchange rate anchor to a composition of an undisclosed basket of currencies.
The recent exchange rate behavior of ASEAN currencies
In case ASEAN countries decide to form a monetary union, nominal exchange rates will become irrevocably pegged among the participants. Concerning real exchange rates, their stability will depend upon differentials in inflation rates. In order to understand how the exchange rates of each ASEAN country have behaved in recent years relative to
16 Source: Monetary Authority of Singapore (http://www.mas.gov.sg). 17 Source: Bank of Thailand (https://www.bot.or.th).
the currencies of the partners, in what follows information on effective rates is provided. The information concerns both nominal and real effective exchange rates of each currency/country vis-à-vis the remaining 9 currencies/countries of ASEAN. The rates for the period 2010-2015 are computed as follows:
(i) Nominal effective exchange rates (NEER): 1st, through the USD cross rates,19 bilateral rates of ASEAN members are obtained; 2nd, bilateral rates are transformed into indexes; 3rd, the bilateral indexes for each country are weighted, based on the relative importance of international trade in goods (imports plus exports of goods) of each ASEAN member.20
(ii) Real effective exchange rates (REER): 1st, based on annual inflation rates,21 a consumer price index (CPI) for each country is constructed; 2nd, the CPI of the trading partners are obtained with the international trade weights used to compute nominal effective exchange rates; 3rd, the real effective rates of a
given country are obtained by combining the country’s CPI, the weighted foreign CPI and the nominal effective exchange rates.
Table 3.6 below provides the NEER of each ASEAN country against its ASEAN partners. The rates are annual averages, for the period 2010-2015. By construction, an increase in the NEER means that the currency of the corresponding country is depreciating against the currencies of the remaining 9 partners.
Table 3.6 - Nominal effective exchange rates against ASEAN partners (2010=100)
Country 2010 2011 2012 2013 2014 2015 Brunei Darussalam 100.0 96.7 94.0 92.1 89.7 89.4 Cambodia 100.0 98.3 96.7 96.5 94.4 86.6 Indonesia 100.0 102.2 108.2 119.8 132.4 135.8 Lao PDR 100.0 99.6 96.3 96.1 93.5 89.9 Malaysia 100.0 100.1 99.1 99.5 99.9 110.4 Myanmar 100.0 105.5 10,292.9 15,079.5 15,296.6 16,760.9
19USD bilateral rates (period average) were collected fromThe World Bank (accessed in March 2017),
available at: http://databank.worldbank.org/data/reports.aspx?source=world-development-indicators# 20 Due to the lack of information for bilateral trade in services, the analysis only uses data on international trade of goods.
21 Inflation rates were collected from The World Bank (accessed in March 2017), available at:
Country 2010 2011 2012 2013 2014 2015 Philippines 100.0 101.0 96.9 95.7 96.0 89.7 Singapore 100.0 95.8 92.2 88.4 84.3 81.3 Thailand 100.0 100.1 94.7 89.3 90.5 90.6 Vietnam 100.0 113.5 113.1 111.8 107.6 102.5 Sources:
- Exchange rates against USD: The World Bank (accessed in March 2017). - Bilateral trade: ASEANstats (accessed in March 2017).
- NEER: author’s calculation.
Table 3.6 shows that over the period 2010-2015, the NEER of Brunei Darussalam, Cambodia, Lao PDR and Singapore declined over time, implying that their currencies consistently appreciated against the currencies of their ASEAN partners. The Singapore dollar is the one that appreciated the most, almost 20% during the period. On the other extreme, NEER of Indonesia increased over time, showing a depreciation trend of this currency against ASEAN partners. During this period, the Indonesia Rupiah experienced a high depreciation of 35.8%. Myanmar witnessed a big jump in NEER, from 105.5 in 2011 to 10,292.0 in 2012 due to the impact of changing in its exchange rate regime.22. From 2012 to 2015, NEER of Myanmar continuously rise, with the total rate of more than 60% during this period. NEER of Malaysia, Philippines, Thailand, and Vietnam slightly fluctuated over the time. As compared to 2010, in 2015, the Malaysian ringgit and the Vietnamese dong depreciated 10.4% and 2.5%, respectively, while the Philippine peso and the Thai bath appreciated about 10% against remaining ASEAN currencies.
In order to assess whether ASEAN countries have gained or loss competitiveness against regional partners, Table 3.7 reports the REER of each country..
Table 3.7 - Real effective exchange rates against ASEAN partners (2010=100)
Country 2010 2011 2012 2013 2014 2015 Brunei Darussalam 100.0 93.8 87.4 83.4 80.4 80.1 Cambodia 100.0 95.7 92.3 92.7 92.3 85.2 Indonesia 100.0 102.5 109.4 125.7 144.4 156.4 Lao PDR 100.0 101.5 96.7 101.7 99.5 96.7 Malaysia 100.0 97.8 94.2 93.5 95.1 106.7
Country 2010 2011 2012 2013 2014 2015 Myanmar 100.0 105.9 10,129.9 15,297.2 16,007.8 19,444.1 Philippines 100.0 100.4 95.7 94.5 96.4 90.7 Singapore 100.0 96.2 94.0 89.2 82.6 77.0 Thailand 100.0 98.3 92.2 85.7 85.4 84.0 Vietnam 100.0 128.9 135.8 139.3 135.5 129.2 Sources:
- Exchange rates against USD: The World Bank (accessed in March 2017). - Bilateral trade: ASEANstats (accessed in March 2017).
- CPI: The World Bank (accessed in March 2017). - REER: author’s calculation.
By construction, an increase/fall in REER indicates that the country is losing/gaining competitiveness against the ASEAN partners. From 2010 to 2015, the REER of Brunei Darussalam, Cambodia, Singapore, and Thailand decreased steadily, showing an upward trend in competiveness of these countries against the rest of ASEAN. Similar to NEER, REER of Indonesia increased sharply over time, meaning that it consistently lost competitiveness against their partners. REER of Myanmar had a leap in 2012 then continuously increased from 2012 to 2015. The other ASEAN countries (Lao PDR, Malaysia, Philippines, and Vietnam) witnessed a fluctuation in their REER against ASEAN partners between 2010 and 2015. In general, as compared to 2010, in 2015, the competitiveness of Lao PDR and Philippines improved while that of Malaysia and Vietnam declined.
Chapter 4.
An ASEAN monetary union? Empirical
evaluation
According to the endogeneity hypothesis referred in chapter 2, the ex-ante fulfillment of the OCA criteria is not required to create a monetary union. The rationale is that the adoption of a common currency puts in action mechanisms of integration that lead to a homogeneous area, where the loss of monetary autonomy is not a major problem for any participant.
Since the endogeneity hypothesis is disputable, a set of countries that decide to form a monetary union should be on the safe side. Besides taking into account all non-economic aspects that are relevant for such a decision, being on the safe side also means fulfilling ex-ante the relevant OCA criteria.
In this chapter what is done is just an assessment of whether the set of countries participating in ASEAN fulfill ex-ante some of the criteria listed in the literature to check whether a group of countries is prepared for having a common monetary policy (and the related common exchange rate policy).
Following Alesina and Barro (2002), in this dissertation, the analysis focuses on three criteria, namely, the similarity of inflation rates, the degree of trade integration and the correlation of business cycles. 23 The analysis uses data post-1997 (the year of the Asian financial crisis), up to 2015. For comparison purposes, the Euro Area (EMU), which is the largest living monetary union in the world, is used as a benchmark.24
Inflation
If a set of countries displays similar inflation rates before creating a monetary union, very likely they will keep having similar inflation rates in the new arrangement. This is relevant for preventing bias in internal trade since in a monetary union there is no exchange rate mechanism able to offset inflation rate differentials among the members.
23 A similar procedure is undertaken in Loureiro et al. (2011) for two actual African monetary unions, whose currencies are pegged to the Euro.
24Currently, the Euro Area is composed by 19 countries. Here only 12 of them are considered, namely those that by 2003 (the beginning of the sample) were already members.
The behavior of inflation rates of ASEAN countries, in the period 2000-2015, is summarized in Table 4.1 and in Figure 4.1.25 The data is annual, based on consumer price indexes, and is collected from the World Bank.
Table 4.1 describes summary statistics for the period, namely simple unweighted averages, the corresponding standard deviations and the maximum and minimum inflation rates of the period (with the respective years). The table also presents (i) the average inflation rate of ASEAN as a whole, computed as a simple mean of the averages of each member; and (ii) the corresponding standard deviation.
Table 4.1 - Inflation rates of ASEAN countries, 2000-2015
Country Inflation rate (%)
Average Standard deviation Max. (year) Min. (year)
Brunei Darussalam 0.6 1.0 2.1 (2011) -2.3 (2002) Cambodia 4.5 6.0 25.0 (2008) -0.8 (2000) Indonesia 7.4 2.9 13.1 (2006) 3.7 (2000) Lao PDR 7.8 5.9 25.1(2000) 0.0 (2009) Malaysia 2.2 1.2 5.4 (2008) 0.6 (2009) Myanmar 15.5 16.2 57.1 (2002) -0.1 (2000) Philippines 4.2 1.7 8.3 (2008) 1.4 (2015) Singapore 1.9 2.0 6.5 (2008) -0.5 (2015) Thailand 2.4 1.8 5.5 (2008) -0.9 (2015) Vietnam 7.2 6.4 23.1 (2008) -1.7 (2000) ASEAN* 5.4 4.5 - -
Sources: World Bank (accessed in March 2017).
*Simple (unweighted) average of the inflation across member nations.
As can be seen from Table 4.1, diversity of inflation rate behaviors among ASEAN countries is a feature in the period. Brunei Darussalam, Malaysia, Singapore, and Thailand (the wealthier countries and founding members of ASEAN) displayed low average levels of inflation (below 2.5%), with relatively low volatility. In turn, five other countries (Cambodia, Indonesia, Lao PDR, the Philippines, and Vietnam) showed, on average, moderate inflation (between 4% and 8%), as well as moderate volatility. In
25The years 1998 and 1999 are not considered to avoid biased descriptive statistics due to the abnormal high inflation rates observed in those years in some ASEAN countries. In particular, the inflation rates of Lao PDR were 91.0% in 1998 and 128.5% in 1999; in Myanmar they were 51.5% and 18.4% in 1998 and 1999, respectively; and in Indonesia the inflation rate in 1998 was 58.4% and in 1999 it was 58.4%.
contrast, Myanmar showed a very high average for inflation rate, with substantial volatility, indicating that the inflation rate of Myanmar has fluctuated significantly during the sample period.
In order to better understand how inflation has evolved in ASEAN countries in the first fifteen years of the century, Figure 4.1 displays, for each year, the average, the standard deviation, and the minimum and maximum inflation rates observed in the ASEAN area. The vertical bars in the diagram link two points: the mean minus one standard deviation and the mean plus one standard deviation.
Figure 4.1 - Inflation rates in ASEAN countries, 2000-2015
Sources: World Bank (accessed in March 2017).
Note: BRN=Brunei Darussalam, KHM=Cambodia, IDN=Indonesia, LAO=Lao PDR, MMR=Myanmar, SGP=Singapore, THA=Thailand, VNM=Vietnam.
As can be seen from the Figure 4.1, during the period 2000-2015 there was a wide fluctuation in the annual inflation rates of ASEAN (as measured by the simple mean of member’s inflation rates), particularly between 2000 and 2008. During this period, Lao and Myanmar, alternatively, had the highest inflation rates in the region and theirs values were far higher than the average inflation levels of the whole ASEAN. On the contrary, for the most of the period, Brunei Darussalam had the lowest inflation rates in ASEAN. However, in the most recent years (from 2009 onward), both the average inflation rates
and the corresponding standard deviations remarkably decreased, as compared to the previous years. Vietnam witnessed the highest inflation rates (although at relatively low levels, as compared with previous years), while Brunei Darussalam still kept the lowest inflation rates among ASEAN countries. Given the information provided in Figure 4.1, it can be concluded that ASEAN has recently witnessed a downward trend both in inflation rates and in the divergence of inflation rates across members.
To compare the recent behavior of inflation rates of ASEAN with the most well-known existing monetary union in the world, Table 4.2 presents the averages and the standard deviations of inflation rates of ASEAN and EMU in every year from 2011 to 2015. The average inflation rates are computed as the simple unweighted mean of all countries in each region. As shown in Table 4.2, the average inflation rates of ASEAN was higher than that of EMU but it declined sharply in recent years from 6.1% in 2011 to 2.2% in 2015. However, what is important to stress is not the average value of inflation, but rather the dispersion of inflation rates. In this regard, the standard deviations of the inflation rates of ASEAN countries were higher than those of the EMU region, indicating that in term of inflation rates, the ASEAN is not as homogeneous as the EMU. Very likely, this is the result of the very high growth rates observed in many ASEAN countries, which tend to pressure prices up.
Table 4.2 - Average and standard deviation of inflation rates, 2011- 2015
Inflation rate (%) Area 2011 2012 2013 2014 2015
Average ASEAN 6.1 3.5 3.8 3.4 2.2
EMU 3.0 2.4 1.1 0.4 0.0
Standard deviation ASEAN 4.4 2.3 2.1 1.9 3.5
EMU 0.6 0.5 0.9 0.8 0.7
Sources: The World Bank (accessed in March 2017) and author’s calculation
All in all, the information from Figure 4.1 and from Table 4.1 suggests that despite the large difference in inflation rates among ASEAN countries in the beginning of the 21st century, more recently, the inflation differential among ASEAN countries has been narrowed, i.e., a convergence process of inflation rates has been observed. Such a behavior gives support to the formation of a monetary union in ASEAN. However, the behavior of inflation rates is not the only economic criterion for deciding the creation of