Full Terms & Conditions of access and use can be found at
https://www.tandfonline.com/action/journalInformation?journalCode=gpav20
International Journal of Pavement Engineering
ISSN: 1029-8436 (Print) 1477-268X (Online) Journal homepage: https://www.tandfonline.com/loi/gpav20
Influence of clogging on the hydrologic
performance of a double layer porous asphalt
Márcia Lopes Afonso, Cristina Sena Fael & Marisa Dinis-Almeida
To cite this article: Márcia Lopes Afonso, Cristina Sena Fael & Marisa Dinis-Almeida (2018): Influence of clogging on the hydrologic performance of a double layer porous asphalt, International Journal of Pavement Engineering, DOI: 10.1080/10298436.2018.1508843
To link to this article: https://doi.org/10.1080/10298436.2018.1508843
Published online: 09 Aug 2018.
Submit your article to this journal
Article views: 31
In
fluence of clogging on the hydrologic performance of a double layer porous asphalt
Márcia Lopes Afonso , Cristina Sena Fael and Marisa Dinis-Almeida
Department of Civil Engineering and Architecture, C-MADE, Centre of Materials and Building Technologies, University of Beira Interior, Covilhã, Portugal
ABSTRACT
Nowadays, the increasing urbanisation and the effect of climate change in cities has been a constant concern. In particular, thefloods cause a significant increase in surface runoff, mostly on roads and parking areas. As an alternative to asphalt pavements, usually used in these areas, permeable pavements have been developed with Porous Asphalt (PA). These pavements allow the infiltration of water from the surface to the ground due to the high void content of the PA, thus reducing the surface runoff and increasing recharge of groundwater. Over the years, the infiltration capacity of the mixtures decreases with the clogging by sediments from the vehicles themselves and/or from the local environment. In order to mitigate this effect, a Double Layer Porous Asphalt (DLPA) was developed. This research intends to deepen the knowledge about the influence of the clogging of a DLPA, with respect to the infiltration capacity, since it is an essential theme in the pavements lifespan and that needs to be developed. This study considered different evaluation phases of the infiltration capacity with two clogging cycles (500 and 1000 g/m2). The materials used were: sand, region soil, and rubber waste. The infiltration capacity test was performed in different phases after a rainfall event of 100 mm/ h with a rainfall simulator developed for this purpose. Furthermore, the permeability test with the falling head permeameter was carried out in parallel, obtaining outflow times for each clogging phase and subsequent maintenance phase. The research concluded that DLPA has a high infiltration capacity after thefirst clogging cycle in both performed tests. In the second clogging cycle, the results show that the infiltration decreased due to the partial filling of the pores, mainly, for the rubber-filled DLPA. The type of clogging material influences the infiltration capacity, nevertheless partially recovered after simple maintenance was performed.
ARTICLE HISTORY
Received 12 January 2018 Accepted 27 July 2018
KEYWORDS
Infiltration capacity; clogging; porous asphalt; maintenance; rainfall simulator; falling head permeameter
1. Introduction
Urban areas subject to changes in rainfall patterns resulting from climate change have led to an inadequate response from conventional drainage systems to stormwater management over time. The Sustainable Urban Drainage Systems (SUDS) also known as Stormwater Best Management Practices (BMPs), cover a set of techniques and solutions with the pur-pose of reducing the negative impacts associated with urban stormwater (Liu et al.2015, Hoang and Fenner2016). One of the techniques integrated by such systems of the quality and quantity management of urban surface runoff are the per-meable pavements. These pavements can be applied on streets or on parking lots and their structure using porous materials integrating them into so-called Green Infrastructures (GI) that seek mitigation measures on the effects of climate change (Derkzen et al. 2017). These pavements are easily adaptable in dense urban environments and their main features are to reduce runoff from rainwater, restore groundwater or store of rainwater, delay peak outflow and filter contaminants from water to soil (Kayhanian et al.2012, Sansalone et al.2012).
The permeable pavement lifespan is determined by the number of years it is in service until its hydraulic performance decreases to a situation where drainage of the design storm event cannot be controlled, it is necessary to carry out correc-tive work (Wong2002). The pavement structure is considered
one of the most important factors that can influence the long-evity of the systems. This structure is constituted from the top to the bottom: by an aggregate reservoir with uniform granulo-metry and with 40% voids that temporarily stores the water until it infiltrates the soil, followed by a thin layer of aggregates to stabilise the surface and the last layer on the surface consist-ing of a porous asphalt layer with high voids content, of 16– 22% (WAPA 2015). The layers with porous materials allow the rainwater infiltration, however, their voids may be clogging over time. The use of a Double Layer Porous Asphalt (DLPA) aims to attenuate the effect of surface layer clogging. The DLPA was created in the Netherlands and its design concept wasfirst presented in 1996 in the 1stEurasphalt and Eurobitume Con-gress by Van Bochove (1996) of Heijmans Infrastructuur B.V. The Innovatieprogramma Geluid (IPG) sought to reduce the road noise at 6 dB using DLPA, which showed to be less noisy than other surfaces including dense mixtures and PA, at any speed (Hamzah 2007). The thin top layer acts as a sieve that reduces sediments that tend to accumulate in the pores and prevents the thick bottom layer from becoming clogged, facilitating drainage. The trapped sediments can be easily removed in DLPA by vacuum cleaning techniques (Ham-zah2007).
Although the application of fully permeable pavements is increasingly frequent, there is also a need to use appropriate
© 2018 Informa UK Limited, trading as Taylor & Francis Group
CONTACT Márcia Lopes Afonso [email protected] INTERNATIONAL JOURNAL OF PAVEMENT ENGINEERING https://doi.org/10.1080/10298436.2018.1508843
tools to measure its functionality in terms of surface infiltration, especially with regard to clogging (Siriwardene et al.2007, Kay-hanian et al. 2012, Sansalone et al.2012, Hassan et al. 2015, Andrés-Valeri et al.2016, Kamali et al.2017). The introduction of sediments and pollutants through the pores of the surface layers of permeable pavements has been one of the most ques-tioned subjects in the use of these pavements, since the bitu-minous mixtures infiltration capacity is questioned when filled. The clogging process can occur due to inorganic and organic particles from the by-products of tire wear, traffic activities and localised vegetation, or dust that is frequently transported to the road (Siriwardene et al. 2007). Further-more, such particles can also infiltrate the permeable pave-ment pores by the passage and vehicle weight which may crush them, producing a size distribution of thefine particles (Kayhanian et al.2012). Retention of solid particles over time progressively reduces the surface pore diameter, also reducing the particle diameter retained (Siriwardene et al.2007). When a significant percentage of the pores in the permeable pave-ment are clogged, the pavepave-ment permeability decreases and, consequently, drastically reduces its infiltration capacity with the years of service until it forms an impermeable surface (Hamzah et al.2013, Hassan et al.2015). In the case of Kay-hanian et al. (2012) it is mentioned that the pavement age and the size of the particles less than 38μm are the main factors that influence the permeability. Siriwardene et al. (2007) demonstrated that the physical clogging is caused by the sedi-ment particles migration less than 6μm in diameter. This clogging process will counteract the purpose of permeable pavements and the clogging materials must be removed to restore the permeability. Various maintenance techniques are known, both manual and mechanical, to minimise the effects of clogging of permeable pavements, the best known being broom cleaning, vacuuming and high pressure jet wash-ing (Sansalone et al.2012, Hamzah et al.2013, WAPA2015, Winston et al. 2016).
A means of assessing the pavements infiltration capacity and their hydraulic performance, without surface runoff, is through the measurement of surface permeability. The single-ring and double-ring infiltrometers tests (Al-Rubaei et al. 2013) and the falling heads (Hamzah et al. 2013, Hassan et al. 2015, Marchioni et al.2016) are among the methods used to directly measure infiltration capacity. On the one hand, falling head are the most used to measure the permeability in porous surfaces due to their simplicity and the limitations imposed by the measurements in situ (Andrés-Valeri et al. 2016). Generally, the permeability test results provide an outflow time by which the hydraulic conductivity is obtained directly. On the other hand, the use of rainfall simulators provides more realis-tic assessments and more precise conditions of the effect of rainfall intensity under clogging conditions in permeable pave-ments (Coleri et al. 2013, Marchioni et al.2016). This is an important method in infiltration studies and at the same time time-efficient, cost-effective and easy to transport to inaccess-ible areas in order to overcome the dependence of natural rain-fall events (Pérez-Latorre et al.2010). The infiltration capacity is directly related with the mixture void content. Entities such as Wisconsin Asphalt Pavement Association (WAPA) rec-ommend a minimum void content of 16% to allow porous
mixtures to have infiltration capacity (WAPA 2015). The infiltration capacity values mentioned in the literature are quite discrepant. Some studies reported infiltration capacities after the construction of 290 and 470 mm/min and with about 2 years of service without maintenance; therefore, pre-senting a reduction to 19 and 9.5 mm/min, respectively (Sten-mark1995, Bäckström and Bergström2000and Gyllefjord and Kangas1989cited by Al-Rubaei et al.,2013). However, other systems with several years of service still provide infiltration capabilities far above hydrological requirements (Kadurupo-kune and Jayasuriya 2009). Sañudo-Fontaneda et al. (2014) refers, even, to values of 132 mm/min after 5 years of service without maintenance. In Europe the minimum value referred to the infiltration capacity is 97.2 mm/h (Boogaard et al.
2014). Some important factors that influence the clogging of the porous mixtures and, consequently, their infiltration capacity are the local conditions of the pavements, namely in relation to the types and concentrations of sediments, sizes and deposition rates, sediment granulometry, average daily traffic and the pluviometric regime, in addition to the different characteristics between porous mixtures (mainly of the void content) (Kayhanian et al. 2012, Sansalone et al. 2012, Andrés-Valeri et al.2016).
The effect of different concentrations of clogging materials on the porous mixtures permeability in a double layer porous asphalt is not a subject widely found in the literature and there-fore it is a question of investigation that needs to be explored. In this way, this research analyses the influence of three clogging materials (sand, soil and rubber), with different concentrations, on the DLPA infiltration capacity to be applied on a permeable asphalt pavement subject to a rainfall intensity. The experimen-tal work of this study was performed with a rainfall simulator developed in laboratory, in order to simulate real precipitation conditions, and later, with a falling head permeameter the per-meability test was performed. The specific objectives of this study were: i) construct and characterise in the laboratory the two porous asphalt layers, regarding the voids content and characterise the clogging materials used, concerning of granu-lometry; ii) simulate the rainfall intensity on the DLPA when clogged and performing the permeability test, obtaining infiltration rates and outflow times, respectively; iii) perform a traditional maintenance through sweeping and vacuuming, obtaining infiltration flows and outflow times after mainten-ance; iv) to analyse the influence of the clogging materials on the permeability and permeability of DLPA studied.
2. Materials and methods
The experimental programme of this study comprised four essential tasks antecedent to the test methodology: production of slabs for each porous asphalt and its characterisation regard-ing the void content durregard-ing the tests; characterisation of the clogging materials through granulometry; assembling the rain-fall simulator in the laboratory and calibration to an intense rainfall intensity; and characterisation of the falling head per-meameter. The experimental procedure describes the process of application of the rainfall intensity in the slabs and sub-sequent performance of the permeability test, before and after clogging and maintenance. Thus, the following sections
describe in detail the materials and methods considered in this research.
2.1. Double layer porous asphalt properties (DLPA)
The study carried out in this work integrates the characteris-ation of two layers of porous asphalt to be applied in a per-meable asphalt pavement. This solution is referred to as a double layer porous asphalt and has been highlighted by several researchers (Hamzah et al.2013, Liu et al.2016). Its purpose is to improve the effectiveness and durability of porous asphalt and to reduce the problem of clogging that occurs in a single layer porous asphalt. In addition to these benefits, other advan-tages are mentioned such as absorption of noise, mitigates heat islands effects, minimisation of tire spray and hydroplaning, as well as road safety (Mullaney and Lucke2014, Liu et al.2016). In the lower layer a thicker aggregate layer having a maximum dimension of 12–20 mm is applied, followed by a thinner aggregate surface layer of maximum size 8–10 mm (CEPSA
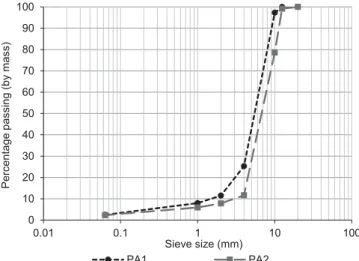
2014). The thinner layer on the surface acts as a sieve that reduces the ingress of sand or debris from accumulating in the pores and prevents the coarse bottom layer from clogging and leaving it free draining (Hamzah et al. 2013). Six slabs were produced in the laboratory for each layer of porous asphalt with 30 × 30 m2. The thickness of thefine top layer of porous asphalt (PA1) was 3 cm and the coarse bottom layer of porous asphalt (PA2) was 4 cm, both compacted with a vibratory plate compactor. The PA1 mix was produced with 90% of 5/10 gravel, 8% of stone dust and 2% of hydraulic lime. The PA2 mix was produced with 94% of 5/15 gravel, 4% of stone dust and 2% of hydraulic lime. The binder used was a polymer modified bitumen (PMB 45/80) with values of 5.2 and 5.1% for the PA1 and PA2 mixes, respectively. Both porous asphalts were incorporated with cellulosic fibres the main objective of inhibiting theflow of the binder due to its composition with few fines, as previous works (Afonso et al.
2017). The particle size distribution of the PA1 and PA2 is shown inFigure 1. The initial void content obtained in each slab to the European Standard EN 12697-8 (2003) is shown inTable 1, fulfilling the minimum recommended void content (16%).
2.2. Clogging materials properties
The local conditions where the pavements are inserted, consider-ing the particle size distribution of the materials of the surround-ing area, and the resultsurround-ing cloggsurround-ing risks, includsurround-ing the quantities and the way sediments act, define the permeable pavements per-formance. (Kamali et al.2017). The sediments used for simu-lations may be of real samples or obtained artificially and their application may be manual, (Coleri et al.2013), dissolved in rain-water (Pezzaniti et al.2009) or added to surface runoff (Kamali
et al.2017). The most common materials to simulate clogging in permeable pavements are the soils and sands, derived from the region where the pavement is installed and the conditions to which it is subject to (Hassan et al. 2015). The materials selected in this study for clogging the DLPA were: quarry sand, soil from the region and rubber waste from car tires. The grain size curve presented inFigure 2shows the corrected granulome-try of the three clogging materials. This curve was compared with a compilation of grain size limits reported in the study by Andrés-Valeri et al. (2016), guaranteeing the predominance of fine material. The mass of the clogging material is among the main factors affecting the clogging of permeable pavements (Nichols et al. 2015). The clogging materials used had bulk density of 2.60 g/cm3 for sand (Nepomuceno et al.2018), 1.73 g/cm3for soil and 0.50 g/cm3for rubber. The tests were carried out with two clogging cycles, each applying 500 g/m2, obtaining afinal clogging of 1000 g/m2(values representative of the actual clog-ging conditions in laboratory simulations).
2.3. Rainfall simulator
The study offlow and infiltration with real rainfall is limited by rainfall dependence due to its variability of intensity, droplet
Figure 1.Porous asphalt (PA1 and PA2) particle size distribution.
Table 1.DLPA voids content.
PA1 PA2 Rainfall simulator 1 18.6% 21.1% 2 20.0% 23.9% 3 19.3% 23.0% Permeameter I 21.5% 23.3% II 21.1% 22.7% III 20.1% 20.3%
Figure 2.Particle size distribution of clogging materials and ranges reported by Andrés-Valeri et al. (2016).
size, kinetic energy, space and time distribution (Pérez-Latorre et al.2010). In contrast, the rainfall simulation allows a quick and possible collection in laboratory and field exper-iments. A rainfall simulator was used to measure the in filtra-tion capacity in order to make a more realistic laboratory study and in more precise conditions. The rainfall simulator developed (Figure 3(a)) has the capacity to generate rainfalls with variable intensities over areas up to 1 m2. This simulator consists of a stainless steel tubular frame supported by four adjustable bars to provide a height that varies from 2 to 3 m above the pavement surface, allowing a spectrum of dro-plet diameters as close as possible to natural rainfall (Meyer 1994). The rainfall simulation was performed with a sprinkler centred on the frame, as it corresponded to the desired rainfall characteristics. The nozzle model was Fulljet B3/8HH-9.5 and was monitored by an upstream pressure gauge with a measuring range of 0.2 bar. The sprinkler was supplied by a polyethylene pipe with clean water from a 1000 l tank.
Figure 3(b) presents the modular structure with the dimen-sions of 0.50 m in height and 0.30 m in width and length, according to the format of the slabs, which served as an exper-imental device to support the DLPA and the tests. This struc-ture was adapted to collect both the infiltrated waters and the surface runoff generated during the rainfall period. These flows were monitored using the weight of the water collected in containers.
The rainfall intensity was 100 mm/h, characteristic of an extreme intensity in several cities of the world (Nnadi et al.
2014). Different configurations regarding the height of the sprinkler, pressure and positioning of the modular structure were studied to standardise the rainfall. The calibration of the actual rainfall intensity was performed using theflow measure-ment method. This consisted in collecting a volume of rainfall according to a certain pressure. For this, a metal collector box with an area of 0.30 × 0.30 m2was used. After several tests with three replicates and durations of 2 minutes, the height adopted from the sprinkler to the PA1 surface was 2.60 m and the selected pressure was 2.6 bar.
The distribution uniformity of the simulated rainfall was measured by the collecting cup method through the calculation of Christiansen’s Uniformity Coefficient (CUC) (Christiansen
1942). The test consisted in placing 9 buckets on the study area distributed in a 3 × 3 mesh, 10 cm apart from each other, submitted to the intensity of 100 mm/h. The test ended when the first cup was completely filled. The mean CUC value, resulting from the three measurements, was 78.38%, considered acceptable according to authors who reported minimum CUC values above 70% (Little et al.1993).
2.4. Falling head permeameter
The water drainage in the DLPA was evaluated by performing the permeameter test with the permeameter falling head pre-sented in European Standard EN 12697-40 (EN 12697-40
2012), which is based on the outflow time. This is defined as
the time required for afixed volume of water to drain through a permeable surface. It corresponds to the recording, in seconds, of measurements of time between mark 5 and 1 l delimited in the own equipment, which must be fixedly sup-ported in the study surface, according toFigure 4. The
infiltra-tion circular area of the water with this method has a diameter of 300 mm. The indication of the permeability of the mixtures is drawn directly from the outflow time obtained in each test. The test was performed twice at the centre of the DLPA at each test stage defined in the experimental procedure.
2.5. Experimental procedure
The schematic diagram ofFigure 5shows the four test phases performed to evaluate the performance of the DLPA using the rainfall simulator and the falling head permeameter. In a
pre-evaluation of the experimental installation, several prelimi-nary tests were performed revealing a good performance of both equipments in the capacity to respond to the research objectives. The methodology presented was repeated, indepen-dently, for each of the three clogging materials subject to a rain-fall intensity of 100 mm/h over a period of 50 minutes. During this period, the volume of surface runoff was collected when it happened.
The laboratory methodology for each test comprised the fol-lowing phases: the 1stphase evaluated the DLPA performance after construction, i.e. in initial conditions without any clog-ging; in the 2nd phase, the first clogging cycle was applied with a quantity of 500 g/m2 clogging material corresponding to 45 g, manually dispersed on the surface of PA1 followed by a slight steel roll compacting; in the 3rd phase the second clogging cycle was applied in the same way as in the 1stcycle, completing at the end of the 2ndcycle an amount of clogging material of 1000 g/m2; after complete drying of the slabs which occurred after four days (δ Massa = 0 em 24 h) at ambi-ent temperature (26 ° C), the 4th phase was performed with a traditional maintenance. On the one hand, some authors
refer cleaning with a vacuum system and high pressure washing as the most effective maintenance techniques (WAPA 2015, Winston et al. 2016). On the other hand, this technique is not available to the city cleaning sectors and the use of mech-anical street sweeping and vacuum street sweeping are the most common maintenance measures (Hunt2011). Thus, the maintenance performed in this research combined the simple cleaning with sweeping performed for one minute and vacuum-ing for another minute, simulatvacuum-ing the most used technique in road maintenance with a compact sweeper. The data obtained at infiltration and flow, as well as outflow times, correspond to the DLPA evaluation after each evaluation phase. In addition, the respective weighing of the slabs between the different phases has been recorded.
3. Results and discussion
3.1. Hydrologic performance after construction
The infiltration flow hydrographs obtained with the rainfall simulator are represented inFigure 6for each DLPA after con-struction, later clogged with the three clogging materials. The progress of the initial infiltration flow curves is equivalent for the three clogging materials. It is observed in all hydrographs that the infiltration flow in the initial minutes of the test increases progressively until reaching the constantflow, eviden-cing a delay between the inlet flow and the outflow. Alsubih et al. (2017) defined this delay as the time required for rainfall
to enter in the pavement structure until reaching the free drai-nage point, corresponding to the outflow. This aspect explains water retention in pores, causing a reduction of the water travel time through the DLPA until the exit point. Therefore, the initial moisture content of the pavement before a rainfall event is decisive in its response capacity to rainwater storage (Alsubih et al.2017).
The constant infiltration flow is reached, in the three hydro-graphs, at about 20 minutes of testing. This level corresponds to the maximum rainfallflow in the area of the study slabs. This fact shows that in thefirst few minutes the pores of the mixtures werefilled with water, which was later drained after the increase of hydraulic load inside the porous asphalt when the saturation point was reached, giving rise to the constant outflow of water by infiltration. This behaviour of the DLPA leads to the amount of rainfall water being coincident with the amount of water infiltrated and therefore, there was no surface runoff in any of the cases of the DLPA tested.
3.2. Hydrologic performance after clogging materials
The clogging process consists of three stages according to Mis-hra et al. (2013). Initially, the materials come into contact with the pavement surface. Thereafter, the fine particles flow through the pavement layers and the coarse particles are retained on the surface creating a coating layer which leads to the reduction of infiltration. In the last stage, the coating layer becomes thicker and when compacted by the passage of the vehicles sharply reduces the infiltration rate. Figure 7
shows the hydrographs corresponding to the 1st and 2nd clog-ging cycles applied to each DLPA. In the 1st clogging cycle,
Figure 5. Schematic diagram of the infiltration capacity assessment test methodology.
Figure 6.Infiltration capacity after construction in each DLPA.
corresponding toFigure 7(a), it is verified that the infiltration
flow for the sand and for the soil is practically coincident. Nevertheless, the infiltration flow of DLPA with the 1st
rubber cycle is slightly lower, about 7%. Thus, it is noted that rubber is the material that most influences the behaviour of rainwater infiltration after a clogging cycle of 500 g/m2
.
The behaviour in the 2ndcycle (Figure 7(b)) follows the same trend for materials as sand and soil, however, the infiltration flow with the rubber is again highlighted. This is much lower, as DLPA with 1000 g/m2of rubber was found to be unable to drain all the rainfall water and the excess was drained on the surface. In percentage terms, about 30% of the rainfall flow was infiltrated and 70% originated surface runoff. It is further observed, that as the test took place the amount of infiltration water decreased around 21% relative to the peak found after 6 minutes of testing, while the amount of discharged water on the surface was progressively increasing. This leads one to suppose that after a long period of time, the DLPA with rubber could not infiltrate the rainwater, leading to DLPA clogging. It should be noted that visually the largest amount of rubber waste accu-mulated on the surface, i.e. on the PA1 slabs, as a result to be removed with maintenance. This behaviour indicated that the rubber reached the second stage of the clogging process. In addition, the bulk density of this clogging material is lower compared to the other two, leading to greater ease of entrap-ment of the rubber particles in the voids existing on the PA1 surface, as a consequence of the impact of rainfall drops and their kinetic energy. The infiltration capacity decrease of each
DLPA with sand and soil after the 2nd clogging cycle was about 3 and 5%, respectively, relative to the initial infiltration capacity. Therefore, these materials do not cause major effects on the hydrological performance of DLPA. It should be noted that the behaviour of sand and soil materials did not reach the second stage of the clogging process, as it did not cre-ate a barrier to precipitation.
3.3. Hydrologic performance recovery
The difference between the hydrological performance of the DLPA after two cycles of clogging and after performing a main-tenance is defined as the infiltration capacity recovery of the DLPA. In this way, these referred behaviours are observed in
Figure 8, as well as the initial behaviour by each material of clogging. An infiltration capacity is clearly verified in all materials. At the end of the rainfall simulation after mainten-ance, the DLPA clogged with sand recovered about 2% in relation to the 2ndclogging cycle. The recovery of DLPA with soil was 3%. Distinguishing itself from the high recovery of the infiltration flow after the 2ndclogging cycle of DLPA with rubber in about 69%, demonstrating the validity of the main-tenance performed. The simple mainmain-tenance technique used in this research allowed DLPA to restore the initial infiltration capacity. The deviations around 1% and 0.7% of the DLPA rela-tive to the sand and rubber are noticeable, respecrela-tively, com-paring the initial behaviour and after maintenance. As for DLPA with soil, the deviation after maintenance and initial is about 2%. The deviations obtained are considered low and, therefore, indicate the good performance of the DLPA as to its function of rainwater infiltration.
The void content recorded in each evaluation phase is pre-sented inTable 2for the set of two slabs (PA1 and PA2) that compose the three DLPA tested with the rainfall simulator. The results show the phase registers under wet and dry con-ditions. The initial void content of the PA1 slabs is lower than of the PA2 slabs because of their structure with smaller sized aggregates in order to provide afiner filter to the external sediments. It is observed, in wet conditions, that the contents of voids decrease with the clogging cycles, although the reductions between the 1stand 2ndcycle are not significant. This is visible in the PA1 slabs, where thefilter action of this thin top layer prevents the clogging sediments from reaching the bottom layer, as reported by Hamzah et al. (2013). It is noted that the PA1 slabs with rubber show a void loss after the 2nd cycle, taking a value below the theoretical limit of 16%, leading to infiltration capacity loss and to the surface runoff occur-rence, as described before.
The simulation of rainfall after maintenance allowed the movement of some sediments from the inside of the slabs to the outside through the infiltrated waters. Thus, after simple maintenance on the PA1 surface, the void content is re-estab-lished according to initial values. Studies have documented that pavement failure due to clogging is mainly associated with particles trapped in the permeable pavements surface (Kayhanian et al.2012, Coleri et al.2013), in line with the con-clusions drawn in this study. This observation is valid only for the PA1 slab, since the PA2 slabs were not practically influenced by the clogging materials, presenting equal void
Figure 7.Clogging materials influence: (a) 1stclogging cycle; (b) 2ndclogging cycle.
contents after the two clogging and a complete restoration after maintenance.
In dry conditions, it is again verified that after clogging the contents of voids are reduced, especially at the PA1, due to clogged pores caused by clogging materials. After performing maintenance with broom and aspiration most of the surface clogging materials were removed, however, a small amount was retained inside the slab PA1, as can be checked for the con-tents of voids after maintenance and at the end of all testing and complete drying. What stands out, under dry conditions, is the restoration of the void content for the PA1 and PA2 slabs test with rubber, leading to the mentioned results in the infiltration capacity recovery.
3.4. DLPA hydrologic performance
Figure 9shows the relationship between the outflow time and the clogging cycles for the different clogging materials, as well as the result of the maintenance phase, using the falling head permeameter. The initial outflow time between the DLPA studied with the permeameter varies only between 10.0 and
12.1 s, so the set of PA slabs that form the DLPA have the same behaviour as regarding the initial infiltration capacity. Other studies indicate initial outflow times average of 15 and 63 s for a single layer (Hamzah et al. 2013, Andrés-Valeri et al.2016) and 24 s for a double layer (Hamzah et al.2013), higher than those obtained in this study due to the composition of the porous asphalt. The results of the permeability test showed that DLPA clogging results in decreased permeability, lead to an increase in outflow time after the 2ndcycle of
clog-ging material to values greater than 50 s. The DLPA clogged with sand shows the highest outflow time after the 2ndclogging
cycle, which was not verified with the simulator, where the DLPA with rubber showed the worst results in this phase. The values mentioned in other studies indicate much higher outflow times after a clogging with 1000 g/m2, in the average
order of 162 s, using the same test equipment, however, with different granulometry of the clogging material and
Figure 8.Infiltration capacity recovery with maintenance: (a) Sand; (b) Soil; (c) Rubber.
Table 2.% Air voids content of the slabs tested with rainfall simulator. DLPA
(Sand) DLPA (Soil)
DLPA (Rubber) PA1 PA2 PA1 PA2 PA1 PA2 Wet conditions % Voids content
After wet 16.0 19.8 17.8 23.0 18.0 22.5 After 1stclogging cycle 15.7 19.7 17.4 22.5 17.8 22.0
After 2ndclogging cycle 15.1 19.7 17.0 22.5 15.2 22.0 After maintenance and precipitation 15.9 19.8 17.7 23.0 18.0 22.5 Dry conditions % Voids content
Initial 18.6 21.1 20.0 23.9 19.3 23.0 After clogging and drying (4 days) 16.9 20.8 18.4 23.7 18.1 22.7 After maintenance 17.5 20.8 19.0 23.7 19.0 23.0 Afterfinal testing and drying 17.7 21.1 19.1 23.9 19.1 23.0
Figure 9.Outflow time evolution in each test phase.
composition of different PA (Andrés-Valeri et al. 2016). The maintenance process resulted in a significant recovery of the permeability of the mixtures as indicated by the decrease in the outflow time to about half in relation to the 2ndclogging cycle, regarding sand and soil. However, it did not approach the initial outflow time, as it did with the simulator, showing the clogging destructive effects. The recovery is greater when performing maintenance of the DLPA with rubber, practically reaching the initial outflow time. The behaviour of DLPA after maintenance with the permeameter is analogous to that per-formed with the simulator. Hamzah et al. (2013) in a compara-tive study between single and double drainage layers found that after some clogging cycles, the sediments accumulated rapidly in the pores and impaired the mixtures permeability, indicating the need for 2 and 5 cycles for clogging the single and double layers, respectively. Thus, it is concluded that using a double layer improves the behaviour of the mixtures to the effects of clogging and recover partially after one maintenance, as verified by the results of the present study.
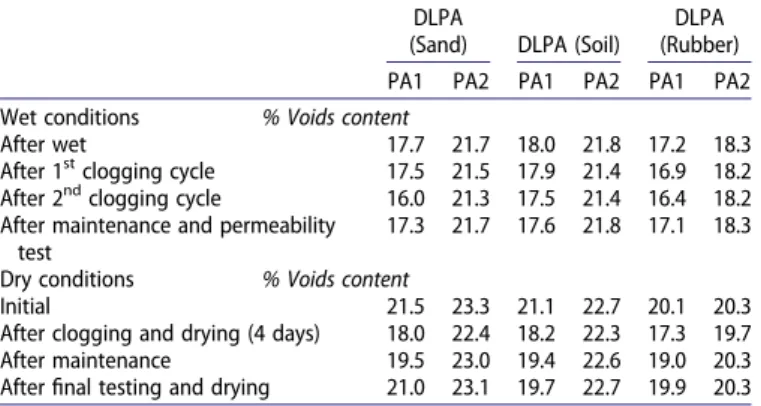
In the same way as with the simulator, the PA1 and PA2 slabs void contents tested with the permeameter were obtained, according to Table 3. In wet conditions, the void content decreases with the clogging cycles derived from the filling of the pores with sediments, such the results of the outflow time. After the maintenance and the permeability test the sur-face layer pores were partially unclogged, recovering part of the void content. The clogging material remains in the voids of PA1 slabs causing the discharge time which has not been reduced to the initial value in any DLPA. Analysis under dry conditions show a reduction of the void content after the DLPA clogging with the three materials. The maintenance recovered some of the clogged voids and the permeability test, performed next, improved this recovery to contents of voids near the beginning, mainly in relation to DLPA with rubber.
4. Conclusion
The clogging impedes the adequate hydrological performance of permeable pavements, as their function of rainwater in filtra-tion is restricted by the creafiltra-tion of an impermeable surface after a period of time in service. Manyfield studies have shown that clogging exists in permeable pavements, but there are still few studies that relate clogging materials to the hydrologic perform-ance. In this study, the infiltration capacity of the simulated
rainwater of a DLPA when it clogged by three types of clogging materials was studied. In addition, the permeability of DLPA under the same conditions was also evaluated. The present study highlights the following conclusions:
. The method of evaluating the infiltration capacity with the rainfall simulator showed that the studied DLPA has a good hydrological performance, and it is able to reduce the surface runoff from a precipitation of 100 mm/h.
. The amount of sand and soil used did not significantly affect the DLPA infiltration capacity. However, the use of rubber limited the drainage of the water after a clogging of 1000 g/m2, reducing the infiltration and occurring the sur-face runoff. The kinetic energy of the precipitation may have led to the entrapment of materials of lower density in the voids of the mixture, making it impossible to infiltrate. Aspect that will be more difficult to occur with heavier material, however, this observation requires additional studies.
. In order to mitigate the failure of the DLPA hydrological performance through clogging, a sweeping and vacuuming maintenance was performed. This has proved to be effective in removing the clogging materials, especially rubber resi-dues. The application of this technique resulted in the rees-tablishment of the initial infiltration capacity of DLPA.
. The method of evaluating the outflow time performed with the permeameter resulted in significant differences in relation to the initial outflow time, when the DLPA were filled with the three materials, showing the same behaviour. However, after maintenance, the DLPA with sand and soil recovered about half the permeability, while the DLPA clogged with rubber had practically reached the initial outflow time.
Therefore, the permeability test performed with the permea-meter is more conservative in relation to the evaluation per-formed with the rainfall simulator. On the one hand, there is a greater influence of clogging materials with the permeameter, while the infiltration capacity with the simulator approaches the initial one for the DLPA with sand and soil. On the other hand, the maintenance technique was able to recover the hydrological performance of the DLPA in both test methods, emphasising an improvement with the use of the simulator.
The infiltration flow results show that the permeable pave-ment can effectively decrease the runoff resulting from rain-water. The studied DLPA, after being clogged with the three materials and subsequently subject to maintenance, showed that it had the infiltration capacity of practically the entire rain-water intensity being 100 mm/h (98%) and slowly releasing it to a rainwater storage system or groundwater recharge. Thus, the use of DLPA in permeable pavements responds effectively to the attenuation of the effects caused by clogging.
Acknowledgements
This work is supported with Portuguese national funds by FCT - Foun-dation for Science and Technology within the UID/ECI/04082/2013 pro-ject. The authors are grateful for the supply of rubber waste granules by Biogoma company.
Table 3.% Air voids content of the slabs tested with falling head permeameter. DLPA
(Sand) DLPA (Soil)
DLPA (Rubber) PA1 PA2 PA1 PA2 PA1 PA2 Wet conditions % Voids content
After wet 17.7 21.7 18.0 21.8 17.2 18.3 After 1stclogging cycle 17.5 21.5 17.9 21.4 16.9 18.2 After 2ndclogging cycle 16.0 21.3 17.5 21.4 16.4 18.2
After maintenance and permeability test
17.3 21.7 17.6 21.8 17.1 18.3 Dry conditions % Voids content
Initial 21.5 23.3 21.1 22.7 20.1 20.3 After clogging and drying (4 days) 18.0 22.4 18.2 22.3 17.3 19.7 After maintenance 19.5 23.0 19.4 22.6 19.0 20.3 Afterfinal testing and drying 21.0 23.1 19.7 22.7 19.9 20.3
Disclosure statement
No potential conflict of interest was reported by the authors.
Funding
This work is supported with Portuguese national funds by FCT - Foun-dation for Science and Technology within the [grant number UID/ECI/ 04082/2013] project.
ORCID
Márcia Lopes Afonso http://orcid.org/0000-0002-1911-891X
References
Afonso, M.L., Dinis-Almeida, M., and Fael, C.S.,2017. Study of the porous asphalt performance with cellulosicfibres. Construction and Building Materials, 135, 104–111.doi:10.1016/j.conbuildmat.2016.12.222. Al-Rubaei, A.M., et al.,2013. Long-term hydraulic performance of porous
asphalt pavements in Northern Sweden. Journal of Irrigation and Drainage Engineering, 139 (6), 499–505.doi:10.1061/(ASCE)IR.1943-4774.0000569. Alsubih, M., et al.,2017. Experimental study on the hydrological
perform-ance of a permeable pavement. Urban Water Journal, 14 (4), 427–434.
doi:10.1080/1573062X.2016.1176221.
Andrés-Valeri, V.C., et al.,2016. Laboratory assessment of the infiltration capacity reduction in clogged porous mixture surfaces. Sustainability, 8 (8), 751.doi:10.3390/su8080751.
Bäckström, M, and Bergström, A. ,2000. Draining function of porous asphalt during snowmelt and temporary freezing. Canadian Journal of Civil Engineering, 27 (3), 594–598.https://doi.org/10.1139/l99-095. Boogaard, F., Lucke, T., and Beecham, S,2014. Effect of age of permeable
pavements on their infiltration function. Clean - Soil, Air, Water, 42 (2), 146–152.doi:10.1002/clen.201300113.
CEPSA., 2014. Manual de pavimentação. Lisboa, Portugal,: CEPSA
Portuguesa Petróleos, SA. 3a.
Christiansen, J.E.,1942. Irrigation by sprinkler. Riverside, United States: California Agricultural Experiment Station.
Coleri, E., et al.,2013. Clogging evaluation of open graded friction course pavements tested under rainfall and heavy vehicle simulators. Journal of Environmental Management, 129, 164–172. doi:10.1016/j.jenvman. 2013.07.005.
Derkzen, M.L., van Teeffelen, A.J.A., and Verburg, P.H,2017. Green infra-structure for urban climate adaptation: how do residents’ views on cli-mate impacts and green infrastructure shape adaptation preferences?
Landscape and Urban Planning, 157, 106–130. doi:10.1016/j.
landurbplan.2016.05.027.
EN 12697-40.,2012. Bituminous mixtures - Test methods for hot mix asphalt - Part 40: In situ drainability. European Standard ICS 93.080.20, European Committee for Standardization: Brussels. EN 12697-8., 2003. Bituminous mixtures - Test methods for hot mix
asphalt - Part 8: Determination of void characteristics of bituminous specimens. European Standards ICS 93.080.20, European Committee for Standardization: Brussels.
Gyllefjord, A, and Kangas, J,1989. Infiltrationsmätning på permeabel asfalt i labmiljö [Infiltration measurements of permeable asphalt in labora-tory]. M.Sc. thesis, Luleå University of Technology, Luleå, Sweden (in Swedish)..
Hamzah, M.O,2007. Double layer porous asphalt in the netherlands and field monitoring in belgium. Proceedings of the Eastern Asia Society for Transportation Studies, 6, 1–13.
Hamzah, M.O., et al., 2013. Laboratory simulation of the clogging behaviour of single-layer and two-layer porous asphalt. Road
Materials and Pavement Design, 14 (1), 107–125. doi:10.1080/
14680629.2012.749803.
Hassan, N.A., et al.,2015. Laboratory evaluation on the effect of clogging on permeability of porous asphalt mixtures. Jurnal Teknologi, 76 (14), 77–84.doi:10.11113/jt.v76.5846.
Hoang, L. and Fenner, R.A.,2016. System interactions of stormwater man-agement using sustainable urban drainage systems and green
infra-structure. Urban Water Journal, 13 (7), 739–758. doi:10.1080/
1573062X.2015.1036083.
Hunt, W.F,2011. Maintaining permeable pavements. Urban Waterways, 1–8. Kadurupokune, N. and Jayasuriya, N., 2009. Pollutant load removal efficiency of pervious pavements: is clogging an issue? Water Science and Technology, 60 (7), 1787–1794.doi:10.2166/wst.2009.571. Kamali, M., Delkash, M., and Tajrishy, M.,2017. Evaluation of permeable
pavement responses to urban surface runoff. Journal of Environmental Management, 187, 43–53.doi:10.1016/j.jenvman.2016.11.027. Kayhanian, M., et al.,2012. Permeability measurement and scan imaging
to assess clogging of pervious concrete pavements in parking lots. Journal of Environmental Management, 95 (1), 114–123.doi:10.1016/ j.jenvman.2011.09.021.
Little, G.E., Hill, D.J., and Hanson, B.R.,1993. Uniformity in presurized
irrigation systems depends on design, intallation. California
Agriculture, 47 (3), 18–21.
Liu, Y., et al.,2015. Enhancing a rainfall-runoff model to assess the impacts of BMPs and LID practices on storm runoff. Journal of Environmental Management, 147, 12–23.doi:10.1016/j.jenvman.2014.09.005. Liu, M., Huang, X., and Xue, G,2016. E
ffectsofdoublelayerporousasphaltpave-ment of urban streets on noise reduction. International Journal of Sustainable Built Environment, 5 (1), 183–196.doi:10.1016/j.ijsbe.2016.02.001. Marchioni, M., et al.,2016. Laboratory study on the rainfall influence over
the sediment transport dynamics on pervious pavements’ discharge. Urban Water Systems and Floods, 165, 165–176.doi:10.2495/UW160151. Meyer, L.D.,1994. Rainfall simulator for soil erosion research. In: R.L. Lal, ed. Soil erosion research methods. Ankeny: Soil Water Conservation Society, 83–103.
Mishra, K., Zhuge, Y., and Karunasena, W.,2013. Clogging mechanism of permeable concrete : a review. Concrete 2013: Understanding Concrete Conference, Gold Coast Australia, 16–18.
Mullaney, J. and Lucke, T,2014. Practical review of pervious pavement designs. Clean - Soil, Air, Water, 42 (2), 111–124.doi:10.1002/clen. 201300118.
Nepomuceno, M.C.S., Pereira-de-Oliveira, L.A., and Pereira, S.F,2018. Mix design of structural lightweight self-compacting concrete incorporating coarse lightweight expanded clay aggregates. Construction and Building Materials, 166, 373–385.doi:10.1016/j.conbuildmat.2018.01.161. Nichols, P.W.B., White, R., and Lucke, T,2015. Do sediment type and test
durations affect results of laboratory-based, accelerated testing studies of permeable pavement clogging? Science of the Total Environment, 511, 786–791.doi:10.1016/j.scitotenv.2014.12.040.
Nnadi, E.O., et al.,2014. An evaluation of enhanced geotextile layer in per-meable pavement to improve stormwater infiltration and attenuation. International Journal of Pavement Engineering, 15 (10), 925–932.
doi:10.1080/10298436.2014.893325.
Pérez-Latorre, F.J., de Castro, L., and Delgado, A,2010. A comparison of two variable intensity rainfall simulators for runoff studies. Soil and Tillage Research, 107 (1), 11–16.doi:10.1016/j.still.2009.12.009. Pezzaniti, D., Beecham, S., and Kandasamy, J,2009. Influence of clogging
on the effective life of permeable pavements. Proceedings of the Institution of Civil Engineers - Water Management, 162 (3), 211–220.
doi:10.1680/wama.2009.00034.
Sansalone, J., et al.,2012. Filtration and clogging of permeable pavement
loaded by urban drainage. Water Research, 46 (20), 6763–6774.
doi:10.1016/j.watres.2011.10.018.
Sañudo-Fontaneda, L.A., et al.,2014. Field study of infiltration capacity reduction of porous mixture surfaces. Water (Switzerland), 6 (3), 661–669.doi:10.3390/w6030661.
Siriwardene, N.R., Deletic, A., and Fletcher, T.D.,2007. Clogging of stormwater gravel infiltration systems and filters: insights from a laboratory study. Water Research, 41 (7), 1433–1440.doi:10.1016/j.watres.2006.12.040. Stenmark, C,1995. An alternative road construction for stormwater
man-agement in cold climates. Water Science Technology, 32 (1), 79–84.
https://doi.org/10.2166/wst.1995.0019.
van Bochove, G.,1996. Twinlay, A new concept of drainage asphalt
con-crete. Proceeding 1st Euroasphalt and Eurobitume Congress.
Strasbourg, France.
WAPA.,2015. Porous asphalt pavements. Wisconsin Asphalt Pavement Association, September, 1–12.
Winston, R.J., et al.,2016. Maintenance measures for preservation and recovery of permeable pavement surface infiltration rate - the effects of street sweeping, vacuum cleaning, high pressure washing, and
milling. Journal of Environmental Management, 169, 132–144.doi:10. 1016/j.jenvman.2015.12.026.
Wong, T.H.F.,2002. Urban stormwater management and water sensitive urban design in Australia. Global Solutions for Urban Drainage.