Leonel P.J. Marques1, Isa Cavaco1,2, José P. Pinheiro2, Vera Ribeiro1,2and Guilherme N.M. Ferreira1,3* 1Centre for Molecular and Structural Biomedicine, University of Algarve, Faro, Portugal
2CMQA-ADQ/FCT, University of Algarve, Faro, Portugal 3Centre for Biological and Chemical Engineering, Instituto Superior Técnico, Lisbon, Portugal
In recent years there has been an increased interest in using biosensors for the recognition and monitoring of molecule interactions. DNA sensors and gene chips are particularly relevant for directly applying the infor-mation gathered from the genome projects. In this work electrochemical techniques are used to develop methodologies to detect DNA polymorphisms in hu-man genes using cytochrome P450 3A4 (CYP3A4) as a model gene. CYP3A4*1B oligonucleotides were immo-bilized on the surface of a gold electrode and hybridized with fully complementary oligonucleotide sequences as well as with mismatched sequences corresponding to the CYP3A4*1A reference sequence. The methodol-ogy developed is based on double-stranded DNA’s abil-ity to transport charge along nucleotide stacking. The perturbation of the double helix pi-stack introduced by a mismatched nucleotide reduces electron flow and can be detected by measuring the attenuation of the charge transfer. The methodology developed could identify CYP3A4*1A homozygotes by the 5 µC charge attenua-tion observed when compared with DNA samples con-taining at least one CYP3A4*1B allele. Clin Chem Lab
Med 2003; 41(4):475 – 481
Key words: Biosensors; DNA sensors; Genotyping;
Sin-gle nucleotide polymorphism; Electrochemistry.
Abbreviations: CC, chronocoulometry; CV, cyclic
voltam-metry; CYP, cytochrome P450; ds, double-stranded; MB, methylene blue; ODN, oligonucleotide; PBS, phosphate buffered saline; RFLP, restriction fragment length poly-morphism; SNP, single nucleotide polypoly-morphism; ss, single-stranded.
Introduction
One of the greatest challenges of modern biomedicine is the integration of new genetic information into pro-cedures that can be implemented in rapid, cost effec-tive, and reliable methods to genotype and to identify
gene function, in order to be used as diagnostic tools in disease settings.
DNA sensors are particularly relevant for directly ap-plying the information gathered from genome projects and polymorphism databases. Such devices are ex-pected to have a considerable impact on diagnostic and health care in the near future since analysis through-puts can be increased several-fold with complete data standardization (1 – 3). Polymorphism identification, se-quence recognition, pathogen identification, expres-sion profiling, and mutation detection are examples of current applications of DNA sensors (4 – 11).
Briefly, in DNA sensors a solid surface (the sensor surface) is programmed with specific single-stranded DNA (ssDNA) sequences designed to probe samples and recognize particular gene loci through comple-mentary hybridization with target samples. The critical issue in DNA sensing is the generation of a sensitive and selective signal to measure the hybridization analysis result (12). In the majority of the current DNA sensor applications this is achieved indirectly by gath-ering a signal generated by specific reporter groups, usually a fluorescent molecule, used to label the target molecules. These approaches require labeling the samples with the reporter groups prior to the sensing reaction, which constitutes a common source of irre-producibility and contamination and is critical for the sensitivity of the overall analysis (12, 13). To avoid such bottlenecks, the use of methodologies to directly mea-sure the hybridization analysis results without involv-ing sample pre-treatment is desirable (12).
From such a perspective, interest in electrochemical detection of DNA hybridization has recently increased. The electrochemical activity of nucleotide residues in DNA and RNA (8, 14, 15), particularly adenine and gua-nine, as well as the long range ability of double-strand DNA (dsDNA) to transport charge through the double helix pi-stack (16 – 18), enable the direct and real-time transduction of hybridization reactions (9, 10).
Different electrochemical transducing methodolo-gies are described in the literature. Cyclic voltammetry (CV), square wave voltammetry and chronocoulometry (CC) are the most common techniques in the detection of hybridization reactions in gold, mercury, and carbon paste electrodes (6 – 15).
In this work electrochemical techniques are used to develop methodologies for detecting DNA polymor-phisms in human genes potentially involved in the modulation of individual cancer susceptibility as well as therapeutic efficacy. The electrochemical activity of a DNA intercalator is used to measure the variations on the charge transport through the DNA pi-stack occur-ring when mismatched nucleotides are present as in
*E-mail of the corresponding author: [email protected]
Electrochemical DNA Sensor for Detection of Single Nucleotide
Polymorphisms
the case of polymorphic locations (9, 10, 19). This DNA intercalator is reduced by the electron flow through DNA and releases the received electrons to an electro-chemically active compound in the solution. An elec-trochemical catalytic cycle is therefore generated that is fed by electron flow from the electrode (9, 10, 19) (Figure 1). To detect this electron flow the most conve-nient technique is CC (9, 10). In this technique a fixed reduction potential is applied to the electrode and the evolution of current with time is followed generating a signal. The integration of this signal gives the amount of charge exchanged in the process, which is signifi-cantly larger for the perfectly hybridized sequences when compared with sequences including one mis-matched nucleotide (9, 10).
A cytochrome P450 3A4 (CYP3A4) electrochemical DNA sensor was developed to identify the presence of variant *1B alleles. CYP3A4 is the main drug-metabo-lizing enzyme in human liver, being responsible for the biotransformation of at least 50% of the currently avail-able therapeutic drugs, such as antiarrhythmics, cyto-statics, and antimalarials (20, 21). CYP3A4*1B was the first variant described that has been proposed to affect the enzyme concentration, to be associated with ad-vanced stage prostate cancer (22), and to be protective for secondary cancer caused by leukemia chemother-apy (23).
Materials and Methods
All chemicals used were pro-analysis or equivalent purity grade. Oligonucleotides (ODNs) were purchased from Invitro-gen Corp. (Carlsbad, USA) or Hybaid (Interactiva Division, Ulm, Germany).
Preparation of DNA-modified gold electrodes
Single-stranded modified gold electrodes were prepared by immobilizing thiol-activated single-stranded oligonucleotides (ssODN, designated by probe) designed on the basis of the CYP3A4 gene sequence (Genbank accession number AF280107). The CYP3A4*1B 17-mer probe sequence was de-signed in order to locate the polymorphic locus (underlined nucleotide) in the probe center and to have a melting temper-ature close to 50 ºC. An additional requirement was the at-tachment of a mercaptohexyl group (-SH(CH2)6-) at the 5´ end to enable immobilization. The CYP3A4*1B 17-mer probe
se-quence used for immobilization is (5’-SH(CH2)6 -CCTCTCTCCT-GCCCTTG-3’)
A gold electrode (2 mm diameter, Metrohm, Herisau, Switzerland) was cleaned by polishing the surface with an electrode polishing kit (Metrohm, Herisau, Switzerland) con-taining alumina. After polishing, the electrode was sonicated for 5 min sequentially in a 65% (v/v) solution of nitric acid (Riedel-de-Haen, Seelze, Germany), acetone (Riedel-de-Haen, Seelze, Germany), and Milli-Q water. This cleaning procedure was performed prior to each immobilization.
Cleaned electrodes were immersed overnight in 100 µl of a 5 µM probe solution in 100 mM phosphate buffer containing 100 mM NaCl, pH 7 (PBS buffer). After immobilization, the electrode was rinsed with PBS buffer and then immersed in a 0.1 mM 2-mercapto-1-ethanol solution (Fluka, Buchs, Switzer-land) – mercaptoethanol – for 90 min and rinsed again with PBS buffer.
Double-stranded oligonucleotide (dsODN)-modified elec-trodes were prepared by hybridizing the ssODN-modified gold electrode with fully complementary (5’-CAAGGGCA-GGAGAGAGG– 3’) or single nucleotide mismatch sequence (5’-CAAGGGCAAGAGAGAGG-3’), corresponding to the
CYP3A4*1B and *1A alleles, respectively. Hybridization
reac-tions were performed in a 100 µl solution of 50 nM target ODN in PBS buffer for 270 min at room temperature.
Electrochemical measurements
CV and CC were performed using an Ecochemie Autolab PGSTAT 12 potentiostat, and the results were analyzed using the General Purpose Electrochemical System (GPES) soft-ware, version 4.8 (Ecochemie B.V., Utrecht, The Netherlands). A normal three-electrode configuration consisting of a modi-fied, gold disk, working electrode, a homemade Ag/AgCl ref-erence electrode, and a graphite counter electrode was used. The supporting electrolyte (PBS buffer) was deoxygenated via purging with nitrogen gas for 20 min, and the cell was blan-keted with nitrogen during the experiments. CV was per-formed between – 0.5 and 1.25 V at a 0.1 V/s scan rate, in 0 to 8 µM methylene blue (MB; Fluka, Buchs, Switzerland), and 0 to 2.5 mM potassium hexacianoferrate (III) (Merck, Darmstadt, Germany), hereafter designated ferrycianide. CC was per-formed with a – 0.4 V applied potential for 5 s, in 2 mM hexa-cianoferrate (III) and 8 µM MB.
Three independent electrochemical experiments, either CV or CC, were performed and average values, standard devia-tions, and 95% confidence intervals for the mean values were calculated.
Electrochemical detection of CYP3A4*1B in DNA samples
Genomic DNA was extracted from whole peripheral blood samples (24), obtained during regular medical check-ups upon informed consent and approval by the Ethical Boards of the involved clinical institutions. The samples were tested for the identification of the CYP3A4*1B single nucleotide poly-morphism (SNP), which corresponds to an A→G transition at – 392 bp upstream of the transcription initiation site (22). A 124 bp fragment, in which the polymorphic site is located in a cen-tral position, was amplified using the following primers (Invit-rogen Corp. Carlsbad, USA): forward, 5’-TGT GGC TTG TTG GGA TGA ATT TC-3’ and reverse, 5’-GGT TCT TAT CAG AAA CTC AAG TGG-3’. Amplification was carried out in a reaction mixture containing 2 µl of DNA (200 – 700 ng DNA), 1.5 mM MgCl2, thermophilic DNA polymerase buffer (50 mM KCl, 10 mM Tris-HCl, pH 9.0, 0.1% Triton X-100), 0.2 mM of the four deoxynucleotide triphosphates (Stratagene, La Jolla, USA), 2.5 units of Taq polymerase (Promega Corp., Madison, USA) Figure 1 Schematic representation of the electrocatalytic
cy-cle for a DNA intercalator (methylene blue; MB) and an elec-trochemically active compound (ferricyanide-[Fe(CN)6]3-) through DNA double helix. LB: leukomethylene blue.
and 0.6 µM of each primer. Touchdown PCR amplification was performed (Mastercycler 5332, Eppendorf, Germany) as fol-lows: denaturation at 94 ºC for 2 min, followed by 7 cycles of 30 s at 56 ºC, 15 cycles of 45 s at 53ºC, 5 cycles of 45 s decreas-ing 1 ºC/cycle from 52 ºC to 48 ºC, and 15 cycles 45 s at 48 ºC, and a final extension step for 2 min at 72 ºC. An aliquot was an-alyzed by polyacrylamide gel (8%) electrophoresis for 2 h at 200 V, to check for amplification efficiency and specificity.
The PCR product was diluted to a concentration of approxi-mately 50 nM in PBS buffer and denatured at 90 ºC for 2 min. After rapid cooling, the ssODN-modified electrode was im-mersed in the solution (100 µl) for 270 min, so that the ampli-con could hybridize with the immobilized probe. Electrochem-ical measurements, CV, and CC were carried out with the same parameters described above.
CYP3A4*1B detection by PCR-restriction fragment length polymorphism (RFLP) analysis
Amplification was performed in a reaction mixture containing 2 µl of template DNA, 0.6 µM of each primer (Invitrogen Corp., Carlsbad, USA), forward, 5’-AAT GAG GAC AGC CAT AGA GAC AAG GGC A-3’ and reverse, 5’-CAA TCA ATG TTA CTG GGG AGT CCA AGG G– 3’, 200 µM of each dNTP (Stratagene, La Jolla, USA), 1.5 mM MgCl2, thermophilic DNA polymerase buffer (50 mM KCl, 10 mM Tris-HCl, pH 9.0, 0.1% Triton X-100), and 2.5 U of Taq DNA polymerase (Promega Corp., Madison, USA). Thirty cycles of amplification were performed including 45 s denaturation at 94 ºC, 45 s annealing at 59 ºC, and 45 s ex-tension at 72 ºC. The PCR product (122 bp) was digested with 5 U MvaI (Fermentas, Vilnius, Lithuania) for 3 h, at 37 ºC, and analyzed by electrophoresis as before.
Results and Discussion Gold electrode modification
DNA electrochemical sensors were prepared by im-mersing the clean electrode overnight in 100 µl of a 5 µM solution of thiol-terminated ODNs. Chemi-ad-sorption of thiol onto the gold surface is a fast process, completed in 240 min (25), and leads to the formation of densely packed monolayers with immobilized ODNs oriented in an upright position with respect to the elec-trode surface (25 – 27). The modified elecelec-trode was then immersed in a mercaptoethanol solution in order to re-move unbound ssODN as well as to promote correct ssODN-surface orientation (25 – 27), and the dsODN modified electrode was obtained by immersing the ssODN-modified electrode in the target solution allow-ing complementary hybridization to occur.
CV in PBS buffer was therefore performed as a con-trol assay for the immobilization of ODNs and for the follow-up of electrode hybridization and denaturation. As shown in Figure 2, two peaks are present that corre-spond to the gold oxide formation at the electrode sur-face (approximately 1.1 V) and the respective reduction peak (approximately 0.4 V) (28). Their intensities and peak potentials change according to the modification due to the different electrode surface status (Figure 2). The higher intensity observed for the modified elec-trodes suggests that higher amounts of oxides are formed at the electrode surface, which could be due to the higher electrostatic attraction of metal ions by the
negatively charged ODN layer (28). The intensity of these peaks, however, decreased for the double-stranded modified electrode. Although higher negative charges are present near the electrode surface, dsODN-modified electrodes are also more hindered and thus less surface space is available for the accumulation of metal ions (28). The different intensities of the oxide peaks, especially the reduction peak, thus enable a clear indication of electrode surface status, clean or modified with ODN, as well as the identification of the species immobilized (ss or dsODN).
Electrochemical genotyping – method development
In order to assess the potential identification of poly-morphisms through charge transport along the dsODN film, a catalytic electrochemical cycle was generated using a DNA intercalator (MB) and a solution-borne electron acceptor (ferricyanide; Figure 1) MB is a DNA intercalator with pronounced electrochemical re-sponse (reduction potential: – 0.33 V). It binds at the top of the immobilized dsODN film and is reduced by re-ceiving the electrons flowing from the electrode sur-face through the DNA pi-stack (9, 10, 29). Leukomethyl-ene blue (LB), which is the reduced form of MB, will then release the received electrons to reduce solution-borne ferricyanide, returning to the initial oxidized form (MB). The cycle continues as long MB can be re-duced by electron flow, and is independent of the con-centration of the involved species. Mismatched nu-cleotides lead to base stacking interruptions and are expected to have a pronounced effect on the observed catalytic cycle due to the diminished electron flow through the DNA film.
Ferricyanide is a negatively charged, electrochemi-cally active compound and therefore is expected to be repelled from the negatively charged dsODN film. Fer-ricyanide is expected to be kept away from the elec-trode surface and only residual electrochemical peaks should be observed in CV. However, the ferricyanide reduction/oxidation peaks at 0.20 V and 0.06 V, respec-tively, observed in CV at dsODN-modified electrodes (Figure 3A), are an indication that electrons are ex-changed between solution-ferricyanide and the
elec-Figure 2 Cyclic voltammograms in buffer at bare gold elec-trodes (curve A), gold elecelec-trodes modified with ssODN (curve B), and dsODN (curve C).
trode surface. The peaks’ intensity is linearly correlated with ferricyanide concentration and is independent of the MB concentration (Figure 3B).
CC can be used to monitor the electrochemical cat-alytic cycle described above if the applied potential is sufficient to guarantee the continuous reduction of the intercalated MB. In CC, a fixed reductive potential is ap-plied to the electrode and current evolution within a certain time interval is integrated to obtain the charge involved in the electrochemical process.
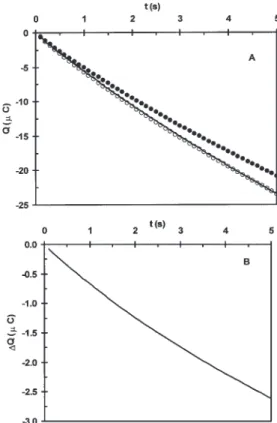
ODN-modified electrodes were hybridized with fully complementary and mismatched synthetic ODN tar-gets, and CC at – 0.40 V of 2 mM ferricyanide in the pres-ence of 8 µM MB was performed (Figure 4A). As ob-served, the presence of a mismatched nucleotide leads to a significant 2.6 µC charge attenuation (Figure 4A) that increases linearly with time (Figure 4B). This is in-dicative of the diminished DNA-mediated electron transfer efficiency as a result of the local base stack per-turbation (9, 10). Owing to the poor base stack, MB is not efficiently reduced to generate and to maintain the electrochemical catalytic cycle, which is reflected by re-duced charge accumulation in CC (9, 10).
Charge accumulation (Q) at ssODN-modified elec-trodes was also examined. As shown in Figure 4A, this was the case with lower charge accumulation. This is an expected result since a monolayer of mercap-toethanol is formed at the electrode surface after ODN
immobilization in order to saturate the unoccupied sur-face space. The CC activity at ssODN-modified elec-trodes demonstrates that the monolayer formed was not able to completely block the electrochemical activ-ity of ferricyanide. Ferricyanide and MB can diffuse to the electrode surface, and direct catalysis, not DNA-mediated, occurs (9). The different charge transfer mechanisms are clearly demonstrated by the different slope and shape observed for the curves obtained when using single- and double-stranded ODN-modi-fied electrodes (9) (Figure 4). In some cases, however, the curve obtained for the ssODN-modified electrode had a similar magnitude to the perfectly matched hy-brid (data not shown). This was interpreted as evidence of the formation of an imperfect monolayer containing holes where the gold surface is exposed to the buffer.
The electrode surface status, i.e., single- or double-stranded modification, was always assessed by the analysis of the gold oxide reduction peak (≈0.4 V) using CV (Figure 2), performed prior the CC experiments. This enabled the evaluation of the success of the hy-bridization and avoided misinterpretation due to false positives owing to possible hybridization failure.
In order to assess the method’s ability to discriminate between homo- and heterozygotes, a solution of equal amounts of fully complementary and mismatch ODNs was prepared and hybridized to an ssODN-modified electrode. As expected, accumulated charges were
sit-Figure 3 (A) Cyclic voltammograms for increasing ferri-cyanide concentration at dsODN-modified electrodes in PBS buffer. (B) Ferricyanide reduction peak intensity variation with ferricyanide concentration at dsODN-modified electrodes in PBS buffer containing 0 µM (open circles); 0.25 µM (dark dia-monds); 0.5 µM (open diadia-monds); 1.0 µM (dark triangles); 2.0 µM (open triangles), and 4.0 µM (dark circles) methylene blue.
Figure 4 (A) Chronocoulometry at – 0.4 V for 5 s in 2.0 mM of ferricyanide and 8 µM MB+ for ssODN-modified electrode (solid line), ssODN-modified electrode hybridized with fully complementary oligonucleotide (open circles), and ssODN-modified electrode hybridized with mismatched oligonu-cleotide (closed circles). (B) Accumulated charge difference for fully complementary and mismatched samples.
uated between the two limits of fully complementary and mismatched ODNs (Figure 4A), suggesting that the method developed has the potential to discriminate heterozygotes.
Electrochemical genotyping – method validation and testing
In order to develop an alternative method for genotyp-ing, the methodology must be validated with samples previously genotyped by standard methods (e.g., PCR/RFLP). As such, ODN primers were designed to amplify a 124 bp fragment of the CYP3A4 gene locating the targeted polymorphic loci in the amplicon center. Amplicons obtained from genomic DNA samples were genotyped by RFLP (Figure 5) and hybridized to ssODN-modified electrodes. After washing the elec-trode to remove unhybridized DNA, CV in buffer was performed to investigate the type of the monolayer film at the electrode surface (i.e., single- or double-stranded DNA film), and electrochemical genotyping was performed by measuring the charge accumulation (Q) after 5 s in 2 mM ferricyanide and 8 µM MB.
Figure 6 shows the characteristic charge accumu-lated at the electrode surface after 5 s for homozygotes for CYP3A4*1A (genotype *1A/*1A) and CYP3A4*1B (genotype *1B/*1B) variants, as well as for heterozy-gotes for the mutation (genotype *1A/*1B). Since the immobilized ODN (probe) was designed in order to be fully complementary for the *1B variant, mismatched hybrids were obtained after hybridizing the electrode
with *1A samples. Therefore, samples presenting less charge accumulation correspond to *1A samples. As previously mentioned, for heterozygotes the ratio of fully complementary/mismatch is equal. This is re-flected in CC by the intermediate overall charge accu-mulation observed (Figure 6).
The 95% confidence intervals for the mean charge accumulated (Q) at the electrode surface after 5 s for triplicate chronocoulometric measurements of previ-ously genotyped DNA samples are presented in Table 1. As shown (Table 1), the electrochemical geno-typing methodology can distinguish CYP3A4*1A ho-mozygotes, CYP3A4*1A/CYP3A4*1B heterozygotes, and CYP3A4*1B homozygotes. The 95% confidence in-tervals for the mean of the average charge accumu-lated at the electrode surface are Qm= – 26.5 ± 0.07 µC,
Qm= – 30.8 ± 0.06 µC, and Qm= – 33.59 ± 0.02 µC for *1A
homozygotes, *1A/*1B heterozygotes, and *1B ho-mozygotes, respectively. These values correspond to
Figure 5 Polyacrylamide gel (8%) of a typical RFLP analysis. PCR products were analyzed before (–) (lane 2) and after (+) di-gestion with MvaI.Typical restriction patterns are shown for
CYP3A4*1A/*1A, *1A/*1B, and *1B/*1B genotypes. MvaI
di-gestion of the 122 bp PCR product gives rise to two fragments (97 bp and 25 bp) in the CYP3A4 *1B variant. MW: molecular weight marker: Φx174 digested with HinfI.
Figure 6 Chronocoulometry at – 0.4 V for 5 s in 2.0 mM of ferrycianide-and 8 µM MB+ at ssODN-modified electrode hybridized with CYP3A4*1B homozygotes (open triangles),
CYP3A4*1B/*1A heterozygotes (closed squares), and
CYP3A4*1A homozygotes (closed circles).
Table 1 95% Confidence intervals for the mean charge accu-mulated (Q ±σ) at the electrode surface for previously geno-typed samples by RFLP and 95% confidence intervals for the mean of the average charge accumulated (Qm±σm) for
CYP3A4*1A homozygotes, CYP3A4*1A/CYP3A4*1B
heterozy-gotes, and CYP3A4*1B homozygotes.
Sample RFLP Q±σ Qm±σm genotyping (µC) (µC) # 1 *1A/*1A – 27.89 ± 0.01 – 26.5 ± 0.07 # 2 *1A/*1A – 23.7 ± 0.06 # 3 *1A/*1A – 25.54 ± 0.04 # 4 *1A/*1A – 27.6 ± 0.06 # 5 *1A/*1B – 30.22 ± 0.03 – 30.8 ± 0.06 # 6 *1A/*1B – 30.18 ± 0.02 # 7 *1A/*1B – 29.13 ± 0.04 # 8 *1A/*1B – 33.91 ± 0.02 # 9 *1A/*1B – 31.30 ± 0.03 # 10 *1B/*1B – 33.59 ± 0.02 – 33.59 ± 0.02
7.1 ± 0.09 µC and 2.8 ± 0.08 µC decreases for *1A ho-mozygotes and *1A/*1B heterozygotes, respectively, when compared with the fully complementary hybrid formed at the electrode surface for *1B homozygote samples. Although these are significant differences, only one previously genotyped *1B homozygote sam-ple was available for method validation (Table 1). Therefore, in order to ensure statistical significance of sensors’ sample classification, electrochemical geno-typing methodology was used to distinguish *1A ho-mozygotes from samples containing at least one *1B allele (i.e., heterozygotes or homozygotes for the poly-morphism). Electrochemical sample classification was performed on the basis of normal distributions with the (average; standard deviation) parameters (26.5; 1.91) and (31.4; 1.95) for CYP3A4*1A homozygotes (vali-dated with 4 samples and 12 independent measure-ments; Table 1) and for samples containing at least one
*1B allele (validated with 6 samples and 18
indepen-dent measurements; Table 1), respectively.
A blind assay was performed to test the methodol-ogy developed. Sixteen samples were genotyped inde-pendently by the electrochemical method and by RFLP (Table 2). Both electrochemical and RFLP genotyping gave similar results for CYP3A4*1A homozygotes con-sidering two possible classifications: *1A homozy-gotes and samples containing at least one *1B allele. This discrimination failed only for one case (sample #17, Table 2), corresponding to a 6.25% failure fre-quency (Table 2).
In summary, an electrochemical genotyping method-ology was developed with synthetic ODNs, validated with previously genotyped DNA samples and tested with DNA extracted from human subjects. The method-ology developed was able to identify CYP3A4*1A
ho-mozygotes as well as samples containing at least one
CYP3A4*1B allele. Furthermore, the method is fast (5 s)
and reproducible. However, at this stage the method was not able to differentiate CYP3A4*1B homo- and heterozygotes. This apparent failure is due to poor dis-criminating power owing to the proximity of the accu-mulated charge curves for homozygotes *1A and *1B. Efforts are being undertaken to further optimize the methodology in order to enable full genotyping capac-ity by discriminating homozygotes and heterozygotes.
Acknowledgements
This work was partially supported by Fundação para a Ciência e a Tecnologia, Ministério da Ciência e Ensino Superior (Pro-ject POCTI/ESP/39589/01).
References
1. Graber JH, O´Donnel MJ, Smith CL, Cantor CR. Advances in DNA diagnostics. Curr Opin Biotechnol 1998; 9:14 – 8. 2. Wang J. From DNA biosensors to gene chips. Nucleic
Acids Res 2000; 28:3011 – 6.
3. Lipshutz RJ, Fodor SPA, Gingeras TR, Lockhart DJ. High density synthetic oligonucleotide arrays. Nat Genet 1999; 21:20 – 4.
4. Lockhart DJ, Winzeler EA. Genomics, gene expression and DNA arrays. Nature 2000; 405:827 – 35.
5. Hirschhorn JN, Sklar P, Lindblad-Toh K, Lim Y, Ruiz-Gutier-rez M, Bolk S, et al. SBE-TAGS: an array-based method for efficient single-nucleotide polymorphism genotyping. Proc Natl Acad Sci USA 2000; 97:12164 – 9.
6. Jiang M, Wang J. Recognition and detection of oligonu-cleotides in the presence of chromosomal DNA based on entrapment within conducting-polymer networks. J Elec-troanal Chem 2001; 500:584 – 9.
7. Wang J, Polsky R, Xu D. Silver-enhanced colloidal gold electrochemical stripping detection of DNA hybridisation. Langmuir 2001; 17:5739 – 41.
8. Zhou L, Rusling JF. Detection of chemically induced DNA damage in layered films by catalytic square wave voltam-metry using Ru(Byp)32 +. Anal Chem 2001; 73:4780 – 6. 9. Boon EM, Ceres DM, Drummond TG, Hill MG, Barton JK.
Mutation detection by electrocatalysis at DNA-modified electrodes. Nat Biotechnol 2000; 18:1096 – 100.
10. Kelly SO, Boon EM, Barton JK, Jackson NM, Hill MG. Sin-gle-base mismatch detection based on charge transduc-tion through DNA. Nucleic Acids Res 1999; 27:4830 – 7. 11. Xu C, Cai H, He P, Fang Y. Electrochemical detection of
se-quence specific DNA using DNA probe labelled with aminoferrocene and chitosan modified electrode immobi-lized with ssDNA. Analyst 2001; 126:62 – 5.
12. Willner I, Wilner B. Biomaterials integrated with electronic elements: en route to bioelectronics. Trends Biotechnol 2001; 19:222 – 30.
13. Hianik T, Gajdos V, Krivaneck R, Oretskaya T, Metelev V, Volkov E, et al. Amperometric detection of DNA hybridiza-tion on gold surface depends on the orientahybridiza-tion of oligonu-cleotide chains. Bioelectrochemistry 2001; 53:199 – 204. 14. Palecek E, Fojta M. Detecting DNA hybridization and
dam-age. Anal Chem 2001; 73:75A-83A.
15. Jelen F, Fojta M, Palecek E. Voltammetry of native double-stranded, denatured and degraded DNAs. J Electroanal Chem 1997; 427:49 – 56.
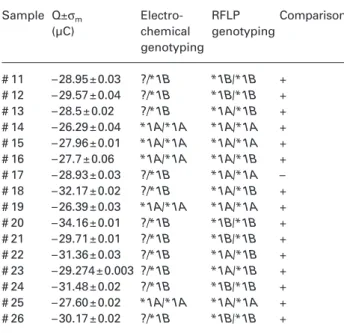
Table 2 Electrochemical and RFLP genotyping comparison. Sample Q±σm Electro- RFLP Comparison
(µC) chemical genotyping genotyping # 11 – 28.95 ± 0.03 ?/*1B *1B/*1B + # 12 – 29.57 ± 0.04 ?/*1B *1B/*1B + # 13 – 28.5 ± 0.02 ?/*1B *1A/*1B + # 14 – 26.29 ± 0.04 *1A/*1A *1A/*1A + # 15 – 27.96 ± 0.01 *1A/*1A *1A/*1A + # 16 – 27.7 ± 0.06 *1A/*1A *1A/*1B + # 17 – 28.93 ± 0.03 ?/*1B *1A/*1A – # 18 – 32.17 ± 0.02 ?/*1B *1A/*1B + # 19 – 26.39 ± 0.03 *1A/*1A *1A/*1A + # 20 – 34.16 ± 0.01 ?/*1B *1B/*1B + # 21 – 29.71 ± 0.01 ?/*1B *1B/*1B + # 22 – 31.36 ± 0.03 ?/*1B *1A/*1B + # 23 – 29.274 ± 0.003 ?/*1B *1A/*1B + # 24 – 31.48 ± 0.02 ?/*1B *1B/*1B + # 25 – 27.60 ± 0.02 *1A/*1A *1A/*1A + # 26 – 30.17 ± 0.02 ?/*1B *1B/*1B +
Genotypes are identified; (?) indicates failure in identifying the allele. Comparison is based upon identification of CYP3A4*1A homozygotes or samples containing at least one *1B allele.
16. Giese B, Spichty M, Wessely S. Long-distance charge transport through DNA: an extended hopping model. Pure Appl Chem 2001; 73: 449 – 53.
17. Fink HW, Schönenberger C. Electrical conduction through DNA molecules. Nature 1999; 398:407 – 10.
18. Berlin YA, Burin AL, Ratner MA. Charge hopping in DNA. J Am Chem Soc 2001; 123:260 – 8.
19. Jackson NM, Hill MG. Electrochemistry at DNA-modified surfaces: new probes for charge transport through the double helix. Curr Opin Chem Biol 2001; 5:209 – 15. 20. Michalets EL. Update: clinically significant cytochrome
P450 drug interactions. Pharmacotherapy 1998; 18:84 – 112. 21. Ducharme J, Farinotti R. Clinical pharmacokinetics and metabolism of cloroquine. Focus on recent advancements. Clin Pharmacokinet 1996; 31:257 – 74.
22. Rebbeck TR, Jaffe JM, Walker AH, Wein AJ, Malkowicz SB. Modification of clinical presentation of prostate tumors by a novel genetic variant in CYP3A4. J Natl Cancer Inst 1998; 90:1225 – 9.
23. Felix CA, Walker AH, Lange BJ, Williams TM, Winick NJ, Cheung NV, et al. Association of CYP3A4 genotype with treatment-related leukemia. Proc Natl Acad Sci USA 1998; 95: 13176 – 81.
24. Innis MA, Gelfand DH, Sninsky JJ, White TJ. PCR proto-cols – a guide to methods and applications. London: Acad-emic Press, 1990:482 pp.
25. Herne TM, Tarlov MJ. Characterization of DNA probes im-mobilized on gold surfaces. J Am Chem Soc 1997; 119: 8916 – 20.
26. Steel AB, Herne TM, Tarlov MJ. Electrochemical quantifi-cation of DNA immobilized on gold. Anal Chem 1998; 70: 4670 – 7.
27. Kelly SO, Barton JK, Jackson NM, McPearson LD, Potter AB, Spain EM, et al. Orienting DNA helices on gold using applied electric fields. Langmuir 1998; 14:6781 – 4. 28. Hong C, Chun X, Pingang H, Yuzhi F. Colloid Au-enhanced
DNA immobilization for the electrochemical detection of sequence specific DNA. J Electroanal Chem 2001; 510:78 – 85.
29. Kelly SO, Barton JK. Electrochemistry of methylene blue bound to a DNA-modified electrode. Bioconjugate Chem 1997; 8:31 – 7.
Received 2 December 2002, revised 28 February 2003, accepted 6 March 2003
Corresponding author: Dr. Guilherme N.M. Ferreira, FERN, University of Algarve, Campus de Gambelas, 8005-139 Faro, Portugal
Phone: + 351 289 800 900, Fax: + 351 289 81 84 19, E-mail: [email protected]