FAMILY BUSINESS IN PORTUGAL: ANALYSIS OF THE FINANCIAL
INDICATORS EVOLUTION
Raquel Martins Galupa
Dissertation submitted as partial requirement for the conferral of the Master in Business Administration
Supervisor:
Prof.ª Alexandra Fernandes, Auxiliar Professor at ISCTE Business School
Abstract
The impact that family firms have on the economy of a country has been quiet relevant. A great part of the companies all over the world is family business. Moreover, these firms have a significant influence on the countries’ gross domestic product, employment rates and consumer price index. Therefore, family business has been of great interest by researchers.
The family business definition, objectives and goals, performance and financial structure are aspects that have been under study for several years. Furthermore, one of the main subjects is the differences and similarities between family firms and non-family firms. Authors from distinct countries have analysed if family companies outperform or underperform non-family ones, and the impact that the family has on the business performance.
This thesis aims to analyse the evolution of financial indicators in Portuguese companies between 2010 and 2016. Considering the existing gap in this field, this research was developed with the data given by the Associação das Empresas Familiares. This Portuguese association intends to support and defend the family firm’s interests. Accordingly, it is interesting for this organization to have studies about its associates.
The data extraction resulted in a population of 450 family companies. In order to understand better this population, an exploratory data analysis was done. Then, the financial evolution of these firms along the seven years was studied. Finally, the conclusions about the progress and financial development of these businesses were made.
Keywords: Family Business, Financial Indicators, Financial evolution, Portuguese companies JEL Classification: G30; M10.
Resumo
O impacto que as empresas familiares têm na economia de um país tem sido notável. Uma grande parte das empresas do mundo são empresas familiares. Além disso, estas firmas têm uma influência significativa no produto interno bruto, nas taxas de emprego e no índice de preços ao consumidor de todos os países. Por consequência, os investigadores sempre demonstraram ter bastante interesse nas empresas familiares.
A definição de empresa familiar, os objetivos, o desempenho e a estrutura financeira destas empresas são assuntos estudados há vários anos. Ademais, um dos principais temas é o estudo das diferenças e semelhanças entre empresas familiares e não familiares. Autores de diferentes países analisaram a comparação de desempenho entre estes dois tipos de empresas e o impacto que a família tem sobre o mesmo.
O objetivo desta tese é analisar a evolução de indicadores financeiros de empresas familiares Portuguesas entre 2010 e 2016. Considerando a falta de informação sobre este assunto, este estudo foi desenvolvido com os dados fornecidos pela Associação das Empresas Familiares. Esta associação Portuguesa tem o propósito de apoiar e defender os interesses das firmas familiares. Por esse motivo, torna-se interessante para esta organização que existam estudos sobre os seus associados.
A extração dos dados resultou numa população de 450 empresas. Com o objetivo de perceber melhor esta população, uma análise exploratória foi realizada. De seguida, foi estudada a evolução financeira destas empresas ao longo dos sete anos. Finalmente, as conclusões sobre o progresso e desenvolvimento financeiro destas empresas foram feitas.
Keywords: Empresas Familiares, Indicadores Financeiros, Evolução Financeira, Empresas Portuguesas
Acknowledgements
The concretization of this dissertation would be far more difficult without the support and motivation of the people who accompanied in this journey. Hence, I would like to show my gratitude to these important people.
First of all, to my supervisor professor Alexandra Fernandes. For the commitment, the knowledge shared, the valuable feedback, the support through this research and the opportunity to participate in this study.
To the Associação de Empresas Familiares for sharing its information and for making this dissertation possible to happen.
To my family who always inspired me and gave me motivation to finish this academic journey. Especially to my parents who always encouraged me to be better.
Index
1. Introduction ... 1
2. Literature Review ... 3
2.1. Family Business Definition ... 3
2.1.1. Objectives and Goals ... 4
2.1.2. Succession ... 5
2.1.3. Family Firms VS Non-Family Firms ... 7
2.2. Financial Structure ... 10
2.2.1. Performance... 13
2.2.2. Financial indicators ... 15
2.2.3. Comparison between family business and non-family business financial structure .... 17
2.3. Family Business in Portugal ... 18
3. Research Design ... 20
3.1. Introduction ... 20
3.2. Associação das Empresas Familiares ... 20
3.3. Data Collection... 21
3.4. Data Selection ... 22
4. Data analysis ... 24
4.1. Introduction ... 24
4.2. Exploratory data analysis ... 24
4.2.1. AEF Universe growth ... 25
4.2.2. AEF Universe Size ... 26
4.2.3. Geographical distribution of the AEF Universe ... 28
4.3. Evolution of financial indicators ... 31
4.3.1. Debt Ratio... 31
4.3.2. Debt to equity ratio ... 33
4.3.3. Return on assets ... 34 4.3.4. Current ratio ... 37 5. Conclusion ... 39 6. Limitations ... 41 7. References ... 42 8. Appendix ... 53
List of Equations
Equation 1 – Debt ratio ... 31
Equation 2 – The debt to equity ratio of the AEF Universe ... 33
Equation 3 – Return on Assets formula ... 35
Equation 4 – Current ratio formula ... 37
List of Figures
Figure 1 – Use of financial indicators with continuous quality improvement to improve organizational capacity ... 16Figure 2 – The geographical distribution of the AEF Universe... 28
List of Graphics
Graphic 1 – Family owned companies have outperformed non-family owned companies since 2006... 9Graphic 2 – The growth of the AEF Universe ... 25
Graphic 3 – Size of the AEF Universe... 27
Graphic 4 – The industries of the AEF Universe ... 30
Graphic 5 – The debt ratio of the AEF Universe ... 32
Graphic 6 – The debt to equity ratio of the AEF Universe ... 33
Graphic 7 – ROA of Large firms ... 35
Graphic 8 – ROA of Medium firms ... 36
Graphic 9 – ROA of Small firms ... 36
Graphic 10 – ROA of Micro firms ... 36
List of Graphics in the Appendix
Graphic A1 – Where is generated more and less wealth? ... 54
List of Tables
Table 1 – Debt/Equity Level ... 11Table 2 – Return on sales distribution ... 14
Table 3 – Return on equity distribution ... 14
Table 4 – The financial ratios groups ... 16
Table 5 – SME Definition ... 27
Table 6 – Corporate tax rates table ... 35
List of Tables in the Appendix
Table A1 – Best performing families in Europe using sector relative total shareholder returns on a 3-year, 5-year and 10-year basis ... 53List of Abbreviations
AEF – Associação das Empresas Familiares CEO – Chief Executive Officer
EBIT – Earnings Before Interests and Taxes
EBITDA - Earnings Before Interests, Taxes, Depreciation and Amortization EU – European Union
GDP – Gross Domestic Product INE – Instituto Nacional de Estatística ROA – Return On Assets
ROE – Return On Equity ROS – Return On Sales
SABI – Sistema de Análise de Balanços Ibéricos SME – Small and Medium-sized Enterprises
1
1.
Introduction
Nowadays family firms have a really important role in the economy and development of industrialized countries (Zahra & Sharma, 2004). In fact, it is said that family business dominates the major economies of the world (Astrachan & Shanker, 2003; Morck & Yeung, 2003; Heck & Stafford, 2001). Besides, Gersick et al., (1997) affirms that two thirds of the companies all over the world are family owned or managed.
Considering these facts, the interest in the study of family firms has increased along the years, leading scholars to do better and deeper investigation in this field (Kraus et al., 2011). Authors have studied the definition of these companies, what makes them valuable, their competitive advantages and disadvantages, their impact on global economy and the differences between them and non-family firms. However, there is still only a few literature about the financial structures of these companies and the financing decisions that they make (López-Gracia & Sánchez-Andújar, 2007).
Having this in mind, it is important to develop studies that evaluate and measure the financial indicators of these companies. Not only the owners, managers and employees of a company are interested on the financial indicators of a firm, but also potential creditors or partners (Kotane & Kuzmina-Merlino, 2012). Financial indicators are important to analyse the performance of a business and its financial state (Chen, & Shimerda, 1981).
Furthermore, the literature about family companies in Portugal is still very limited. According to Peter Villax (2019),seventy percent of the companies in Portugal are family firms. Obviously, this demonstrates that family business has a great impact on the Portuguese economy. Therefore, it should be a subject of farther interest and greater investigation.
This thesis aims to understand and demonstrate how Portuguese family business evolved, in financial terms, between 2010 and 2016. The study of the financial indicators makes it possible to comprehend the companies’ development and how are they performing.
In order to meet the purpose of the research, this dissertation was divided in six different chapters. The first chapter is this one – the Introduction – which presents the theme under study, some of the reasons why this topic is relevant, the objective behind the research and, finally, the structure of this dissertation. The second chapter is the Literature Review, which is divided in different
2 subtopics. Firstly, the different definitions of family business are introduced and it is shown how there is still so much disagreement on this concept. Then, the objectives, the goals and the succession in family companies is discussed. At the end of this subtopic, the similarities and differences between family firms and non-family firms are exposed. The second subtopic is the financial structure of this kind of companies. In this chapter different researches regarding the capital structure, the financing preferences and the performance of these companies are presented. Besides, financial indicators are defined and it is also explained its importance. Then, a comparison between the financial structure of family business and non-family business is made. Finally, it is presented the few literature that exists about family companies in Portugal. The third chapter - the Research Design – describes how the data was handled, the types of analysis done, it presents the AEF, explains how the data was collected and how the population was selected. This section is divided in four subtopics: the Introduction, the presentation of the AEF, the Data Collection and the Data Selection. The forth chapter presents the Data Analysis of this dissertation. Firstly, a brief introduction of what is written in this section is done. Secondly, it is shown the exploratory analysis, which is composed by the evaluation of the populations growth, its size, its geographical distribution and the industries that the companies work for. Finally, it is studied the evolution of four financial indicators on these family firms. After doing the data analysis, it is possible to make conclusion about the subject, which is included in the fifth chapter – the Conclusions. Lastly, the sixth chapter is the Limitations encountered in the development of this thesis.
3
2.
Literature Review
2.1. Family Business Definition
A significant amount of studies about family business has already been written. The interest on this field continues to increase, which is really important to its development and progress (Sharma, 2004). Scholars keep studying and writing articles about family firms because there is a huge amount of evidence showing that this type of business will continue to grow and develop, according to Klein (2000), Morck and Yeung (2003), Astrachan & Shanker (2003) and Heck & Stafford (2001).
Nowadays there is still no agreement on the definition of family business. As stated by Wortman (1995), there is more than twenty definitions. Most of it seems to be about the imperative role of the family members in making decisions, their presence in the day-to-day operations, in defining the vision and controlling the mechanisms used by the firm.
According to the European Commission (2019), a family business is defined by the following points:
«The majority of decision-making rights are in the possession of the natural person(s) who established the firm, or in the possession of the natural person(s) who has/have acquired the share capital of the firm, or in the possession of their spouses, parents, child, or children’s direct heirs.
The majority of decision-making rights are indirect or direct.
At least one representative of the family or kin is formally involved in the governance of the firm.
Listed companies meet the definition of family enterprise if the person who established or acquired the firm (share capital) or their families or descendants possess 25 per cent of the decision-making rights mandated by their share capital. »1
Chua & Chrisman (1999:25) propose that family business can be defined as «a business governed
and/or managed with the intention to shape and pursue the vision of the business held by a
1 Retrieved from: https://ec.europa.eu/growth/smes/promoting-entrepreneurship/we-work-for/family-business_en, at
4
dominant coalition controlled by members of same family or a small number of families in a manner that is potentially sustainable across generations of the family or families».
An alternative given by Astrachan & Shanker (2003), considers three different operational definitions for family firms. Their wide definition utilizes the criteria of family’s voting detainment over the strategic direction of a company. The mid-range definition, besides the retention of such vote control, includes firms with direct family involvement in the day-to-day operations. The last and the more rigorous definition classifies companies as family firms only if the family has the voting control and multiple generations of family members are part of the day-to-day processes of the firm.
In opposition, Villalonga & Amit (2009) state that operational definitions do not quite separate the two types of firms, because companies with the same degree of family involvement may or may not perceive themselves as family firms.
Habbershon & Williams (1999) and Habbershon et al. (2003) established a different concept named “familiness”, which is based on the resource-based view of the firm. This notion distinguishes family firms from non-family firms by the presence of unique resources and capabilities emerging from the involvement and interactions between family members.
Furthermore Chrisman et al. (2005) established two different approaches: the involvement and the essence approach. The most common criteria used in the first one includes governance or directorship, ownership, management and the participation of multiple family generations. Whereas the essence approach is based on the purpose of family succession, the firm’s unique resources, maintaining socio-emotional value and self-identification as a family firm. In fact, the components of involvement may be used to distinguish family firms from non-family firms and the essence components may be utilized to differentiate types of family companies (Chrisman et al. 2012; Hoy & Sharma, 2010).
2.1.1. Objectives and Goals
On the subject of family firm’s objectives and goals, Sharma & Chrisman (1996) affirmed that, even though firm-value maximization is typically the primary and only goal for publicly held companies, for family firms this is believed to be untrue.
5 Regarding family companies, Chrisman et al. (2003) agree that goals and objectives can be directed towards the family interests or those of the business. Accordingly, they stated that researchers should not focus mainly on economic goals (Sirmon & Hitt, 2003) but they should also include non-economic goals such as maintaining socio-emotional wealth and providing career opportunities for relatives (Gómez-Mejía et al. 2007).
Dunn (1995), File & Prince (1994) and Singer & Donoho (1993) affirmed that family and business centred goals can coexist within the family business and therefore managers must be capable to balance the priorities and needs of them both.
Despite of the idea that succession is one of the main important goals to family firms, Tagiuri & Davis (1992) found the following six goals to be the most important ones: to have a firm where employees can be happy and productive; to develop new quality products; to provide job security; to provide financial security and benefits for the owner; to serve as a vehicle for personal growth, social advancement and autonomy; and to promote good citizenship.
Considering these studies, it is evident that family firms are more likely to have complex, multiple and changing goals, rather than just one simple and constant purpose.
2.1.2. Succession
A significant number of studies have been written regarding the succession in family firms (Dyer & Handler, 1994). Researches have demonstrated the importance of this subject and studied the best practices in this phenomenon (Bird et al., 2002; Sharma & Chrisman, 1996; Wortman, 1995). According to Astrachan & Allen (2002), the majority of family firm leaders prefer to maintain family control, after leaving the company. Although some thought that this idea of family succession was due to the tendency of family firms towards nepotism, recent studies (Sharma, 2004; Burkart et al., 2003; Lee et al., 2003) show that such preference can be rational and effective when:
The legal system grants low shareholder protection, in order to create inefficiency if ownership and control are separated;
The family acquires good reputation and other benefits in retaining the control within the family;
6 The competitive advantage is based on the unique and personal knowledge that can only
be transmitted to family members or trustworthy non-family members.
Some authors explain why the sequence, technique, timing and communication between the predecessor and successor are so important in the process of a well succeeded intergenerational transition (Dyck et al., 2002). Furthermore, studies based on the resource-based view of a firm demonstrate the huge impact that the transfer of important knowledge (Cabrera-Suárez, Saá-Pérez, & García-Almeida, 2001), the passion (Anderson et al., 2003), the networks and relationships (Steier, 2001) and the original minds (Litz & Kleysen, 2001) across the family generations have on firm’s success.
Regarding the positive influence that succession has on the performance of a company, George et al., (2005) and Fernández & Nieto (2005) concluded that when new generations become a part of the business, wealth increases and it becomes more important to have an innovative strategy. Contrariwise, efforts have also been made to understand why some successions fail – successor dismissal or company bankruptcy – (Dyck et al., 2002; Miller et al., 2003). The most factual reason for the succession failure is the disagreement between the firm’s past and future, which can have three different causes: conservative pattern (willing to maintain the company the same as it was in the past); rebellious (the rejection of what the firm was in the past); and wavering (the fail in aligning the future and the past) (Miller et al., 2003). Additionally, Beckhard & Dyer (1983) affirmed that the conflicts between family are the principal factor to contribute to business stagnation or even failure.
Bennedsen et al. (2006) and Cucculelli & Micucci (2008) pointed out other aspect that influence the stagnation and failure of a family company, which is the descendants’ lack of expertise and aptitudes. As the owner does not want to lose control over an external person, despite being more skilled and more experienced, makes her or his descendant the successor, which will restrain their ability to grow and to achieve higher performance (Molly et al., 2010).
Ward & Danco (1987) and Ward (1997) did further studies and concluded that two types of family business should be understood: family companies where the business serves the family (family orientation) and family firms where the family serves the business (business orientation). On one hand, Reid et al. (1999) concluded that family orientation turns out to be more important as the
7 company passes to new generations. On the other hand, the authors also concluded that family companies with business orientation have higher capacity to grow.
Some researchers also study the comparison between first generation performance and the other generations. Mcconaughy & Phillips (1999) found that while founder-controlled firms have higher capacity to grow, descendant-controlled firms tend to be more profitable, as they can benefit from the investments made earlier in capital assets.
Molly et al. (2010) conclude that it is obvious that succession has an impact in the family firm performance and development, as the transition between the successor and the predecessor is one of the most important occasions in the life of a family business.
Although some studies about succession already exist, there is still insufficient research about the relation between succession and capital structure. Some researchers find a positive effect of succession on debt financing, but others state the otherwise (Molly et al., 2010).
2.1.3. Family Firms VS Non-Family Firms
A considerable number of scholars have already studied the similarities and differences of family firms and non-family firms(e.g., Anderson & Reeb, 2003; Littunen, 2003; Coleman & Carsky, 1999). Researches have demonstrated that these companies are different in some dimensions – entrepreneurial activities undertaken, performance, perception of environmental opportunities – but identical in other scopes – strategic orientation, sources of debt financing (Sharma, 2004). On one hand Gudmundson et al. (1999) concluded that no noteworthy difference exists between the two types of firms regarding their strategic orientation. On the other hand, Sharma & Manikutty (2005) affirmed that the cultural environment that a company has, the norms regarding its succession and the relations between family members, influence their strategic divestment decisions. Other study shows that the likelihood of job cuts among S&P 5002 firms, decreases in family ownership (Block, 2010).
2 Standard & Poor’s is an American stock market index that identifies the five hundred companies with higher stock
8 Gómez-Mejía et al. (2007) conclude that family firms take different strategic decisions when the possibility of losing some control of the company is involved. As numerous scholars have already written, family firm owners are very concerned with choices that may affect their influence over the firm.
Family leaders are also more emotionally linked to their firms than non-family owners. The stewardship theory states that there are leaders who aspire higher purposes at their jobs, they are altruists and act taking into account the benefits for the whole firm and its stakeholders; they are not only concerned with maximizing their own goals (Gersick et al., 1997). These attitude seems to happen more often with family leaders (Miller & Breton-miller, 2006). Seeking stewardship can be a good determinant of family firm superior performance and a source of competitive advantage, according to the previously mentioned authors.
Additionally, Sirmon & Hitt (2003) stated that the main sources of capital that differentiate family business from non-family business are: human capital, social capital, survivability capital, patient capital and governance structure. Social capital represents a critical feature in family firms because it results from the relationships between individuals and organizations, which can create huge value to the firm.
Researchers have not yet reached an agreement about which type of business have the best performance, between family and non-family firms. On one hand, some articles show (Anderson & Reeb, 2003; Andres, 2008; Lee, 2006) that family business outperform non family ones in a variety of environmental settings. On the other hand, some researchers affirm that family firms usually underperform non family business (Cucculelli & Micucci, 2008; Villalonga & Amit, 2006). There are numerous studies demonstrating that the relation between family involvement and business performance is complex, non-linear and multifaceted (Barth & Gulbrandsen, 2005; Dyer, 2006; Miller et al. , 2007).
Mazzi (2011) concluded that most of the studies that compare the two type of businesses, affirm that family owned and listed companies outperform the non-family ones. These results also show that the founder effect has a clear impact on companies. Founder-led family companies are stronger and have better results than non-family, descendant- controlled, or professionally managed firms. As it has already been said by a few authors, such as Anderson et al., (2003) and García-álvarez et al. (2002), founders have a huge influence on the performance and culture of their firms, due to
9 their ownership and centrality in the family and business. Furthermore, Anderson & Reeb (2003) conclude that the founder has a positive impact on the family firm’s performance, regarding accounting profitability measures, market performance and cost of debt financing.
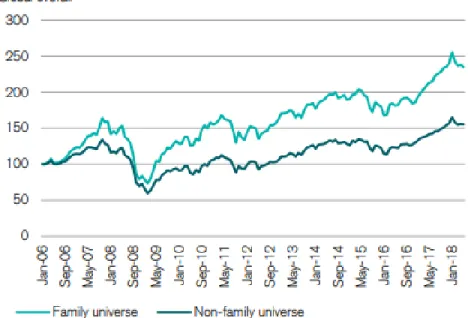
Additionally, the Credit Suisse (2018) made a recent study from 972 family companies, considering that the firms have to meet the following two conditions: the direct shareholding by founders or descendants have to be at least 20% and the founder or descendants’ right to vote have to be at least 20%. This report also concludes that family businesses out-perform non-family ones since 2006.
On the other hand, Lubatkin et al., (2003) affirm that sometimes owners have difficulties in controlling their impulse to satisfy the wishes and needs of their family, which can lead to discomfort among the company. The non-family employees can see this as special treatment. Moreover, this attitude can place family members in high positions for which they are not best-qualified (Burkart et al., 2003).
Although authors have been focusing their attention on family business, there is still a lack of research regarding the financial structure of these firms (López-Gracia & Sánchez-Andújar, 2007).
Graphic 1 – Family owned companies have outperformed non-family owned companies since 2006
10
2.2. Financial Structure
Neubauer & Lank (1998) affirmed that the capital needs of a family business can be fulfilled by several means:
Internal generated cash flow;
Increasing the number of shareholders, by inviting directors, employees or investment institutions to acquire shares;
Selling parts of the business that are not part of the core activity; Capital injections of current stakeholders;
Loans from financial institutions.
The authors also concluded that the owner’s choice, between the resources mentioned before, is affected by various features, such as business ownership, family control and independence. Additionally, Barton (1989) states that not only financial factors influence the firm’s capital structure decision, but also personal and social variables. These factors include: company’s age; how much control the firm wants to keep in the family; use of internal financing; owner’s prior experience with capital structure; approach towards debt financing; view regarding short-term and long-term debt; the level of aversion to risk; and preferred ways of funding for growth.
Even more, Smyrnios et al. (1998) concluded that the growth and size of the family firm, associated with the capital that the family has on hand, influence the type of the company’s financing – loans from financial institutions, business savings or capital gains. In fact, Gallo & Vilaseca (1996) argue that larger families tend to be more related to financial institutions and to use several types of financial products.
There is agreement between several researchers, such as Dailey et al. (1977), Hutchinson (1995) and Shrivastava & Grant (1985), about the fact that owners who desire to keep their independence prefer to use retained earnings and equity as the source of financing, as long as there is no need do include external people. Even so, Hutchinson (1995) affirmed that owners who want to keep the firm’s control may set restrict limits in the use and raise of equity.
Berger & Udell (1998), Harvey & Evans (1995), and Barton (1989) also agree that the firm’s risk aversion and the control, that the family wants to keep, influences the capital structure and the
11 financing decisions of a company. Even more, Romano et al. (2000) state that the preference for a type of financing influences the firm’s growth opportunities and long-term survival.
According to Sonnenfeld & Spence (1989) family firms prefer to have low debt to equity levels, because they are afraid that if a loan failure occurs, the family’s reputation and personal guarantees may be damaged, and they may lose everything.
Miller & Le Breton-Miller (2005) and Ward (1997) also agree that owners of small family companies prefer to use a low leveraged capital structure. This fact is explained by the family’s desire to handover a prosperous firm to the next generations, preserving their reputation and giving to the descendants the opportunity to develop the firm.
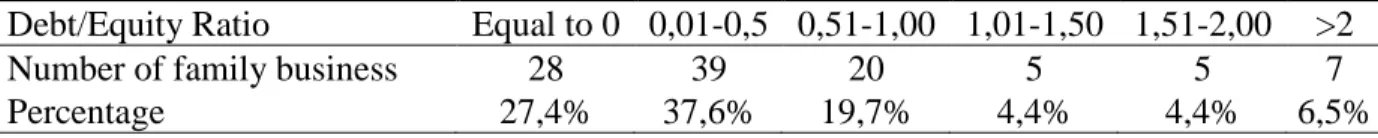
The research mentioned before in this thesis, made by Gallo & Vilaseca (1996), also concludes that the majority of family companies in the sample has debt/equity levels lower than one. This means that most of the firms prefer to finance themselves with equity, rather than with debt, as it is possible to observe on the following figure.
Debt/Equity Ratio Equal to 0 0,01-0,5 0,51-1,00 1,01-1,50 1,51-2,00 >2
Number of family business 28 39 20 5 5 7
Percentage 27,4% 37,6% 19,7% 4,4% 4,4% 6,5%
Some authors point out other factor that influence the debt rate used, which is the intergenerational succession. Molly et al. (2010) affirms that descendants may find it easier to attract debt financing. The researches state that when the transition is successfully conducted, the company may have better terms when pursuing financing because a long-term relationship with a bank will give the firm a good reputation – of a reliable debtor.
Furthermore, Romano et al. (2000) argue that business objectives, family control and business planning are highly related to debt. This idea emphasizes the influence that behaviour factors have on capital structure.
Besides the low leverage ratio, when compared to non-family business, family companies have a higher proportion of property assets to total assets, lower asset-turnover (net sales to average total assets), a lower profit on investment and a lower investment in intangible assets (Gallo et al.,
Table 1 – Debt/Equity Level
12 2004). Earlier Gallo & Vilaseca (1996) also said that family businesses prefer to use internal resources for financing and to have more capital in the hands of the family.
The pecking order theory is mentioned in several articles about family business. This theory affirms that companies follow a preferred hierarchy regarding financial decisions (López-Gracia & Sánchez-Andújar, 2007). The authors argue that according to this theory, companies first pursue internal resources for financing, then they issue debt or borrow and lastly they seek external financing through equities. Furthermore, the researchers state that, probably, the most important aspect about this theory is how capital structure is affected by the firm’s ability to generate fund and its will to invest in new projects. Also, Romano et al. (2000) add that this approach seeks to minimize the transaction costs related to external finance.
Donaldson (1961) and Myers (1984) affirmed that this theory does not pursue an optimal debt-equity ratio. Actually, the authors stated that the ratio varies over time, depending on the company’s need to have external funds.
The pecking order approach is especially relevant in small firms because the costs related to external finance are much higher for small companies than they are for larger companies (Chittenden et al., 1996). Constand et al. (1991) affirmed that while small firms tend to prefer short-term finance - because of the lower costs that this implies - , large firms tend to use long-term debt. But in general, family business obtain capital by internal funds or debt markets, instead of achieving it by external markets (Romano et al., 2000).
An alternative theory mentioned in researches about family companies is the trade-off theory (e.g. Harris & Raviv, 1990; Jensen & Meckling, 1976). This approach states that a firm takes financing decisions with the view of reaching an optimal debt ratio (López-Gracia & Sánchez-Andújar, 2007). This ratio is a trade between the costs and the benefits of borrowing (Romano et al., 2000). There is other theories mentioned in the literature and most of them suggest that there is an optimal capital structure, which maximizes the firms’ value (Romano et al., 2000). On the contrary, Myers (1984) argue that there is not yet sufficient knowledge about optimal capital structure and that the theories do not explain financial behaviour.
Taking in consideration the literature mentioned, it is possible to conclude that family owners are reluctant in using sources of capital that are beyond initial public offerings, investment made by
13 the current stakeholders, state or local funds and financing through general finance companies (Poutziouris et al., 1998; Dreux, 1990).
Besides that, most of all the researches demonstrate that the company’s size, degree of family control, plans of growth in the future, owner’s objectives, risk aversion and owner’s prior experience with capital structure, influences family business’ financing decisions (Bates, 1991; Hutchinson, 1995; Waldinger et al., 1990).
Even though many articles about family businesses have been written, there is still an empirical rigor missing (Westhead & Cowling, 1996). Mainly about what influences owners’ financial decisions (Romano et al., 2000).
2.2.1. Performance
Regarding the performance of family firms, empirical studies have revealed that the success of these companies is determined by the efficient balance between family and business done by the managers, rather than by the resources that either the business or the family have separated (Olson et al., 2003).
Furthermore, Anderson & Reeb (2003) draw the conclusion that a firm’s performance increases until the family owns about a third of the company, after that it tends to decrease. This fact demonstrates why some family leaders are so reluctant in letting non-family members in charge of the management.
The participation and involvement of family members in the companies clearly has an impact on the firm’s performance. Concerning accounting performance, listed family businesses outperform non-family firms when a family member works as CEO (founder CEO or descendant CEO) (Mazzi, 2011). In opposition, among unlisted companies, hereditary management can hurt the family business performance (Cucculelli & Micucci, 2008).
Scholars have long believed that the interaction between family and business creates strengths but it also creates challenges (Sharma & Chrisman, 1996). Considering this, early studies have shown that family firms benefit from long-term commitment and loyal workforce Donnelley (1988). On the other hand, Sirmon & Hitt (2003) affirmed that these firms’ unique resources are insufficient to gain a competitive advantage.
14 Haynes et al. (1999) argued that family companies use their resources efficiently, by creating and developing strategies that link family and business capital. Even more, Poza et al. (2004) state that a positive interaction between business and family impacts managerial and governance decisions, which can lead to a competitive advantage and sustained business performance. However, some scholars think that overlapping the two systems – family and business – can lead to inefficiency (Mazzi, 2011).
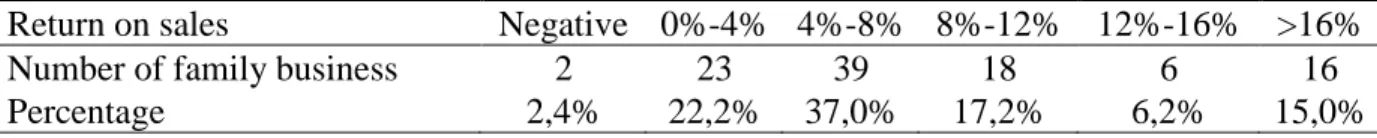
Gallo & Vilaseca (1996) did a research on one hundred and four family businesses, to understand better the capital structure, the behaviour towards investment and the relation between these aspects and performance. One of the conclusions made by the two authors is that the performance of family firms, measured by ROS and ROE ratios, is rather satisfactory in most of the cases.
Return on sales Negative 0%-4% 4%-8% 8%-12% 12%-16% >16%
Number of family business 2 23 39 18 6 16
Percentage 2,4% 22,2% 37,0% 17,2% 6,2% 15,0%
Return on equity Negative 0%-10% 10%-20% 20%-30% 30%-40% >40%
Number of family business 4 22 41 14 10 13
Percentage 4,0% 21,6% 39,2% 13,6% 9,4% 12,2%
In today’s global economic system, family firms represent a crucial role in both industrialized and developing countries (Astrachan & Shanker, 2003; Zahra & Sharma, 2004). As a result, the performance of family firms has been an important subject in the literature on business strategy and financial economics (Mazzi, 2011).
Table 2 – Return on sales distribution
(Source: Gallo and Vilaseca, 1996)
Table 3 – Return on equity distribution
15
2.2.2. Financial indicators
The research and analysis of financial indicators can create successful solutions for business problems and improve the companies’ performance (Kotane & Kuzmina-Merlino, 2012). According to these authors, financial indicators are frequently used as financial ratios. Beyond that, Chen & Shimerda (1981) affirmed that financial ratios are quite important in evaluating the performance and financial situation of a business.
According to Kaplan & Atkinson (1998), there are two principal reasons for the use of financial measures:
Financial performance measures can be directly related to the company’s long run objectives, which make it easier for the business to evaluate and update those objectives; Financial indicators give an overview of the firm’s performance.
Moreover, financial ratios can be used for other purposes, including evaluating management success, assessing the ability of a company to pay its investors or estimating the company’s capacity to grow (Barnes, 1987).
Barnes (1987) also affirms that accountants and researchers use financial ratios for different objectives. In the first case, accountants and analysts utilize these ratios to forecast financial variables, with the view of estimating the future performance and development of a business. In the second case, researchers find financial ratios useful to create statistical modes, with the aim of predicting financial variables.
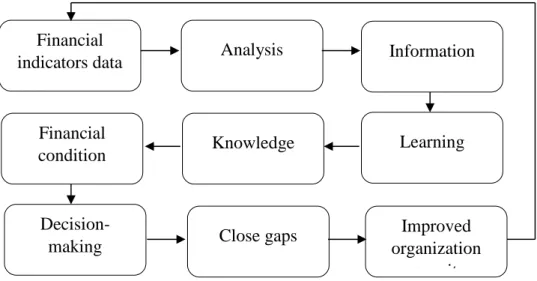
Suarez et al., (2011) studied how can financial indicators improve the performance indicators of a firm and how can a company improve its results. Thereby, the authors developed steps to help companies understand how financial data can improve their capacity.
16 According to Kotane & Kuzmina-Merlino (2012), financial ratios are divided into four groups:
Group Purpose Examples
Profitability ratios Measure how able a company is to generate profits from its assets.
Return on assets Return on equity Gross profit margins Liquidity ratios Evaluate the capacity of a firm to meet its
short-term obligations. Current ratio Quick ratio Cash ratio Solvency ratios/ Leverage ratios
Assess the business’ aptitude to meet its long-term obligations.
Debt to equity ratio Equity ratio
Total debt ratio
Activity ratios Evaluate the efficiency of a firm in performing day-to-day operations.
Total assets turnover Days of sales outstanding
Figure 1 – Use of financial indicators with continuous quality improvement to improve organizational capacity
(Source: Suarz et al.,2011)
Financial indicators data Financial condition Analysis Knowledge Close gaps Decision-making Learning Information Improved organization capacity
17 According to Damodaran (2014), the income statement demonstrates how profitable a business is in absolute values, but it is also important to evaluate profitability in percentage returns or comparison terms.
2.2.3. Comparison between family business and non-family business financial
structure
Regarding financial structure, there is still no agreement among the researchers if family firms are similar or different from non-family firms. According to Donckels & Lambrecht (1999), family firms’ directors tend to be much more involved in corporate finances than the non-family directors are.
Additionally, Poutziouris (2001) concluded that family companies are much more dependent on funds made internally and prefer to not issue equity, which is explained by the fact that the family does not want to lose control over the business. While non-family businesses are more stimulated by growth and for that reason they look for funding having in mind a market-oriented approach. Coleman & Carsky (1999) did a study about the factors that influence the usage of debt in both types of business. Their research demonstrated that no significant difference exists regarding the use of debt nor the type of credit products used. They also concluded that the most reliable debt predictors are the size, age and profitability of the business, which is directly related to the pecking order theory.
Furthermore, the study made by López-Gracia & Sánchez-Andújar (2007) demonstrates that the debt ratio is only slightly higher on non-family firms and the average profitability is also relatively higher. The authors conclude that the most noticeable differences were regarding growth opportunities and financial distress costs. In terms of borrowing requirement and business maturity, the results show that there are no differences between the two types of business.
Gallo et al. (2004) did also a research about the comparison between family and non-family firms. The results in this case were a little distinct from the ones mentioned before. First, the average equity in family firms is considerably lower than it is in non-family ones. Second, the number of shareholders is significantly higher for non-family companies than it is for family firms. Third, the number of financial partners is noticeably lower in family firms and even more, the percentage owned by these financial partners is quite different for the two businesses – 7% to 25% for family
18 companies and over 50% for non-family firms. Lastly, Gallo et al. (2004) concluded that family businesses have higher values of capital turnover and in the meantime create higher level of employment in relation to this capital.
Moreover, the conclusions reached by Allouche et al., (2008) demonstrate that, in terms of liquidity, family firms have a higher capacity to meet their short-term financial obligations and to endure economic difficulties, which is coherent with the findings of Mishra & Mcconaughy (1999). Besides, according to Allouche et al., (2008), family businesses are less dependent on external lenders.
2.3.
Family Business in Portugal
The president of the Associação de Empresas Familiares (2019) states that, although there are no exact results, it is estimated that over seventy percent of the companies in Portugal have a familiar structure. Besides, the president also affirms that family firms generate approximately sixty-five percent of the Portuguese GDP.
The research made by Credit Suisse (2018), that was previously mentioned, includes six Portuguese companies in its data. One of them is included in the top 30 of the best-performing family firms in Europe (using sector relative to shareholder returns), which is Semapa – see Table A1 in Appendix. Even though family businesses have such an impact on Portugal’s economy, there are only a few studies made about this subject.
Howorth & Ali (2001) studied the family business succession in Portugal, having in consideration three different case studies. The authors’ goals were to comprehend how culture affects families and business, the interaction between family and business and how does the succession process works in the three different companies under study. One of the findings reached with this research is that family and business have a high level of interaction and, moreover, family values tend to prevail in next generations.
A few years later, Miralles-Marcelo et al. (2014) also explored the family business in Portugal and Spain. The aims of this research were to study the impact of family control on the firm’ performance and to analyse the differences between the family business and non-family business performance. The reasons to choose Portuguese and Spanish firms were the following: both are
19 small and medium-sized financial markets with a crescent value in the world financial market; the most important companies in these countries are family owned; there are almost no research about this type of publicly traded firms.
There is still insufficient literature regarding family business in Portugal and its characteristics, therefore it is crucial to invest in the research of this theme.
20
3.
Research Design
3.1. Introduction
The purpose of this dissertation is to analyse the evolution of financial indicators in Portuguese family firms. Having this objective in mind, a quantitative study will be done. According to Apuke (2017), a quantitative research quantifies and analyses variables in order to reach results. Furthermore, Williams (2007) states that a quantitative study contains a numeric or statistical approach to research design. The data provided by the AEF made possible a quantitative and a descriptive study.
Besides this brief introduction, the Research Design also includes the following topics: firstly, the presentation of the AEF is done; secondly, it is explained how the data utilized in this study was collected and thirdly an explanation of how the data was selected and worked is presented.
3.2. Associação das Empresas Familiares
The AEF was founded in 1998 in Portugal. It is a non-profit organization that works with more than three hundred companies from various activity sectors. The members of this association are the administrators, shareholders and leaders of the family companies.
The main goal of the AEF is to promote and to defend the interests of its associates (Associação
das Empresas Familiares, 2019). Furthermore, it offers services and formation through consultant
specialists from diverse areas of knowledge. The AEF intends to improve the family businesses management, to widen their business knowledge and to prepare the companies for change, because the business world is always shifting. In order to do that, the association has management programs, congresses, seminars, workshops and also internship exchange programs between the family firms. Besides, the AEF collaborates with public and private entities, such as city councils, government departments, national and international business associations.
The AEF has two types of associates: the headcounts and the assistants. The headcounts are the family firms that are represented by their own administrators and presidents. While the assistants are the organizations that provide services to the family companies, such as banks, lawyers, consultants and others.
21 According to the Associação de Empresas Familiares (2019), there are several advantages for family firms who join the AEF, such as:
Obtaining information about new practices of family business management; Take part in activities to improve their knowledge, without costs;
Access to an enormous source of network;
Belonging to a community that promotes family business and demonstrates how family firms have such an important role on the countries’ economy;
Access to specialized information in the academic field, at national and international level. The universe of associates that compose the AEF is what will be under study in this thesis.
3.3. Data Collection
The AEF has demonstrated interest in sharing its data, in order to develop a study with the view of understanding better the evolution of family businesses in Portugal. Thereupon, a data collection from the associates of this association has been made in July 2018.
In order to collect the data, Amadeus and SABI databases were used. While the Amadeus database includes comprehensive information from companies across all Europe, the SABI database is restricted to Portuguese and Spanish firms. This comprehensive information includes: financial indicators, business related news, directors, market research and several others. Additionally, internal information from the Primavera software of the association was also taken into consideration.
Using the VAT identification number3 from the associates selected for the analysis,it was possible to insert these numbers in Amadeus and SABI databases and afterwards extract the chosen variables.
In total, 450 family firms compose the associates that will be under study. Qualitative and quantitative data from the databases were extracted, but mostly quantitative data will be used. A large set of variables related to these companies were extracted: operating revenue, net profit, percentage of debt, number of employees, business volume, corporation tax, EBITDA, gross value
3 VAT Identification Number – Value Added Tax identification number. In Portuguese it is called NIF – Número de
22 added, total assets, and a few more. These variables are considered between the years of 2010 and 2016.
Furthermore, the companies included in this study will not be only the direct associates, which are the ones that pay quotas to the AEF. The indirect associates, that are also considered, are the companies that belong to the corporate group of the direct ones. This sample expansion is explained by the fact that when a company belongs to the AEF’s associates it has to pay a quota, but not all the firms that belong to the same corporate group have to pay it. The quota payment is already considering the corporate group’s size, therefore not all the firms have this expense. For that reason, from now on this thesis sample will be referred as the AEF Universe.
An inductive approach will be used, as the aim of this thesis is to better understand the financial evolution of family firms in Portugal. Furthermore, a descriptive analysis will be done with the data extracted, in order to analyse better the characteristics and variables of these companies.
3.4. Data Selection
In order to restrict the data collected, some factors were taken into account. The first one was the definition of a family firm. As it was already mentioned, there are several definitions of family firms, some of them are more quantitative than other. Having this in mind, the family firm designation used was the one given by the EU, which was earlier quoted.
After the data exportation, the sample was carefully revised to make sure that there were no duplicated companies. This is explained by the fact that some companies have consolidated statements, thereupon a stricter analysis was done. The rules applied for this kind of firms were the following: if the parent company has its accounts consolidated, this is the one that is considered in the research and all its subsidiaries are not; if the parent company does not have consolidated accounts and its direct subsidiaries have, these are the ones that are considered in the study; if the parent company does not have consolidated accounts and its direct subsidiaries do not have it too, the search for consolidated statements continues down the corporate group organogram.
Then a data cleansing was crucial to eliminate information that was not necessary. Firstly, the foreign associates were excluded, which are the companies that do not have their headquarters in Portugal or associates that are also owned by foreign companies. Additionally, after analysing
23 some variables it was possible to conclude that other companies needed to be deleted from the population, because some of them had their establishment date after 2016 and others had practically no information on the years under study.
After all these factors were taken into consideration, the data collection was done. Firstly, the extraction of the VAT identification number from all the companies listed in the Primavera software was done. Secondly, an individual research was executed to verify if the companies were family associates in 2016. With this information, a file was created with all the direct associates. Afterwards, using the SABI and Amadeus database, a research founded on the direct associates was made to discover if they belonged to a corporative group, and if so to find out which were the indirect associates.
The years that were supposed to be included on this research were between 2008 and 2017. Forthwith, it was possible to conclude that the two first years – 2008 and 2009 – had only data for half of the companies. Therefore, they will not be included on this thesis. Regarding the year 2017, as the data collection was made in July 2018, there were still a lot of companies that had not their financial statements ready yet. Consequently, the years under study will be between 2010 and 2016.
24
4.
Data analysis
4.1. Introduction
The procedures referred on the Research Design chapter were done and the final population for this study was settled. The AEF Universe under study is 450 companies. The companies work in different business areas, such as head offices activities, management consulting, construction field, accounting and assurance, acquisition and transfer of real state and several others.
Firstly, an exploratory data analysis was done, with the purpose of better understanding and exploring the population. In order to do that, the analysis of variables - the growth of the AEF Universe, the size of the companies included in the population, the geographical distribution of these firms and the type of industry in which they work – was performed.
Secondly, the financial evolution of these family businesses was analysed. In order to do so, financial ratios were measured and then evaluated. There are numerous of financial indicators that can be used to evaluate the performance of a company. In this thesis the following indicators were used, having in consideration the definitions given by Damodaran (2012).
Debt ratio – measures the degree of a firm’s leverage, which means that it demonstrates the firm’s ability to pay its liabilities.
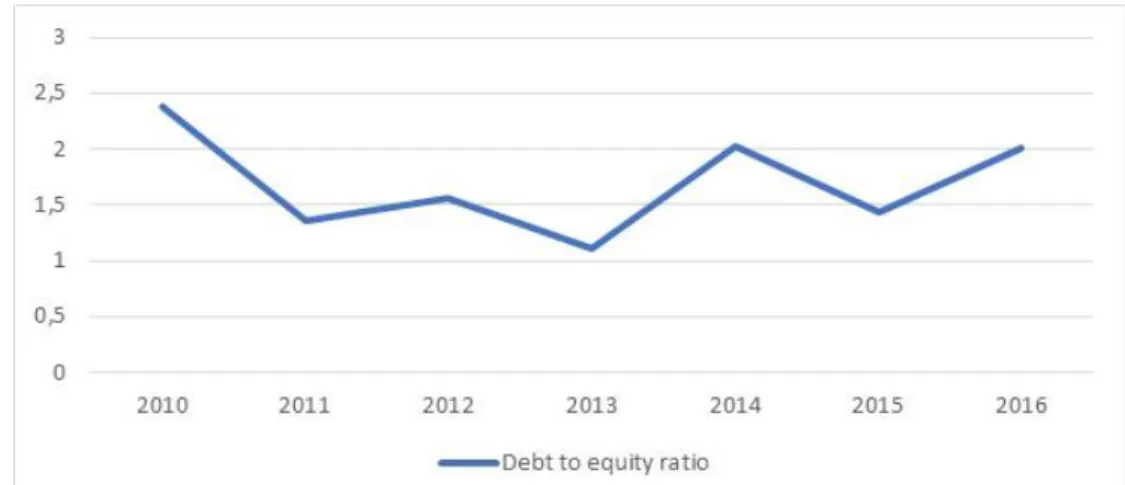
Debt to equity ratio – measures how much a company is financing its operations with debt. Return on assets - evaluates the business’ operating efficiency in generating profit from its
assets.
Current ratio – assesses the firm’s ability to pay its short-term obligations.
4.2. Exploratory data analysis
Chong Ho (2010) concluded that exploratory data analysis is a data analysis strategy that uses a variety of techniques, mostly graphical. Furthermore, according to NIST Sematech (2006), this type of analysis has the following objectives:
Maximize the perceptions of the data; Figure out the data structure;
25 Uncover outliers;
Test subjacent hypothesis; Create parsimonious models; Define optimal factor settings.
Having this in mind, a brief exploratory data analysis of the AEF Universe is done.
4.2.1. AEF Universe growth
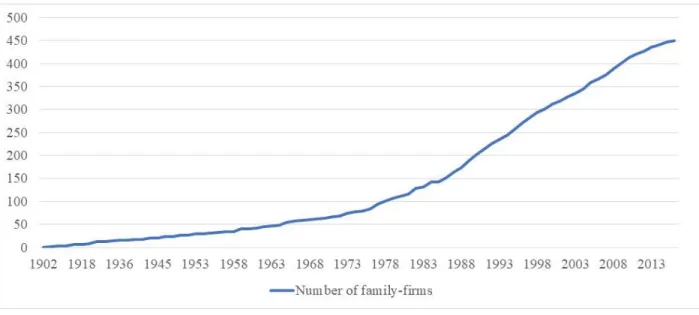
According to Massis et al. (2012), the link between family and business aids these companies to survive in difficult times and to have a continuous growth. The AEF Universe population is represented by companies that have survived more than one hundred years and continue to manifest a constant development. The oldest firm was found in 1902 and the youngest one in 2016. It is possible to observe in the Graphic 2 that almost every year a new family business was found between 1902 and 2016. Furthermore, the following graphic also shows that between 1988 and 2010 the establishment of new family firms was very significant.
The previous graphic – Graphic 2 - shows that between 1988 and 2010 the establishment of new family firms was very significant. On one hand, the beginning of this growth can probably be explained by the fact that Portugal joined the EU in 1986. According to Mateus (1992), the accession contributed to the development and modernization of the economical processes in
26 Portugal. Furthermore, it allowed the Portuguese market to become more global and also permitted the government to make higher investment in infrastructures, which contributed to an intense development of the companies in general (Mateus, 1992). In fact, according to INE (2014), the number of firms constituted after 1986 increased significantly. Therefore, it was expected that this phenomenon happened to family businesses too.
On the other hand, the reason that explains the growth decrease that happened around 2010 is possibly the crisis that started in 2008. Besser-Pereira (2010) affirms that it was the biggest capitalism crisis. Additionally, the author states that this event was caused by the regulation flaws in the financial markets and by the overstated speculation. According to Ivashina & Scharfstein (2010), companies all over the world were not able to meet their financial commitments and were forced to file for bankruptcy and Portuguese companies were not an exception. Therefore, if firms were closing, it was not a good period to start new businesses. It is clear that this crisis had an impact on the progress of family firms in Portugal.
4.2.2. AEF Universe Size
According to Mazzi (2011) the size of a company can be measured by several indicators, such as the value of total assets, sales, net sales and number of employees.
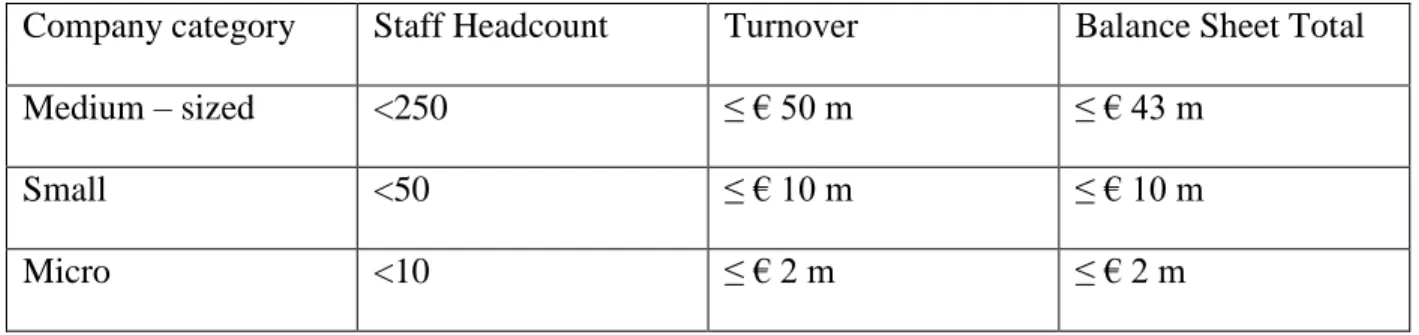
In 1996, the European Commission reached the conclusion that it was necessary to define a concrete definition of company sizes. The existence of several classifications could create discrepancies and the idea of a single market without intern borders would be impossible. In this sense, the EU (2003) published a recommendation (2003/361/EC) of a solid definition for micro, small and medium-sized companies. This recommendation states that the criterion of staff numbers is one of most important ones and must be considered the main one. Moreover, the EU also affirms that the introduction of a financial criterion is crucial in order to understand the real performance of a company, as well as to compare it to its competitors.
Thereby the key characteristics to characterize if an enterprise is an SME are: 1. Staff headcount;
27
Company category Staff Headcount Turnover Balance Sheet Total
Medium – sized <250 ≤ € 50 m ≤ € 43 m
Small <50 ≤ € 10 m ≤ € 10 m
Micro <10 ≤ € 2 m ≤ € 2 m
After analysing the data collected from the AEF, it was possible to see that there are companies with more than 250 employees and that exceed the €50.000 of turnover or €43.000 of balance sheet total. Therefore, it was necessary to use another category, which was called “Large-sized” for companies with the characteristics mentioned before.
The variable “number of employees” of the population lacks information in most of the years, which is a limitation in this thesis. Wherefore, to characterize this population regarding the size, the year used was 2016, which is the period that has more information about this variable. The financial criterion used was the balance sheet total.
After dividing the AEF Universe into the company categories mentioned, the following graphic was designed.
As it is possible to observe, the majority of the population is SME. According to the European Commission (2019), SMEs represent 99% of all business in the EU. Nevertheless, large companies
Table 5 – SME Definition
(Source: European Union, 2003)
28 have a significant weight in the AEF Universe, which demonstrates that family businesses are not only SMEs.
According to Block (2010), the number of family companies that are small is significantly high, when analysing the total assets value. Moreover, according to Chrisman et al. (2012) the relation between family and firm can become more distant as the firm’s size increase, which is an impact that usually family owners do not want.
4.2.3. Geographical distribution of the AEF Universe
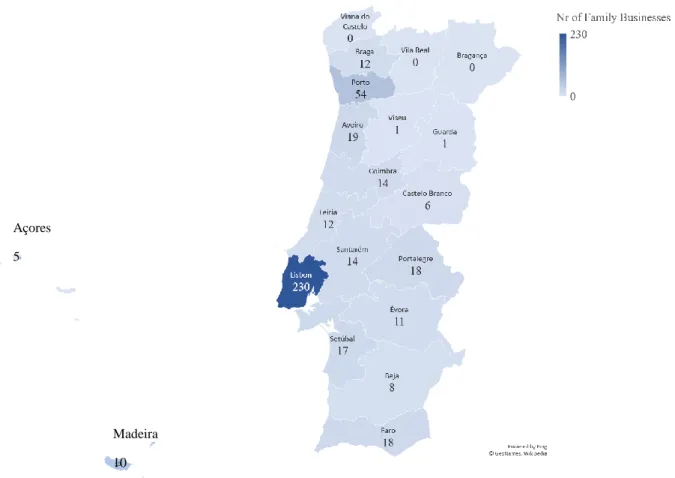
Regarding the location of AEF Universe, the headquarters of these firms are distributed along almost every district of Portugal, with the exception of Bragança, Vila Real and Viana do Castelo – the three districts more at north of the country. As it was expected, the city that has the highest number of family companies is the capital Lisboa, with 230 firms – more than half of the total population, which is 450. Porto is the second district with more family business headquarters, as it is possible to see in the following figure.
Açores 5
Madeira 10
29 The location of a company can be influenced by numerous factors, such as accessibility, business rates, potential for growth, security and several others. In the case of family business, Kahn & Henderson (1992) conclude that the family residence also has a significant effect. The results of the authors’ study demonstrate that family companies are keener to be located near the family residence than non-family business. Additionally, these researchers also conclude that non-family firms have a higher preference on locations that minimize their costs, than family businesses. In this case, the fact that the AEF is located in Lisboa can also be a factor that influences the distribution of this population. It is probably easier for the AEF to reach a company that has its headquarters in Lisboa, than a company that works in Viana do Castelo.
The population distribution along the cities is another factor that should be considered. According to Censos (2011), the population in Lisbon represents 26,7% of Portugal’s total population. Farther, Lisboa is also the city with higher GDP, according to PORDATA4 – Graphic A1 in Appendix. Consequently, it is expected that there are more companies in Lisbon than in any other district.
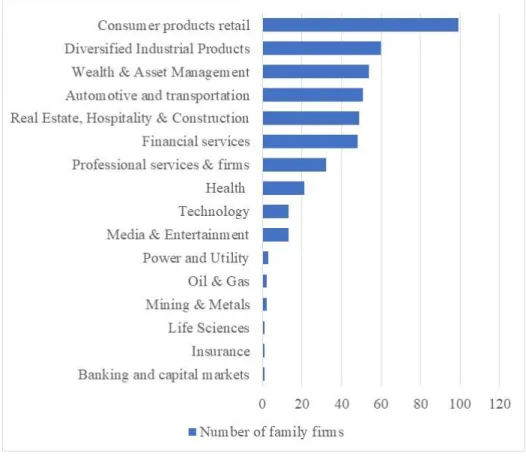
4.2.4. The industries of the AEF Universe
Villalonga & Amit (2010) affirm that entire industries are dominated by family firms. The beer industry is one example of this fact. The majority of beer companies is still owned by their founding families or related foundations.
The data of the AEF Universe that was exported includes the information of the CAE5 –
Classificação Portuguesa das Atividades Económicas. This classification system assigns to each
economic activity a specific classification code. In this sense, it was possible to do an analysis of the type of industries in which these family businesses work.
As this system attributes more than 150 classifications to the sample of 450 companies, a more general classification system was created. Having in consideration the division made by PWC (2017), the type of industries that were considered were the following:
4 PORDATA is a Portuguese database.
30 Automotive and transportation Media & Entertainment
Banking and capital markets Mining & Metals
Consumer products retail Oil & Gas
Diversified Industrial Products Power and Utility
Financial services Professional services & firms
Health Real Estate, Hospitality &
Construction
Insurance Technology
Life Sciences Wealth & Asset Management
With these classifications, the following graphic was created.
31 As it is possible to observe, the AEF Universe is distributed in several types of industries. The most common one is consumer products & retail industry, which includes companies that work in retail trade of beverages, crockery and other household goods, food products, watches and jewellery, clothing and many other products.
According to PORDATA – see Table A2 in Appendix – the economic sector that includes the highest number of companies (family and non-family businesses) in Portugal is the wholesale and retail trade. Therefore, these numbers are in accordance with the data extracted, which makes sense considering the fact that family companies have a significant weight in the economy of Portugal.
4.3. Evolution of financial indicators
Financial indicators have been considered very important in assessing the performance and financial condition of a company (Chen & Shimerda, 1981). Furthermore, they help summarizing financial statements and the welfare of a business. There are hundreds of financial ratios that can be used to understand how a company is behaving. Using the SABI and Amadeus databases, it was possible to extract some of these financial indicators. With the view of understanding better how these indicators have developed in family businesses, an analyses between 2010 and 2016 was done.
4.3.1. Debt Ratio
The debt ratio was one of the variables given by the data exported from the databases. This financial indicator measures the degree of a firm’s leverage. As mentioned before, this ratio is included in the group of solvency ratios. The debt ratio is defined according to Informa D&B, which is a partner of Bureau Van Dijk – the company who owns SABI and Amadeus databases. The debt ratio used is the same for both companies and is the following:
Debt ratio = Total liabilities Total assets
Equation 1 – Debt ratio
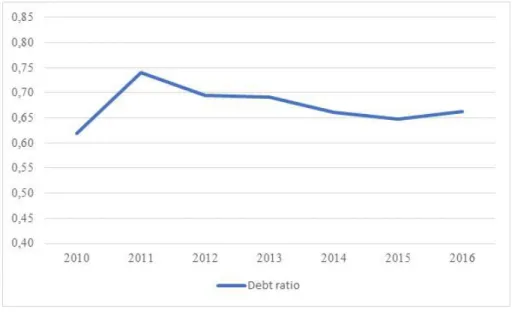
32 One of the interpretations given by scholars for this ratio is that it demonstrates the firm’s ability to pay its liabilities with its assets. After calculating the debt ratio average for each year, between 2010 and 2016, the following graphic was designed.
The Graphic 5 shows that the debt ratio average of the AEF Universe has a certain variation along the years. The highest value is approximately 0,74 and took place in 2011, while the lowest value is approximately 0,62 and took place in 2010. The following years demonstrate a more stable level of debt.
The graphic shows that the highest variation occurred between 2010 and 2011. This fact is probably explained by the crisis of 2008. The difficulties that companies faced during this period caused a significant impact on their financial results. The firms needed to finance their assets and in order to do so they raised capital from financial institutions or investors. As the crisis continued in Portugal, the companies began to have difficulties in paying their debt but continued to have the necessity of financing their assets. Consequently, their level of debt increased.
The firms that have more liabilities than assets are considered more risky to lenders and investors. Besides, Damodaran (2014) affirms that a higher debt ratio implies higher leverage, which creates superior financial risk. Leverage is an investment strategy that uses borrowed capital to invest in the firm’s assets. Furthermore, it generates earnings on risk capital (Welch, 2011).