UNIVERSITY OF BEIRA INTERIOR
Social and Humanities Sciences
On the Relationship between Religiosity and
Technological Progress
Ana Patrícia Costa Rodrigues Fazenda
Dissertation Submitted as Partial Requirement for the Degree of Master of
Science in
Economics
(2
ndCycle Studies)
Supervised by Prof. Dr. Tiago Miguel Guterres Neves Sequeira
Acknowledgements
This thesis marks the end of another academic stage in my life. A dissertation for obtaining the degree of Master of Science represents a long and demanding path. The support of very particular persons has encouraged me to continue my work, day after day. Thus, I wish to thank all persons who directly or indirectly contributed to my work in the last academic year.
I would like to thank my mother and father, to whom I am mostly grateful, for helping me to achieve my goals on different areas, particularly on academic life. I would like to thank my grandparents, for always demonstrating their love and will to live.
Foremost, I would like to express my gratitude to Diogo, for all the patience and for the times we worked together, but especially for always knowing where and how to be present in the most important moments of my life.
I am also grateful to my supervisor, Prof. Dr. Tiago Sequeira, for agreeing to supervise my dissertation, for his availability, comprehension and for giving me the opportunity to gain some experience in the economic growth’s area.
Last, but not least, I want to acknowledge my friends for all the strength they gave me over the past few months and, in many moments, for encourage me to continue.
Thank you all,
Patrícia Fazenda
Resumo
Recentemente, a cultura começou a ser entendida como um factor que influencia o desem-penho económico, afectando valores e características pessoais de cada indivíduo. Assim, a religião apresenta-se como uma das mais importantes dimensões da cultura, sendo importante o estudo da sua relação com o desempenho económico. Durante o presente estudo, procurámos compreender a relação entre a tecnologia e a religião, e consequentemente, o modo como in-fluenciam o crescimento e desenvolvimento económico. O estudo baseou-se na análise da taxa de aderência populacional a cada religião, permitindo quantificar a parte religiosa; e na análise de 16 tecnologias e de algumas variáveis como a educação que podem influenciar a adopção de tecnologia por parte dos indivíduos, aplicando-se a 212 países entre os anos 1970 e 2000.
Palavras-chave
Religião, Tecnologia, Cultura, Desenvolvimento Económico, Crescimento Económico
Abstract
Recently, the culture began to be seen as a factor that influences economic performance, af-fecting values and personal characteristics of each individual. Thus, religion is presented as one of the most important dimensions of culture, it is important to study its relationship with economic performance. During the present study, we understood the relationship between technology and religion, and consequently, how influence growth and economic development. The study was based on analysis of the rate adhering of population to each religion, allowing to quantify the religious part; and analysis of 16 technologies and some variables such as education that can influence the adoption of technology by individuals, applying to 212 countries between 1970 and 2000.
Keywords
Religion, Technology, Culture, Economic Development, Economic Growth
Contents
1 Introduction 1
1.1 Framework . . . 1
1.2 Aims and Objectives . . . 1
1.3 Dissertation Overview . . . 1
2 State of the Art 3 2.1 Introduction . . . 3
2.2 Technology Concept . . . 5
2.3 Religion Concept . . . 5
2.4 Religion and Technology . . . 6
2.5 Secularization Hypothesis . . . 7
2.6 Religious Pluralism . . . 8
2.7 Main Conclusions . . . 9
2.7.1 Religion and Economic Development . . . 10
3 Data and Estimating Model 13 3.1 Collection of data . . . 13
3.2 Database’s Structure . . . 15
4 Results 17 4.1 Benchmark Analysis . . . 17
4.2 Instrumental Variables Regressions . . . 20
5 Conclusion 27
Bibliografia 29
List of Figures
2.1 Religious Beliefs . . . 4
2.2 Religion and Technology . . . 6
2.3 Religious Influence . . . 7
2.4 Secularization Theory . . . 8
2.5 Religious Pluralism . . . 9
2.6 Religion and Technology . . . 10
List of Tables
3.1 Descriptive Statistics . . . 15
3.2 Groups of Technologies . . . 16
4.1 Regression OLS . . . 19
4.2 Regression IV for adherence to Catholicism in 1970 . . . 22
4.3 Regression IV for adherence to Protestantism in 1970 . . . 23
4.4 Regression IV for adherence to other Christianism in 1970 . . . 23
4.5 Regression IV for adherence to Orthodox in 1970 . . . 24
4.6 Regression IV for adherence to Judaism in 1970 . . . 24
4.7 Regression IV for adherence to Muslim Religion in 1970 . . . 25
4.8 Regression IV for adherence to Hinduism in 1970 . . . 25
4.9 Regression IV for adherence to Buddism in 1970 . . . 26
List of acronyms
UBI University of Beira Interior
e.g. originates from the Latin expression exempli gratia which means ”for example.”
i.e. originates from the Latin expression id est which means ”that is” or ”in other words.”
GDP Gross Domestic Product OLS Ordinary Least Squares
Chapter 1
Introduction
This dissertation constitutes a partial requirement to obtain the Master degree in the 2ndCycle
of Studies in Economics, at University of Beira Interior and on the subject of religiosity and technological progress. The framework of the dissertation are next described, along with its aims and objectives, and the dissertation overview, where it is also described in detail the structure and content of the document.
1.1
Framework
Peter Berger (2008) explains in [J. 13], how that society works, the way how different agents relate between themselves, is defined as an important factor in the economic growth. The author defines this set of interactions such as culture, whereas the most basic culture of the world is religion, encouraging socialization moments that drive development.
1.2
Aims and Objectives
The main aims and objectives are:
1. To identify gaps in the literature on the relationship between religiosity and economic growth and development;
2. To construct databases that allow for the analysis of the relationship between religiousity and technological development;
3. To evaluate the influence of religiousity on technological development and finally to iden-tify paths for future research.
1.3
Dissertation Overview
This document is divided in five chapters. The body of the dissertation is constituted by three chapters. Additionally, the document begins with an introduction and ends after the body, with the conclusion. Following, this section presents the organization of the chapters:
• Chapter 1 explains the problem of this dissertation, introducing the subject and main con-cepts, the aims and objectives. In the last part of this chapter is described the organization and the structure of the document.
• Chapter 2 presents the basics and main concepts about religiosity, technologies and ex-plains how these concepts can relate. It also addresses a detailed perspective over other different studies related with this topic. In short, this chapter presents the review about 1
related work and identifies the main gaps in the literature in a field that is much unex-plored. From the identified gaps, this chapter also clearly identifies the problem to be studied in this dissertation.
• Chapter 3 outlines the method taken to study the problem described in the previous chap-ter. First is explained how we proceeded to collect data that allowed formulate the re-gression, giving reasons for this choice. It is also explained the method how the data were managed and how the database was structured. Finally, the regression is specified. • Chapter 4 presents the study about regression and the main tests with the different choice
variables. It is also presents the results.
• Chapter 5 concludes this dissertation by presenting the main findings of this study, as well as possible directions for future work.
Chapter 2
State of the Art
This chapter elaborates on the religiosity, technological progress and economic growth. It presents the state-of-the-art about these concepts and different conclusions about their re-lationships.
2.1
Introduction
The study of technological progress and its consequences began in the 18th century with the effects of the industrial revolution that originated from the discovery of new technologies. Tech-nological progress may be described as the discovery of new ideas, better qualities or better and new processes. There is presence of technological progress, when for the same amounts of capital and labor, occurs an increase in the quantities produced. Technological progress is also an indicator about an increase on amount of effective work available on the market.
Economic growth is defined as the increase in gross domestic product (GDP) in a given space. This concept should not be confused with the concept economic development. The second one relates to the improvement of the welfare of the population.
Robert Solow presents a model of economic growth in the long run, [Sol56]. This model demon-strates that a market economy can grow permanently, sustainable, and exhibiting a relatively stable equilibrium path, without direct government intervention in the economy. This model is based on three fundamental questions:
• Is there a long-term equilibrium?
• Is the long-term equilibrium stable or unstable? • Is this equilibrium optimal from a social point of view?
According to Ellery & Ferreira [PF96], the new studies about theories of economic growth should be classified into two distinct categories.
• The first category includes models with constant or increasing marginal yields and where the factor technology is treated the same way as in Solow Model, i.e. as a public good. Thus, this category includes models such as Romer (1986), Lucas (1988) and Rebello (1991). • In the second category appears the models in that technology is analyzed differently than the Solow model. In these models, the technology is considered a non-rival good. Thus, we define the models of Romer (1900), Grossman & Helpman (1989) and Aghion and Howitt (1992).
As we begin the study of models of economic growth, since the formalization of the Solow model that most economists define technological progress as a key factor in economic growth. I.e. a 3
continuous growth in GDP per capita can’t be explained only by physical capital accumulation, technological progress is needed.
According to McCleary and Barro (2003), in [RB03], the authors explain that until a few years ago, most studies related to the determinants of economic growth ignored the influence of re-ligion on it. The analysis of these relationship is based on the analysis of some variables of a religious nature, such as the frequency with which the population participates in religious ac-tivities and beliefs. So, one should relate these variables with economic growth to understand the influence of religion on this topic.
Culture is seen as a factor that influences economic performance, affecting individual personal-ity traits such as honesty, ethics, willingness to work and the way to relate to different people. Religion is one of the dimensions of culture. So, it is frequent considered that religious beliefs influence individual personality traits, and these traits influence economic performance.
According to Guiso, Sapienza and Zingales (2006), in [LG06], the authors explain that economic factors are as important to explain differences in saving rates as cultural factors. For instance, this should be understood as different religions encouraging kids to save or not and if yes, at what extent. On the other hand, culture influences the behavior of different individuals about policy preferences, on how governments should make decisions.
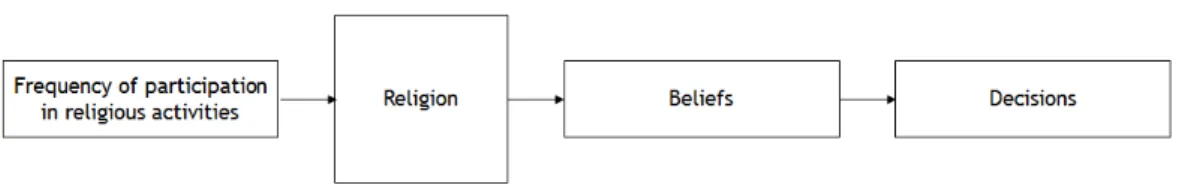
As explained by McCleary and Barro (2006) in [RB09], beliefs can be considered as simple facts such as believe in heaven, hell, life after death, God, or in the other hand, not believe, con-sidering as nonreligious. Believing in heaven or hell, as consequences of the behavior of life on Earth, may influence how people make decisions. These influences can be defined as a causal relationship. That is, the frequency with which an individual participates in religious activities determines the intensity of their beliefs, affecting their personal characteristics, determining the way they make decisions and affecting economic performance.
Put simply, we can consider the frequency with which an individual attends religious activities as an input of religion and beliefs as an output.
Figure 2.1: Religious Beliefs
Source: Construction by the Author
Thus, according to Weber (1930), [Web30], we understand that religious beliefs and practices are defined as important factors in the economic development of a country.
2.2
Technology Concept
Technology is a product of science, which through the coordination of different tools, methods and techniques, looks for solving problems. It is defined as the practical application of scientific knowledge.
Technology derives from the Greek word teknologia, defining a systematic treatment of an art. The word can be divided into tekhne- (skill) and -logy (study). It is important to distinguish technology and science. Thus, technology is applied to daily life while science seeks knowl-edge as an end in itself. Science can be considered neutral with no morals or ethics, prejudice, while technology can never be neutral since it provides application. Traditionally, technology is defined as the development of products (new varieties, better qualities of products or new or better processes of production) aimed at improving human life, the levels of comfort and quality of the same.
In [Chr97], Christensen (1997) distinguishes two types of technologies:
• Disruptive: technological innovation, product, or service that eventually overthrow the existing dominant technology in the market. This technology is radically different from the latest technology, but also difficult to implement.
• Sustaining: refers to the successive improvements in the performance of some existing products. It isn’t an invention, but an improvement. Thus, these inventions don’t revolu-tionize the industry, only improvement a specific product.
The concept presented by Dvorak (2004) in [Dvo04] also proves interesting, presenting the tech-nology as a synonym for change, a change with impact on daily life of the population, looking for a substantial improvement in the quality of it.
Susan George (1967) in [Geo67], presents a distinction of Aristotle on technology and science rather complete. According to the author, the concept of science relates to the unchange-able, while the technology relates to the changeable. The science comes from real sensations about the surrounding World, aimed at general knowledge. On the other hand, the technology presents a step ahead by applying general knowledge in concrete things. Similarly, scientists seek theoretical knowledge, i.e., an activity having an end in itself. Otherwise, the innovative person, looking for something new and the final target is this novelty.
Thus, briefly and generally, the technology presents a step ahead of science. The idea is that science discovers the necessary knowledge to being applied in the development of technology. On the other hand, should demonstrate the importance of technology so that science may move forward and evolve.
2.3
Religion Concept
The concept of religion isn’t a topic of easy definition, being difficult to find a neutral definition, without favoring institutions or religions with which the individual sympathizes and penalizing others. On the other hand, it is complicated to understand what features are necessary and sufficient for something to be considered religion. According to James Dow, in [Dow07], there 5
isn’t religion without belief in a myth, God, spirit or supernatural force that every religion pre-supposes. It should also be noted that the foundations of religious thought and action aren’t validated by direct observation, is required the belief in the unreal.
In [É.82], Émile Durkheim (1982) defined religion as: ”A religion is a unified system of beliefs
and practices relative to sacred things, that is to say, thing set apart and forbidden, beliefs and practices which unite into one single community called a Church, all those who adhere to them.”. This simple definition presupposes the key factor of religion, belief in something
higher, yielding a set of traditions and practices for the worship of something supernatural. By defining religion, it becomes relevant to distinguish this concept from the concept of spiri-tuality, both of which are related and are commonly confused. Thus, according to Grath (2001) in [Gra01], one of the most important features of religion is its expression of common and so-cial way. Moreover, the concept of spirituality refers to devotion, experiences linked to the worship of the mystical and supernatural. Thus, religion presuppose the spirituality, inserted in a community, in a social context, and where each individual has rights and duties, aimed the personal fulfillment in the individual and community level, as a consequence of emotional benefits derived from spiritual practice.
2.4
Religion and Technology
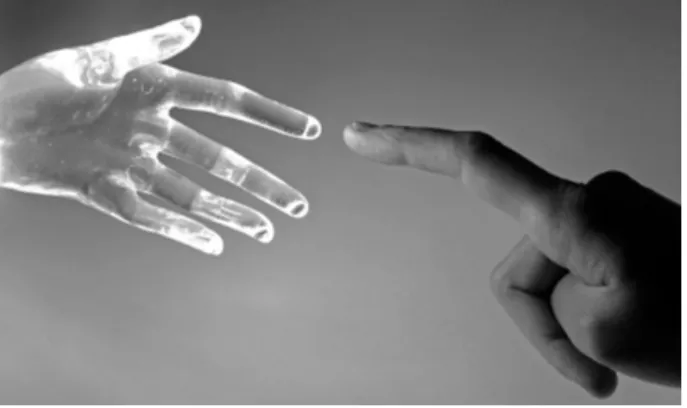
The 90’s, witnessed a strong impulse on technologies, promoting a change in the way it relate to religious activities. Pope John Paul II encouraged the relationship between the spiritual and digital world, seeking spaces of expression of faith by keeping attention in the day-to-day of the individual and not just in the moment when it goes to Church. The sites of religious nature seek to answer practical questions, addressing problems of day to day life of the faithful and encouraging them to find solutions to those problems in religious activities and practice. Thus, the concept of ”virtual religion” is apparently as difficult to define as religion. In simple terms it relates to the way religion found electronic expression, thus turning it into something different and with superior nature, approaching religion from society. Virtual derives from the Latin ”versus”, relates to something very similar to reality, but not totally real.
Figure 2.2: Religion and Technology
According to Susan (1967), in [Geo67], the key point is to understand how religion can ally to 6
the technology to reach out better to their faithful, adapting to a new reality and a new habits of society. The technology is causing some cultural changes. So, some cultural changes can affect the way people are devoted to religion, making them more or less religious. The author explains that technology and religion have a common goal: seek to improve society by increasing the well-being of individuals, prolonging its life expectancy.
However, there are almost unexplored links between religiosity and technology. In fact, the way people believe in one faith or another may determine the way they seek for new ideas or innovations. If some religious determine that success in Earth influences positively the entrance in heaven, they naturally develop the entrepreneur and innovative capacities in the human being. On the other hand, if religion make people believe that poverty may be good for God’s will, then the innovative capacities may be deterred. This link between religion and technology is however almost unexplored in the economic literature.
2.5
Secularization Hypothesis
According to [CA75], the authors Azzi and Ehzenberg (1975), explain the fundamental rela-tionship between the frequency with which an individual participates in religious activities and belief in salvation. That is, the concern with salvation, consequence of good attitudes and reli-gious practices, motivates older people to have a higher participation rate in relireli-gious activities. According to the secularization theory explained by John Wesley, and according to this, eco-nomic development means that individuals become less religious. That is, with a rise in real wages, individuals reduce their rate of participation in religious activities. The higher the value given to time by the individual, the lower its rate of participation in religious activities. This may make the relationship described above as causal, to seem now as an endogenous relation-ship as next figure shows.
Figure 2.3: Religious Influence
Source: Construction by the Author
According to the theory of secularization, religion ceases to be one of the cultural aspects that promotes aggregation, losing some of their influence in society. The word secularization de-rives from Saeculum, meaning century or world. All that is classified secular, is all of is it this world itself, is all that is terrain. This time is characterized by the decrease in the value and prestige granted to the religious symbols and institutions, the separation between Church and State and the less concern of individuals with their attitudes on the basis of a religious judgment about their future life, in ”another world”. A society dominated by religion and by its principles provides greater resistance to any way of change. Thus, a secular society is characterized by greater flexibility, mobility and opening minds. Moreover, the separation between state and 7
Church, allows the emergence of new and different religions, leading to greater religious plu-ralism.
Figure 2.4: Secularization Theory
Also Michael S. Horton (2013), has a simple definition of secularization in [Hor13]. According to this author, the natural modernization and evolution of societies, made these less religious. This process is classified into two levels: an external level, where there occurred a fading in a specific religion; and an internal level that relates with a gradual transformation and a modern-ization of traditional religions. The modernmodern-ization is classified by the growth and dissemination of a set of fundamental institutions to economic development through technology. In examin-ing this perspective, it is understood that the secularization and modernization evolved hand in hand.
In [Ber08], Berger (2008) defines secularization as the process by which the domain of religious institutions and symbols is suppressed in some sectors of society and culture. On the other hand, it says that there is no reason to think the world of the XXI century will be less religious than the world of the previous centuries, but we should think that religion itself evolves and monitors the development and changes in mindset of society.
Nowadays, some religions continue to exert great influence in the political and social level of the different countries, as well as its the religious beliefs and practices that continue to play an important role in people’s lives. It should also be noted that religious segments which remained faithful to its traditional elements were those who maintained their rates of participation and that today demonstrate greater vitality.
2.6
Religious Pluralism
The author, Berger (2008) of [Ber08] considers the secularization as the basis of pluralism, by dissolving the religious monopoly typically Catholic, and starting a dispute between Catholics and Protestants. Pluralism provides the possibility of free competition between different reli-gions, between different traditions, beliefs and rituals and ends with the imposition of the same traditions. Religious institutions begin to function of similar way to a ”commercial agency”, to the extent that customs and traditions are seen as merchandise.
According to Gomes and Souza (2013) in [FG13], it is explained that during the age of enlight-enment, the individuals can defend their opinion without having to be bound by the principles 8
Figure 2.5: Religious Pluralism
and tenets of the Church. The choice between several possibilities, when analyzing the existing problems in the World, demonstrates the richness of human thought. In a secular state, there isn’t state restrictions and pluralism is accepted, allowing the choice of religion to each individ-ual in a democratic state that values freedom of choice. Thus, pluralism reflects the acceptance of society to different thoughts, in different social groups, with the freedom to express different ideals.
According to Sanchez (2010) in [W. 10], pluralism appears as a fundamental consequence of this evolution of how each individual can be express freely. That is, in religion, religious pluralism arises due the existence of different religions and the freedom of choice therebetween. So, is defined as the democratization of religion, and all individuals are recognized regardless of their religious choice, respecting ethical principles.
Briefly, religious pluralism allows that a individual chooses the different ways of knowing a sacred figure, opting for all rituals and conceptions that are inherent to different religions.
2.7
Main Conclusions
According to McCleary and Barro (2009) [RB09], the authors explain how the Catholic Church began the process of beatification and canonization, what are the determinants of rates of beatification and canonization. The process of beatification is defined as the first stage, rep-resenting the time when the Pope declares someone Blessed, recognizing Christian virtues in the individual during his earthly life. Canonization is the time when the Pope believes, based on testimony, that the Blessed is officially Saint and should be publicly venerated. To global-ize this process, the Church expand the location of the persons designated as blessed, which may indicate that the Catholic Church viewed the process of canonization as a strategic mech-anism, demonstrating their concern about competition which Protestantism, extolling ancient local Catholic populations, decreasing the conversion to Protestantism.
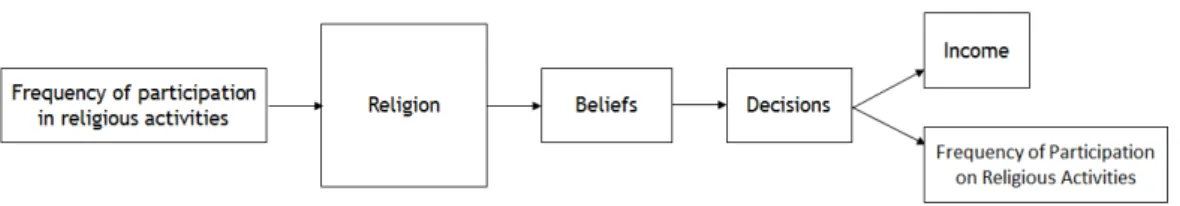
On the other hand, McCleary and Barro (2009) [RB09] are concerned to understand how reli-gion affects the overall economic development, based on data from 1981 and 1999. Thus, they concluded that education and a higher birth rate are positively related to a higher frequency in religious activities. Individuals with higher rates of education tend to participate in more social activities, including also those of a religious nature. Faced with an increase in life expectancy, individuals decrease the frequency with which they participate in religious activities, not wor-rying so much about their earth attitudes in search of salvation in an afterlife. The emergence of religious pluralism allowed an increase in the number of existing beliefs and, consequently, 9
Figure 2.6: Religion and Technology
greater participation in religious activities. In this sector, considering religious beliefs as an out-put of religious practice and participation in religious activities an inout-put of the same, keeping the constant religious beliefs, it appears that an increase in the rate of participation in religious activities reduces economic growth. That is, a greater number of resources for the same pro-duction, lowering productivity and negatively affecting economic performance. Otherwise, for a given church attendance, increased beliefs in things like heaven, hell and the afterlife, allows economic growth to the extent that individuals care about their attitudes in life to find a good afterlife. This is, larger religious beliefs stimulate economic growth, it seek to sustain aspects of individual behavior that determine the increase in productivity.
According to McCleary and Barro (2009) [RB09], the frequency with which people attend in re-ligious activities and believe in heaven or hell are positively related to their level of education, contrary to the common thought. That is, the thought that people with a higher level of educa-tion, with scientific knowledge, must have opposite thoughts to religious beliefs is proven to be wrong by the empirical results of the authors. Moreover, the relationship between the level of urbanization and religious beliefs is negative, i.e., in small rural communities, churches serve as a meeting place for social gatherings. The higher the level of urbanization, more and new different points of meeting and less demand for Churches.
2.7.1
Religion and Economic Development
According to Eum (2011) in [Eum11], religion is defined as a major factor affecting the lifestyles of the people, their personal values and their decisions. However, because of its complexity and because it is difficult to quantify, is one of the social factors that require further attention in the study of its relationship with economic variables by economists. The way each individual makes decisions, how it relates to non-religious people is very subjective, making the analysis difficult. During this study, the author seeks to understand how the fragmentation, defining itself by the presence of various religion; or polarization, related to the presence of two strong religions that are rival among them, affect economic growth and development. However, there weren’t found significant results enough to define if the religious polarization and fragmenta-tion influence economic growth.
According to Campante and Yanagizawa-Drott (2013), in [FC13], the authors sought to under-stand the economic effects of religious practices in the context of the Ramadan fast. Briefly, it can be seen that the increase in the practice of Ramadan has a negative effect on population 10
growth in Muslim countries, although this results in an increased well-being among believers. These effects were analyzed by the author on three Prospects: the immediate trade-off be-tween the time that religious practices need and what is available for production, how can limit social interactions with non-believers and even the consequences that may have in economic decisions, affecting personal characteristics and values of the individual, affecting the way they make decisions on labor supply or how they structure their savings. Thus, it appears that coun-tries that practice longer hours of fasting during Ramadan tend to have lower average rates of growth.
Article from [CB11], authors Bjørnskov and Berggren (2011) also suggests that religiosity affects the way institutions act before the political process, the property rights and rule of law. That is, the proper functioning of the rules of property rights and the legal system allow individuals to strive and find incentives for investment, education and innovation. Religiosity influences policy through the influence of the voters. Thus, according to the author, religion has a nega-tive influence on the definition of institutional measures. On the other hand, shows a posinega-tive relationship between property rights and religion, showing that religiosity relates differently with different rules so.
In another article, [LB11], the authors Bettendorf and Dijkgraaf (2011) analyze how religion affects the income, being that religion is quantified by the number of believers and their par-ticipation in religious activities. In analyzing this relationship, based on the number of believers, the author indicates that an increase in the number of believers reduces the level of income, and an increase in income also leads to a decline in the number of members. Thus, these become insignificant when studied both simultaneously. The analysis of the same relationship based on the participation of the faithful, shows the same situation, it isn’t considered significant. Also in [DH13] article, the authors Herzer and Strulik (2013) studies the same relationship: how re-ligion influences the yield, based on rates of participation in religious activities. They presents that in the long run, an increase in income leads to a decline of religiosity and that a decline in religiosity leads to an increase in efficiency. It can be noted then that the relationship between religiosity and economic progress (which can be seem as the evolution of output, productiv-ity or human capital) has not been clearly established in the empirical literature. However, the literature seems to point out for an endogenous relationship as increase in religiosity (or participation) may be a consequence of higher productivity but also a cause of lower or higher prosperity.
Chapter 3
Data and Estimating Model
This chapter aims to explain how the data were collected, as well as the development and estimation of the model used for this study.
3.1
Collection of data
We collected data about technologies from the Cross-country Historical Adoption of Technol-ogy (CHAT) dataset for both sets: 1970 to 2000 and 1981 to 2000 for 212 countries or cities: Angola, Albania, Argentina, Armenia, Antigua and Barbuda, Australia, Austria, Azerbaijan, Bu-rundi, Belgium, Benin, Burkina Faso, Bangladesh, Bulgaria, Bahrain, the Bahamas, Belarus, Be-lize, Bermuda, Bolivia, Brazil, Barbados, Bhutan, Botswana, Central African Republic, Canada, Switzerland, Chile, China, Cote d’lvoire, Cameroon, Republic of Congo, Colombia, Comoros, Cape Verde, Costa Rica, Cuba, Cyprus, Czech Republic, Djibouti, Dominica, Denmark, Domini-can Republic, Algeria, Ecuador, Arab Republic of Egypt, Eritrea, Spain, Estonia, Ethiopia, Fin-land, Fiji, France, Gabon, United Kingdom, Georgia, Germany, Ghana, Guinea, The Gambia, Guinea-Bissau, Equatorial Guinea, Greece, Grenada, Guatemala, Guyana, Hong Kong, Honduras, Croatia, Haiti, Hungary, Indonesia, India, Ireland, Islamic Republic of Iran, Iceland, Israel, Italy, Jamaica, Jordan, Japan, Kazakhstan, Kenya, Kyrgyz Republic, Cambodia, St. Kitts and Nevis, Republic of Korea, Kuwait, Lao People’s Democratic Republic, Lebanon, St. Lucia, Sri Lanka, Lesotho, Lithuania, Luxembourg, Latvia, Macao, Morocco, Moldova, Madagascar, Mexico, For-mer Yugoslav Republic of Macedonia, Mali, Malta, Mongolia, Mozambique, Mauritania, Mauri-tius, Malawi, Malaysia, Namibia, Niger, Nigeria, Nicaragua, Netherlands, Norway, Nepal, New Zealand, Oman, Pakistan, Panama, Peru, Philippines, Papua New Guinea, Poland, Puerto Rico, Portugal, Paraguay, Qatar, Romania, Russian Federation, Rwanda, Saudi Arabia, Sudan, Sene-gal, Singapore, Sierra Leone, El Salvador, Sao Tome and Principe, Slovak Republic, Slovenia, Sweden, Swaziland, Seychelles, Syrian Arab Republic, Chad, Togo, Thailand, Tajikistan, Turk-menistan, Trinidad and Tobago, Tunisia, Turkey, Taiwan, Tanzania, Uganda, Ukraine, Uruguay, United States, Uzbekistan, St. Vincent and the Grenadines, Bolivarian Republic of Venezuela, Vietnam, Republic of Yemen, South Africa, Democratic Republic of Congo, Zambia, Zimbabwe, Aruba, Andorra, Afghanistan, Netherlands Antilles, American Samoa, Bosnia and Herzegovina, Brunei, Myanmar, Channel Islands, Czechoslovakia, Cayman Islands, East Germany, West Ger-many, Faroe Islands, Federated States of Micronesia, Greenland, Guam, Isle of Man, Iraq, Kiri-bati, Liberia, Libya, Liechtenstein, Monaco, Maldives, Marshall Islands, Northern Mariana Is-lands, Mayotte, New Caledonia, Palau, Democratic Republic of Korea, French Polynesia, Re-union, Solomon Islands, San Marino, Somalia, Suriname, Tonga, Virgin Islands, Vanuatu, West Bank and Gaza, Samoa and Federal Republic of Yugoslavia. This dataset contains information on the adoption of over 100 technologies in more than 1500 countries.
We selected 16 technologies and this choice is explained by presenting a larger number of ob-servations available including the number of passengers per kilometer traveled on scheduled 13
services by civil passenger aviation companies registered in a specific country (aviationpkm), tons of freight per km transported on regular services by civil aviation companies registered in a specific country (aviationtkm), the number of users of portable cell phones (cellphone), the gross output of electric energy in KwHr (elecprod), tons of fertilizer consumed (fert_total), the number of newspaper copies circulated daily (newspaper), percent of children aged 12 to 23 months who received a D(diphtheria) P(Pertussis) T(Tetanus) immunization before the age of one year (pctimmunizdpt), percent of children aged 12 to 23 months who received a measles immunization before the age of one year (pctimmunizmeas), number of radios (radio), number of geographical/route lengths of line open at the end of the year (railline), passenger journeys by railway in passenger per Km (railpkm), tons of freight per km carried on railways (railtkm), number of mainline telephone lines connecting a customer’s equipment to the public switched telephone network as of year end (telephone), number the televisions sets in use (tv), number of passenger cars in use (vehicle_car) and number of commercial vehicles typically including buses and taxis in use (vehicle_com).
To understand the technology adoption, we also collected data about different variables which influence the technology adoption. So, we recorded data about education: percentage of pop-ulation aged 15 or over with complete secondary education (sec15c) and years of schooling of population aged 15 to 64 who is not studying (ty1564). These data were obtained from the CohenandSoto database in [CS07].
Also, we recorded data about religious variables, specifically the adherence fractions of popu-lation in 1970 for 10 religion groups and non-religion such as: Catholic Church, Protestantism, Orthodox, Jewish, Muslim, Hindu, Buddhism, Eastern religions, other religion and non-religion groups. These data were collected through the database Cross-country Historical Adoption of Technology (CHAT) [DC09].
Finally, we collected data about the distance between each country or city and United Kingdom and United States of America in Km. These data comes from a French research center in inter-national economics, CEPII, that produces studies, researches and databases [TM11].
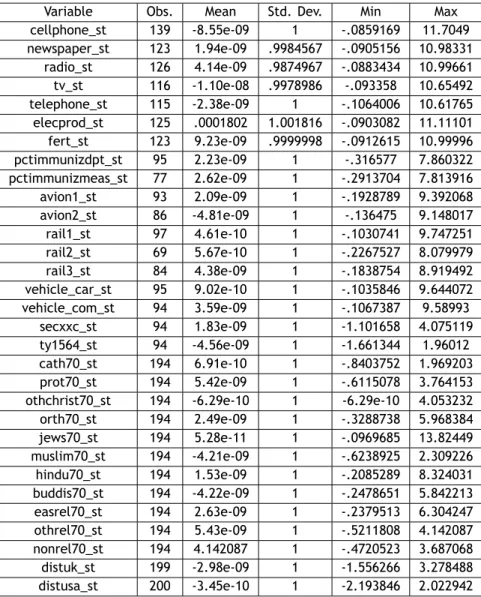
Briefly, the variables presented above in table 3.1 have the following descriptive statistics:
Variable Obs. Mean Std. Dev. Min Max cellphone_st 139 -8.55e-09 1 -.0859169 11.7049 newspaper_st 123 1.94e-09 .9984567 -.0905156 10.98331 radio_st 126 4.14e-09 .9874967 -.0883434 10.99661 tv_st 116 -1.10e-08 .9978986 -.093358 10.65492 telephone_st 115 -2.38e-09 1 -.1064006 10.61765 elecprod_st 125 .0001802 1.001816 -.0903082 11.11101 fert_st 123 9.23e-09 .9999998 -.0912615 10.99996 pctimmunizdpt_st 95 2.23e-09 1 -.316577 7.860322 pctimmunizmeas_st 77 2.62e-09 1 -.2913704 7.813916 avion1_st 93 2.09e-09 1 -.1928789 9.392068 avion2_st 86 -4.81e-09 1 -.136475 9.148017 rail1_st 97 4.61e-10 1 -.1030741 9.747251 rail2_st 69 5.67e-10 1 -.2267527 8.079979 rail3_st 84 4.38e-09 1 -.1838754 8.919492 vehicle_car_st 95 9.02e-10 1 -.1035846 9.644072 vehicle_com_st 94 3.59e-09 1 -.1067387 9.58993 secxxc_st 94 1.83e-09 1 -1.101658 4.075119 ty1564_st 94 -4.56e-09 1 -1.661344 1.96012 cath70_st 194 6.91e-10 1 -.8403752 1.969203 prot70_st 194 5.42e-09 1 -.6115078 3.764153 othchrist70_st 194 -6.29e-10 1 -6.29e-10 4.053232 orth70_st 194 2.49e-09 1 -.3288738 5.968384 jews70_st 194 5.28e-11 1 -.0969685 13.82449 muslim70_st 194 -4.21e-09 1 -.6238925 2.309226 hindu70_st 194 1.53e-09 1 -.2085289 8.324031 buddis70_st 194 -4.22e-09 1 -.2478651 5.842213 easrel70_st 194 2.63e-09 1 -.2379513 6.304247 othrel70_st 194 5.43e-09 1 -.5211808 4.142087 nonrel70_st 194 4.142087 1 -.4720523 3.687068 distuk_st 199 -2.98e-09 1 -1.556266 3.278488 distusa_st 200 -3.45e-10 1 -2.193846 2.022942
Table 3.1: Descriptive Statistics
3.2
Database’s Structure
The data described above in table 3.1 were processed and organized, originating a database that allowed the development of all the work and study.
Since by definition some variables were measured in terms of population, it has become neces-sary that the remaining were also divided by the same. Thus, collected population values, for each country for the year 2000, through Penn World Table. The cellphone,elecprod, fert_total,
newspaper, radio, railline, telephone, tv, vehicle_car and vehicle_com, variables were divided
by the data obtained. Finally, all variables were standardized, i.e., subtracted the mean and divided by the standard deviation, obtaining a distribution with mean zero and standard devia-tion equal to 1.
To understand the relationship between each technology and the factors related to religion, we estimated linear regressions by setting each of the technologies as dependent variable and the remaining as dependent variables.
aviationpkm = 633676.7 + 125697.4secxxc + 5400.811ty1564− 577967.2cath70
− 244149.4prot70 + 2752801othchrist70 + 1.54e + 08jews70 + 293632.5muslim70
+ 781496.7hindu70 + 1222463buddis70 + 2121448easrel70 + 41581.22othrel70 − 1063626nonrel70 − 12.48899distuk − 101.9917distusa
In this regression, it is defined aviationpkm as dependent variable and secxxc, ty1564, cath70,
prot70, othchrist70, jews70, muslim70, hindu70, buddis70, easrel70, othrel70, nonrel70, dis-tuk and distusa as independent variables.
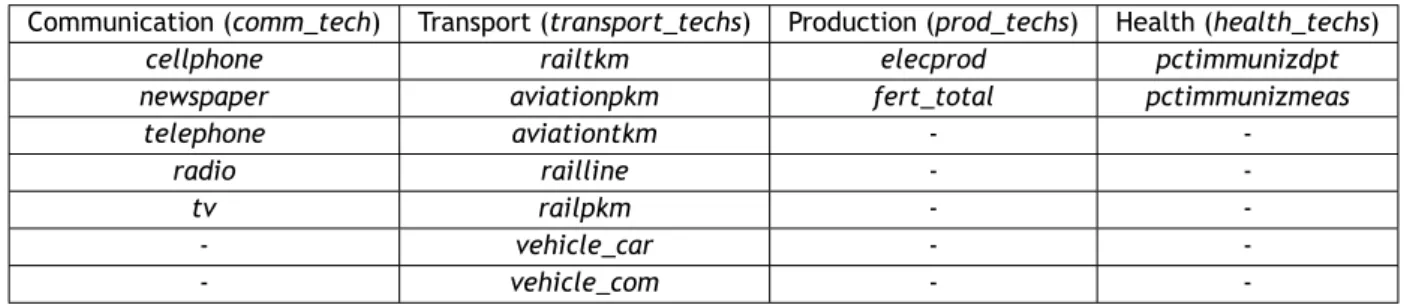
To apply the method of instrumentals variables, we collected data for 16 new variables, based on the distance from the capitals of countries of different religions to religious cities. These vari-ables are related to religious worship and not with the technology adoption. Thus, through the website www.distancefromto.net, collected the distances from the capital of each country to Rome (distRomaA and distRomaD) respectively measured by air and by land; applying the same method to Wittenberg (distWittA, distWittD), Istanbul (distIstambulA, distIstambulD), Mecca (distMecaA, distMecaD), Varanasi (distVaranasiA, distVaranasiD), Llasa (distLlasaA, distLlasaD), Jerusalem (distJerusalemA, distJerusalemD) and St. Petersburg (distPeterD, distPeterA). In the next step the variables were standardized and technologies grouped in 4 sets: communi-cation, transport, production and health.
Communication (comm_tech) Transport (transport_techs) Production (prod_techs) Health (health_techs)
cellphone railtkm elecprod pctimmunizdpt
newspaper aviationpkm fert_total pctimmunizmeas
telephone aviationtkm -
-radio railline -
-tv railpkm -
-- vehicle_car -
-- vehicle_com -
-Table 3.2: Groups of Technologies
Finally, the regressions of instrumental variables were estimated and applied the following di-agnostic tests:
• Kleibergen-Paap rk LM statistic • Cragg-Donald Wald F statistic • Stock-Wright LM S statistic • Hansen J-Statistic
• Endogeneity
Chapter 4
Results
This chapter summarize and explain the results obtained throughout the study. The chapter is divided into 2 sections, depending on the type of analysis performed. The section 4.1 presents the results obtained by the Ordinary Least Squares (OLS) method, according to the benchmark analysis. On the other hand, section 4.2 shows the results according to the robustness analysis, based in regressions with instrumental variables.
4.1
Benchmark Analysis
The analysis through regressions allows us to understand the relationship between two or more variables, whereas one (dependent) variable can be determined from the remaining (indepen-dent variables). The linear regression, considers that the relationship between the depen(indepen-dent variable and the independent variables is expressed by a linear function. Generally,
Yi= α + βxi+ εi (4.1)
The OLS method is applied to linear regressions, adjusting a set of values and points, the straight line that minimizes the quadratic sum of differences between given values to the values of the straight in these points.
The available data is a pure cross-section. Despite originally the technologies data are a panel data, observed for many countries through many years, the observations on the percentage of population that follow some religion is available on the source only on 1970. Thus for a cross-section, OLS is the appropriate method if we think regressors are exogenous. Picking religiosity on 1970 as a determinant of the cumulative technological adoption from 1970 to 2000 is in prin-ciple guaranteeing that there are not reverse causation between technology to religiosity as suggested by the previous literature, highlighted above. Of course there are other sources of possible endogeneity: omitted variables and measurement error. For the first possible cause, we also consider in regressions a variable for education and distance to UK and to the USA as possible controls. Measurement error issue is impossible to address without testing explicitly for endogeneity, which we will do in the next section. For those reasons we believe OLS is an appropriate approach to this problem, given the data constraints.
The estimated linear regressions (1-8 in table 4.1) seek to explain how the technology can be explained by religious variables. As described in the previous chapter, the technologies were grouped into 4 different sets. For each of technological sets regressions were estimated with variables related about education and with religion. Regression 1, for the group that integrates technologies related with communication, is defined by:
comm_tech =−0.4623699 − 0.0001168ty1564_st − 0.0004244distuk_st − 0.0000104distusa_st
And regression 2 is defined by:
comm_tech = −0.4630149 − 0.0012035ty1564_st + 0.001119cath70_st + 0.0010142prot70_st + 0.0001907othchrist70_st− 0.0000311orth70_st − 0.0087994jews70_st
− 0.0004414muslim70_st − 0.0003344hindu70_st + 0.0001165buddis70_st − 3.76e−06easrel70_st− 0.0003753othrel70_st − 0.0008195distuk_st + 0.0008distusa_st
The regressions were estimated in the same way for technologies related with production (3 and 4), transport (5 and 6) and health (7 and 8), shown in table 4.1.
Table 4.1: R egression OLS Method OLS Dep. V ariable comm_tech prod_techs transport_techs health_techs R egression 1 2 3 4 5 6 7 8 ty1564_st -0.0001168 (0.0004361) -0.0012035 (0.0020678) 0.0005312*** (0.0001071) 0.0004232*** (0.0001275) 0.1622488 (0.3564306) -0.0578008 (0.3930231) 0.0236459 (0.0230884) -0.0009758 (0.0329238) distuk_st -0.0004244* (0.000254) -0.0008195 (0.0007108) -0.0002588* (0.0001351) -0.0000878 (0.0001019) -0.3564396 (0.2514314) -0.0139728 (0.1450624) 0.0266121 (0.0247145) 0.0253223 (0.0224762) distusa_st -0.0000104 (0.0002428) 0.0008 (0.0015635) 0.0000522 (0.0000722) 0.0000528 (0.0001046) 0.1528106 (0.1537738) 0.2383355 (0.4904818) 0.0009647 (0.0293254) 0.0469508 (0.0426899) cath70_st -0.001119 (0.0013275) --0.0000736 (0.0001261) -3.182195 (3.287456) --0.157224 (0.1364865) prot70_st -0.0010142 (0.001072) -0.000286** (0.0001347) -2.955604 (2.856838) --0.1108161 (0.1066639) othchrist70_st -0.0001907 (0.0006927) --0.0000916 (0.0000596) -0.5753338 (0.71068) --0.0421437 (0.0400934) orth70_st --0.0000311 (0.0003672) --0.0000118 (0.000076) -1.26463 (1.407703) --0.0964782 (0.0708784) jews70_st --0.0087994 (0.0109008) -0.0006584 (0.0008469) -0.7066252 (3.007032) --0.2271877 (0.2732065) muslim70_st --0.0004414 (0.0010849) -0.0001887 (0.0002665) -3.349938 (3.163098) --0.1465033 (0.1345014) hindu70_st --0.0003344 (0.0005833) --0.000051 (0.0000602) -0.8086912 (0.9436336) --0.0685353 (0.0425893) buddis70_st -0.0001165 (0.0005653) --0.0000509 (0.0000636) -1.801344 (1.657062) --0.1569813** (0.0648807) easrel70_st --3.76e-06 (0.0003456) --0.0001036 (0.0001029) -0.5978177 (0.9044773) --0.0066911 (0.0389679) othrel70_st --0.0003753 (0.0012496) --0.0001241 (0.0001147) -0.7633107 (1.240949) --0.1476932** (0.0671733) Cons -0.4623699*** (0.0005775) -0.4630149*** (0.0006108) -0.1808645*** (0.0001223) -0.1807469*** (0.0001389) -0.401234 (0.3610107) -0.8167351* (0.4246604) -0.4417447*** (0.0283859) -0.4382842*** (0.0368676) N 59 59 86 86 39 39 52 52 R 2 0.0105 0.0966 0.2367 0.3116 0.0331 0.2229 0.0347 0.2347 Notes: R obust Standard deviation errors in brackets. Significance levels: ***(1%); **(5%); *(10%); for the other cases, the value is not statistically significant. 19
By analyzing table 4.1 we understand that religion and education aren’t very significant to ex-plain technologies. Specifying the education effect, only the technologies related to production can be explained by this variable, with significance at 1%. For regression 3, after a 1% change in education, technology varies inversely by 0.05%. Similarly, the regression 4 presents a variation 0.04%. Associated to a significance level of 10%, the distance the United Kingdom explains the technologies related to communication and production. Thus, according to regression 1, a vari-ation of 1% in distance leads to a 0.04% change in technologies related to communicvari-ation and 0.03% in technologies related to production. Specifying religions, technologies of communica-tion and transportacommunica-tion are not explained by religion. On the other hand, Protestantism explains the technologies of production with a significance level of 5%, while facing a 1% change in adher-ence to Protestantism, technologies of production vary at 0.02%. Finally, and with a significance level of 5%, the Buddhism and other minority religions influence health-related technologies. Faced with a 1% change in adherence to Buddhism or other religions, technologies related to health vary inversaly 15.6% and 14.7% respectively.
4.2
Instrumental Variables Regressions
The model of instrumental variables is used when the independent variable is endogenous, i.e. correlated with the error term of the regression. An instrument is defined as the variable that does not belong to the regression but is correlated with the explanatory variables.
To proceed with the estimation we used 8 instrumental variables (distRomaA, distWittA,
dis-tIstambulA, distMecaA, distVaranasiA, distLlasaA, distPeterA) defined by the distances of the
capitals of each country to the different religious cities. As independent variable we considered the different religions, and these can be influenced by instrumental variables1. A regression per
religion is performed.
Two problems are known in the validity of instrumental variables:
• The fact that the instruments may be weak, insufficiently correlated with the instrumental variable
• The lack of appropriateness of the instruments, these can be correlated with the error term.
Therefore, it is necessary to understand if these problems occur in regressions performed. The first step involves analyzing the significance of the regressors of the first stage regression. In the next moment we should apply some tests that allow us to understand the validity of instrumental variables:
• Kleibergen-Paap rk LM statistic, enables us to understand if instruments are insufficient to test the underidentification. The hypotheses are defined by:
Ho: matrix of reduced form coefficients has rank = K1-1 (underidentified) Ha: matrix has rank = K1 (Identified)
1
Due to the decrease in the degrees of freedmon caused by the introduction of instrumental variables, in calculating the technological adoption variables, we assume that each missing value in each component is an evidence of no adoption.
• Cragg-Donald Wald F statistic, may identify weak instruments. The assumptions of this test are defined by:
Ho: equation is weakly Identified
• Stock-Wright LM S statistic, analyzes the joint significance of endogenous variables in the main regression. If the test is rejected, the instruments can be used to explain the dependent variable, not only through instumented variable. The null hypothesis of the test is defined by:
Ho: B1 = 0 and overidentifying restrictions are valid
• Statistic-Hansen J, tests the suitability of instruments, i.e., those which are not correlated with the error.
A good instrumental variable regression shouldn’t reject the Stock-Wright LM S statistic and the Hansen J-Statistic test but reject the Kleibergen-Paap rk LM statistic and the Cragg-Donald Wald F statistic. Finally, we still performed a test of endogeneity of the instrumented variables. The endogeneity test allows us to understand whether there is correlation between the variables and the error terms. That is, a variable is exogenous in the absence of correlation with the error term. On the other hand, an variable is considered instrumental when it is not correlated with the error term, but is correlated with the explanatory variable. The hypotheses of the test are defined by:
Ho: Cov(xi, u) = 0, regressors are exogenous Ha: Cov(xi, u)̸= 0, regressors are endogenous
The results are organized into 8 different tables, based on one of the religions studied as an independent variable and the variable ty1564. For each religion, we carried out 4 regressions, where the dependent variable is each set technologies previously defined.
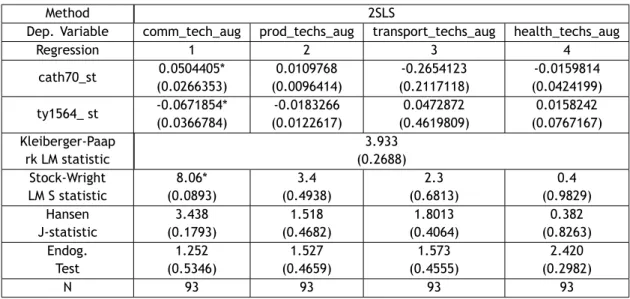
Regressions of table 4.2 are as follows:
comm_tech_aug =−0.405768 + 0.0504405cath70_st − 0.0671854ty1564_ st
prod_techs_aug =−0.1695111 + 0.0109768cath70_st − 0.0183266ty1564_ st
transport_techs_aug =−0.3248418 − 0.2654123cath70_st − 0.0159814ty1564_ st
health_techs_aug =−0.2659671 − 0.0159814cath70_st + 0.0158242ty1564_ st
In the following tables, we just change the religion which is defined as an independent variable.
Method 2SLS
Dep. Variable comm_tech_aug prod_techs_aug transport_techs_aug health_techs_aug
Regression 1 2 3 4 cath70_st 0.0504405* (0.0266353) 0.0109768 (0.0096414) -0.2654123 (0.2117118) -0.0159814 (0.0424199) ty1564_ st -0.0671854* (0.0366784) -0.0183266 (0.0122617) 0.0472872 (0.4619809) 0.0158242 (0.0767167) Kleiberger-Paap rk LM statistic 3.933 (0.2688) Stock-Wright LM S statistic 8.06* (0.0893) 3.4 (0.4938) 2.3 (0.6813) 0.4 (0.9829) Hansen J-statistic 3.438 (0.1793) 1.518 (0.4682) 1.8013 (0.4064) 0.382 (0.8263) Endog. Test 1.252 (0.5346) 1.527 (0.4659) 1.573 (0.4555) 2.420 (0.2982) N 93 93 93 93
Notes: Robust Standard deviation errors in brackets. Significance levels: ***(1%); **(5%); *(10%); for the other cases, the value isn’t statistically significant.
Table 4.2: Regression IV for adherence to Catholicism in 1970
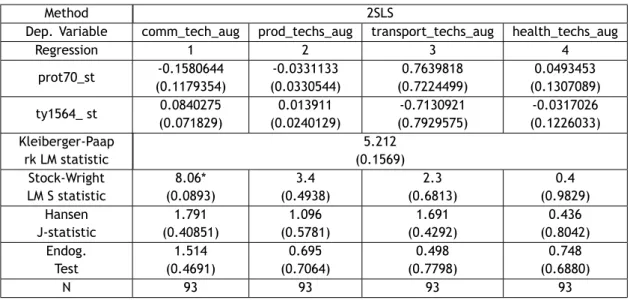
The results presented in table 4.2 relate to Catholicism, having cath70_st as explanatory vari-able. The independent variables are only significant in the first regression, explaining the comm_tech_aug variable, to a level of significance of 10%. So when Catholicism and educa-tion changes by 1%, the technologies related to communicaeduca-tion changes by 5.04% and 6.7% (in the reverse direction), respectively, with the variation of the independent variables. Also for the first regression, the Stock-Wright LM S statistic, rejects Ho, demonstrating that the instru-ment variables can be used to explain the dependent variable. The remaining tests applied to this regression show that the instrumental variables are adequate but may be insufficient. According to the endogeneity test, assuming as null hypothesis that the errors are not corre-lated with the independent variables, we understand that for the first regression the variables are exogenous. For the remaining regressions in this table, the regressors aren’t significant but the instrumental variables seem to be valid. Finally, according to the endogeneity test, the variables are exogenous, there is no correlation between the independent variables and the error term. Thus we identify a negative and significant effect of Catholicism on the adoption of communication technologies an effect that is highlighted when religion is taken as endogenous. The results for Table 4.3 are practically identical to the previous table. However, no indepen-dent variable (protestantism or education) is significant in explanation of technology adoption. Only the test of Stock-Wright LM S statistic is considered with a significant result, rejecting the null hypothesis for a level of significance of 10%. Thus, the technologies related to communica-tion can be explained by instrumental variables. The remaining tests accept the null hypothesis, for all regressions, indicating that the instruments are not sufficient but may be considered as appropriate for the model.
Method 2SLS
Dep. Variable comm_tech_aug prod_techs_aug transport_techs_aug health_techs_aug
Regression 1 2 3 4 prot70_st -0.1580644 (0.1179354) -0.0331133 (0.0330544) 0.7639818 (0.7224499) 0.0493453 (0.1307089) ty1564_ st 0.0840275 (0.071829) 0.013911 (0.0240129) -0.7130921 (0.7929575) -0.0317026 (0.1226033) Kleiberger-Paap rk LM statistic 5.212 (0.1569) Stock-Wright LM S statistic 8.06* (0.0893) 3.4 (0.4938) 2.3 (0.6813) 0.4 (0.9829) Hansen J-statistic 1.791 (0.40851) 1.096 (0.5781) 1.691 (0.4292) 0.436 (0.8042) Endog. Test 1.514 (0.4691) 0.695 (0.7064) 0.498 (0.7798) 0.748 (0.6880) N 93 93 93 93
Notes: Robust Standard deviation errors in brackets. Significance levels: ***(1%); **(5%); *(10%); for the other cases, the value isn’t statistically significant.
Table 4.3: Regression IV for adherence to Protestantism in 1970
Method 2SLS
Dep. Variable comm_tech_aug prod_techs_aug transport_techs_aug health_techs_aug
Regression 1 2 3 4 othchrist70_st 0.1421861 (0.1096406) 0.0347402 (0.0357786) -1.198369 (1.065372) 0.0124146 (0.1441068) ty1564_ st 0.0686633 (0.0617783) 0.0164509 (0.0193626) -0.2757467 (0.5653895) -0.05965 (0.0807662) Kleiberger-Paap rk LM statistic 3.320 (0.1902) Stock-Wright LM S statistic 3.24 (0.3568) 1.55 (0.6715) 2.84 (0.4167) 2.82 (0.4201) Hansen J-statistic 0.000 (0.9883) 0.164 (0.6852) 0.606 (0.4362) 0.591 (0.4420) Endog. Test 3.479 (0.1756) 0.983 (0.6116) 1.455 (0.4831) 3.751 (0.1532) N 93 93 93 93
Notes: Robust Standard deviation errors in brackets. Significance levels: ***(1%); **(5%); *(10%); for the other cases, the value isn’t statistically significant.
Table 4.4: Regression IV for adherence to other Christianism in 1970
Table 4.4, table 4.6 and table 4.9 shows that no significant results, despite the fact that the instruments used are acceptable in the context of this regression. According to the endogenity test all variables are exogenous to all regressions.
According to Table 4.5, it is noted again that no regressors are significant. The null hypothesis is rejected for all tests, except for the Kleibergen-Paap rk LM statistic, showing that the mod-els are identified. For the first regression, the endogeneity test, rejects the null hypothesis, demonstrating that the variable is endogenous. The null hypothesis is not rejected for the re-maining regressions, being the variables exogenous.
Method 2SLS
Dep. Variable comm_tech_aug prod_techs_aug transport_techs_aug health_techs_aug
Regression 1 2 3 4 orth70_st -0.0679267 (0.0530208) -0.0138523 (0.017844) 0.6872973 (0.6112282) -0.0249356 (0.080618) ty1564_ st 0.0307655 (0.0256616) 0.0063219 (0.0087471) 0.0072896 (0.3148238) -0.0569376 (0.0554266) Kleiberger-Paap rk LM statistic 6.56** (0.0376) Stock-Wright LM S statistic 3.24 (0.3568) 1.55 (0.6715) 2.84 (0.4167) 2.82 (0.4201) Hansen J-statistic 0.325 (0.5686) 0.686 (0.4075) 0.251 (0.6162) 0.587 (0.4435) Endog. Test 5.735* (0.0569) 2.324 (0.3128) 1.957 (0.3760) 3.067 (0.2158) N 93 93 93 93
Notes: Robust Standard deviation errors in brackets. Significance levels: ***(1%); **(5%); *(10%); for the other cases, the value isn’t statistically significant.
Table 4.5: Regression IV for adherence to Orthodox in 1970
Method 2SLS
Dep. Variable comm_tech_aug prod_techs_aug transport_techs_aug health_techs_aug
Regression 1 2 3 4 jews70_st 1.432368 (1.354306) 0.2218391 (0.4290677) -17.43247 (16.09058) 1.012439 (2.238693) ty1564_ st -0.0206704 (0.0334741) -0.0027 (0.0100165) 0.589119 (0.4230272) -0.0859824 (0.0620628) Kleiberger-Paap rk LM statistic 4.528 (0.1039) Stock-Wright LM S statistic 3.24 (0.3568) 1.55 (0.6715) 2.84 (0.4167) 2.82 (0.4201) Hansen J-statistic 0.947 (0.3304) 1.031 (0.3100) 0.198 (0.6563) 0.313 (0.5761) Endog. Test 2.173 (0.3374) 0.606 (0.7385) 1.917 (0.3836) 4.095 (0.1291) N 93 93 93 93
Notes: Robust Standard deviation errors in brackets. Significance levels: ***(1%); **(5%); *(10%); for the other cases, the value isn’t statistically significant.
Table 4.6: Regression IV for adherence to Judaism in 1970
Table 4.7, associated with the Muslim religion, shows that the variable muslim70 is significant in explaining the dependent variable on a significance level of 10%. Thus, after a change of 1% in adherence to the Muslim religion, the technologies related to communication vary inversely with an effect of 8.2%. According to the test of Kleibergen-Paap rk LM statistic we understand that the null hypothesis is rejected with a significance level of 1%, defining the models as identified. Still on regression 1, it is checked that independent variables are endogenous, with a level of significance of 1%, highlighting that the instrumental variables approach is necessary to reveal this effect.
Method 2SLS
Dep. Variable comm_tech_aug prod_techs_aug transport_techs_aug health_techs_aug
Regression 1 2 3 4 muslim70_st -0.0822017* (0.0424386) -0.0175543 (0.0162386) 0.6267278 (0.5013192) -0.0665817 (0.0812697) ty1564_ st -0.0131631 (0.021156) -0.0024913 (0.0068617) 0.5004054 (0.3401755) -0.0636988 (0.0483513) Kleiberger-Paap rk LM statistic 16.369*** (0.0010) Stock-Wright LM S statistic 6.98 (0.1372) 4.29 (0.3684) 4.13 (0.3887) 4.23 (0.3760) Hansen J-statistic 0.689 (0.7086) 1.103 (0.5761) 0.837 (0.6579) 3.721 (0.1556) Endog. Test 9.078*** (0.01) 3.072 (0.1571) 1.684 (0.4309) 2.921 (0.2321) N 93 93 93 93
Notes: Robust Standard deviation errors in brackets. Significance levels: ***(1%); **(5%); *(10%); for the other cases, the value isn’t statistically significant.
Table 4.7: Regression IV for adherence to Muslim Religion in 1970
Method 2SLS
Dep. Variable comm_tech_aug prod_techs_aug transport_techs_aug health_techs_aug
Regression 1 2 3 4 hindu70_st -0.0087315 (0.0148366) 0.0014557 (0.0055349) -0.0765286 (0.0900675) 0.0123755 (0.0323031) ty1564_ st 0.0137236 (0.0146722) 0.0024175 (0.0046918) 0.1726084 (0.2511022) -0.0170308 (0.0454993) Kleiberger-Paap rk LM statistic 8.963* (0.0620) Stock-Wright LM S statistic 8.96 (0.1105) 4.34 (0.5014) 4.34 (0.5012) 2.52 (0.7741) Hansen J-statistic 6.516* (0.0890) 4.509 (0.2115) 1.833 (0.6078) 2.161 (0.5398) Endog. Test 2.248 (0.3250) 0.300 (0.8607) 2.216 (0.3303) 1.145 (0.5642) N 93 93 93 93
Notes: Robust Standard deviation errors in brackets. Significance levels: ***(1%); **(5%); *(10%); for the other cases, the value isn’t statistically significant.
Table 4.8: Regression IV for adherence to Hinduism in 1970
Finally, we analysed the table 4.8, which allowed us to conclude relations with Hinduism reli-gion. The results show us that none of the independent variables (Hinduism or education) are significant to explaining technology adoption. The test of Kleibergen-Paap rk LM shows statistic that we reject the null hypothesis, concluding that the models are identified with a significance level of 10%. According to the test of Hansen J-Statistic for regression 1, we find that the null hypothesis is rejected with a significance level associated of 1%, demonstrating that the instru-ments are inappropriate. The endogenity test demonstrates for all models that variables are exogenous, i.e. not rejects the null hypothesis.
Method 2SLS
Dep. Variable comm_tech_aug prod_techs_aug transport_techs_aug health_techs_aug
Regression 1 2 3 4 buddis70_st -0.0044062 (0.0346293) 0.0030201 (0.0130407) 0.1513532 (0.1669124) -0.0008025 (0.0527732) ty1564_ st 0.0128963 (0.0346293) 0.0021428 (0.00044647) 0.1310577 (0.2679018) -0.0145858 (0.0464865) Kleiberger-Paap rk LM statistic 5.796 (0.2149) Stock-Wright LM S statistic 8.96 (0.1105) 4.34 (0.5014) 4.34 (0.5012) 2.52 (0.7741) Hansen J-statistic 8.810* (0.0319) 4.227 (0.2380) 1.802 (0.6145) 2.211 (0.5298) Endog. Test 1.473 (0.4787) 0.708 (0.7019) 1.466 (0.4805) 0.309 (0.8566) N 93 93 93 93
Notes: Robust Standard deviation errors in brackets. Significance levels: ***(1%); **(5%); *(10%); for the other cases, the value isn’t statistically significant.
Table 4.9: Regression IV for adherence to Buddism in 1970
Chapter 5
Conclusion
This dissertation studies an almost overlooked link between religiousity and technological adop-tion. Although this link has been previously suggested by the literature that root the deter-minants of economic development on culture and values of the society (e.g. the Max Weber’s acclaimed view of a historical and sociological abidance between ‘protestant ethics’ and ‘the spirit of capitalism’). The work presented here implied the merge of two main sources of data: one for religiousity and another for technology adoption. This allowed us to study the percent-age of the population that follows certain religion as determinants of technological adoption of different technologies.
Throughout the study we found some conclusions which allow to relate religion and technol-ogy. In the OLS results as expected, education relates positively and significantly with the technologies related to production. That is, a higher education leads to a higher demand and evolution for production technologies. When comparing the distance with the United Kingdom with the technologies of communication and production, it appears that this is negatively and significantly. However, by introducing religion in this study, this negative effect disappears. By analyzing each religion is understood that the percentage of population that is dedicated to Protestantism increases technological progress, especially in technology related to the pro-duction. On the other hand, the percentage of population that is dedicated to Buddhism and other minority religions, tend to decrease technological adoption in health-related technologies. The dissertation also proposes a new approach to instrumenting religion, consisting on the use of the distance of each country to the main worship places of each religion. The results using instrumental variables highlight two new negative and significant effects of Catholicism and Muslim to communication technologies adoption.
Eventhough the dissertation presents less statistical significant effects than initially expected, this in fact comes in line with previous attempts that related religion with economic growth. It is believed that this work opens a wide line of empirical research, which will be possible as more data about religion would be available in the future.
Bibliography
[É.82] É.-Durkheim. The Elementary Forms of the Religious Life. Dover Publications, 1982. 6 [Ber08] P. Berger. Secularization falsified, February 2008. Available from: http://www.
firstthings.com/article/2008/02/002-secularization-falsified. 8
[CA75] R. Ehrenberg C. Azzi. Household allocation of time and church attendance. ILR
Collec-tion, 1975. 7
[CB11] N. Berggren C. Bjørnskov. Does religiosity promote property rights and the rule of law?
Research Institute of Industrial Economics, 2011. 11
[Chr97] C. M. Christensen. The innovator’s dilemma. Harvard Business School Press, 1997. 5 [CS07] Daniel Cohen and Marcelo Soto. Growth and human capital: good data, good results.
Journal of Economic Growth, 2007. 14
[DC09] B. Hobijn D. Comin. The chat dataset [online]. 2009. Available from: http://www. nber.org/data/chat/ [cited January 2014]. 14
[DH13] H. Strulik D. Herzer. Religiosity and income: A panel cointegration and causality anal-ysis. Center for European Governance and Economic Development Research, 2013. 11 [Dow07] J. Dow. A scientific definition of religion. ampere.net, 2007. 5
[Dvo04] J. Dvorak. The myth of disruptive technology, August 2004. Available from: http: //www.pcmag.com/article2/0,2817,1628049,00.asp. 5
[Eum11] W. Eum. Religion and economic development - a study on religious variables influencing gdp growth over countries. University of California, 2011. 10
[FC13] D. Yanagizawa-Drott F. Campante. Does religion affect economic growth and happiness? evidence from ramadan. National Bureau of Economic Research, 2013. 10
[FG13] W. Souza F. Gomes. Modernidade e pluralismo religioso. Revista Científica Semana
Académica, 2013. 8
[Geo67] S. George. Religion and Technology in the 21st Century. Information Science Publishing, 1967. 5, 6
[Gra01] A. Grath. Christian Theology: An introduction. Regent College, Vancouver, 2001. 6 [Hor13] M. S. Horton. The secularization thesis. Modern Reformation, 2013. 8
[J. 13] J. Bowyer. Is religion an essential driver of economic growth? [online]. 2013. Available from: http://www.forbes.com/sites/jerrybowyer/2013/05/29/ is-religion-an-essential-driver-of-economic-growth/ [cited May 2014]. 1 [LB11] E. Dijkgraaf L. Bettendorf. The bicausal relation between religion and income. Applied
Economics, 2011. 11
[LG06] L. Zingales L. Guiso, P. Sapienza. Does culture affect economic outcomes? National
Bureau of Economic Research, 2006. 4
[PF96] R. Ellery P. Ferreira. Crescimento económico, retornos crescentes e concorrência mo-nopolista. Revista de Economia Política, 1996. 3
[RB03] R. McCleary R. Barro. Religion and economic growth across countries. American
Socio-logical Review, 2003. 4
[RB09] R. McCleary R. Barro. Saints marching in, 1590-2009. Harvard University, 2009. 4, 9, 10
[Sol56] R. Solow. A contribution to the theory of economic growth. Quarterly Journal of
Eco-nomics, 1956. 3
[TM11] S. Zignago T. Mayer. Notes on cepii’s distances measures: The geodist database [online]. 2011. Available from: http://www.cepii.fr/CEPII/en/bdd_modele/presentation. asp?id=6 [cited February 2014]. 14
[W. 10] W. Sanchez. Pluralismo religioso: entre a diversidade e a liberdade [on-line]. 2010. Available from: http://www.ihu.unisinos.br/entrevistas/ 34166-pluralismo-religioso-entre-a-diversidade-e-a-liberdade-entrevista\ -especial-com-wagner-lopes-sanchez [cited January 2014]. 9
[Web30] The Protestant Ethic and the Spirit of Capitalism. Allen & Unwin, 1930. 4