Policy
ISSN: 2146-4553
available at http: www.econjournals.com
International Journal of Energy Economics and Policy, 2017, 7(3), 208-215.
On the Dynamics of Energy-growth Nexus: Evidence from a
World Divided into Four Regions
Luís Miguel Marques
1*, José Alberto Fuinhas
2, António Cardoso Marques
31NECE-UBI, University of Beira Interior, Rua Marquês d’Àvila e Bolama, 6201-001 Covilhã, Portugal, 2NECE-UBI, University of
Beira Interior, Rua Marquês d’Àvila e Bolama, 6201-001 Covilhã, Portugal, 3NECE-UBI, University of Beira Interior, Rua Marquês
d’Àvila e Bolama, 6201-001 Covilhã, Portugal. *Email: [email protected]
ABSTRACT
This paper provides a comparative analysis of the energy-growth nexus in different world regions by using an identical methodology for each one, thereby avoiding the usual problem of results varying due to the use of differing methodologies. To access data covering the entire world, four regions were used: (i) America (North and South); (ii) Europe and Central Asia; (iii) Asia Pacific; and (iv) Africa and the Middle East. Annual aggregated time series from 1968 to 2013, and an auto-regressive distributed lag approach were used. The results suggest that, in the long-run: (a) The “feedback hypothesis” is present in America and Asia Pacific; (b) the “conservation hypothesis” was found in Europe and Central Asia and in Africa and the Middle East. Moreover, the results suggest that historical events, such as the oil shocks of 1970 and 1980 and the 2008 financial crisis, have heterogenous impacts across the world.
Keywords: World Energy-growth Nexus, Auto-regressive Distributed Lag Bounds Test, America, Europe and Central Asia, Asia Pacific, Africa and
Middle East
JEL Classifications: C32, E03, O11, Q43
1. INTRODUCTION
In academic literature on the subject, it has become widely accepted that dissimilar conclusions are reached about the energy consumption – economic growth nexus, in different parts of the world. With increasingly global energy markets and greater international cooperation, this raises uncertainties about the impact of global energy policies. Despite this globalization, energy markets will develop differently throughout the world in coming years. For instance, the demand for energy will keep growing in emerging economies. Strong growth in Asia will most likely drive increasing energy consumption and, to satisfy this, some oil producers will play a major role by increasing oil supply. To make sense of all this, policymakers need to understand the impact of increasingly globalized energy policies on economic growth. In response to this scenario, this paper intends to review the energy-growth nexus globally, by dividing the world into four regions: America (North and South); Europe and Central Asia;
Asia Pacific; and Africa and the Middle East. This division allows data to be collected for the entire world, thus permitting a valid comparison of the findings for each region. To do this, long-run samples and identical methodologies were used. The use of different methodologies in published studies has been cited as one of the main reasons for divergences in their overall results. The central question of the research is: Are the results heterogeneous for the energy-growth nexus in America, Europe and Central Asia, Asia Pacific, and Africa and the Middle East when subjected to the same methodology? To answer this question, an autoregressive distributed lag (ARDL) bounds test was performed and the short-run semi-elasticities and long-short-run elasticities estimated. The use of an ARDL model is suitable for dealing with endogeneity between the variables as well as controlling for structural breaks by introducing dummy variables.
This paper contributes to the energy-growth nexus literature by providing comparable results between different aggregates of
countries covering the entire world. In addition, the best-known historical economic events that impacted the nexus in the four regions were examined. Overall, in the long-run, the “feedback hypothesis” was found for America and Asia Pacific and the “conservation hypothesis” for Europe and Central Asia and for Africa and the Middle East. In the short-run, the “feedback hypothesis” was confirmed for all the world regions, except for Africa and the Middle East where no short-run causality was found. These findings suggest that the use of energy restrictive policies is not advisable for America and Asia Pacific. In Africa and the Middle East, the abundance of natural energy resources is probably hampering economic growth. In addition, the results prove that historical events have had different impacts on each world region, supporting the argument that region-specific policies are needed to deal with crises.
The paper is organized as follows: Section 2 consists of a brief review of nexus literature; Section 3 describes the data and methodology used; Section 4 shows the results which are discussed in Section 5; and Section 6 presents the conclusions.
2. LITERATURE REVIEW
For decades, the energy-growth nexus has been a central theme in energy economics research (e.g., Han et al., 2004; Kraft and Kraft, 1978; Masih and Masih, 1996; Narayan, 2016). In the literature, four kinds of relationships between energy consumption and economic growth have been found.
The “neutrality hypothesis” asserts that there is no causality between energy consumption and economic growth (e.g., Śmiech and Papież, 2014; Yıldırım et al., 2014). In contrast, the “feedback hypothesis” states that there is bi-directional causality between energy consumption and economic growth (e.g., Adams et al., 2016; Marques et al., 2015). Moreover, unidirectional causalities have been found in the nexus. A unidirectional causality running from economic growth to energy consumption is known as the “conservation hypothesis” (e.g., Al-Mulali et al., 2013; Pao and Fu, 2013) and a unidirectional causality from energy consumption to economic growth is known as the “growth hypothesis” (e.g., Borozan, 2013; Jahangir et al., 2012).
Studies of world regions using panels of countries are common (e.g., Akinlo, 2008; Ozturk et al., 2010; Fuinhas and Marques, 2012; Rezitis and Ahammad, 2015, Narayan, 2016; Pala, 2016; Dritsaki and Dritsaki, 2014; Ozturk and Acaravci, 2011; Aali-Bujari et al., 2017). However, there is a lack of consensus in the literature that arises from various factors, such as the period analyzed, or the econometric approach used, among others (Ozturk, 2010; Bouoiyour et al., 2014). For instance, Eggoh et al. (2011) found bi-directional causality between energy consumption and economic growth for 21 African countries, while, Esso (2010), argued that economic growth causes energy consumption in sub-Saharan African countries. Nasreen and Anwar (2014), found bi-directional causality between energy consumption and economic growth for 15 Asian countries over the period of 1980-2011, while, for 16 Asia Pacific countries, Fang and Chang (2016) found causality running from economic
growth to energy consumption over the period of 1970-2011. Ozcan (2013) argued that there is short-run unidirectional causality running from economic growth to energy consumption in 12 Middle East countries. On the other hand, Sadorsky (2011) and Omri (2013) found bi-directional causality between energy and growth for 8 Middle East countries and 14 MENA countries, respectively. With regard to Europe, Kasperowicz (2014) found that energy consumption is positively related to economic growth for 12 European countries. In South America, Sadorsky (2012) found no relationship between energy and output in the short-run, and bi-directional causality between energy and output in the long-run. The literature demonstrates the heterogeneity of the energy-growth nexus across the world. The use of aggregated variables enables us to take a fresh look at the world energy-growth nexus, providing valuable support for formulating the integrated energy policies that are anticipated. Recently, Marques et al. (2015) applied aggregated variables to the global nexus, and concluded that there is a bi-directional causality between energy and growth.
In the literature, different methodologies have been used in research on the nexus, and these can be divided into four types: (i) Studies based on vector autoregression methodology (Sims, 1972) and Granger causality, assuming stationarity (Kraft and Kraft, 1978; Yu and Hwang, 1984); (ii) studies based on non-stationary series and Granger (1988) cointegration theory using a correction model to test for causality (Cheng and Lai, 1997; Glasure and Lee, 1998); (iii) studies using multivariate estimators with more than two variables in the cointegration relationship (Ishida, 2012; Jammazi and Aloui, 2015; Lee and Chang, 2005; Ocal and Aslan, 2013; Oh and Lee, 2004; Pao and Fu, 2013; Stern, 2000); and (iv) studies based on panel cointegration and panel error correction models (ECMs) (Al-Iriani, 2006; Caraiani et al., 2015; Ciarreta and Zarraga, 2010; Damette and Seghir, 2013; Mohammadi and Parvaresh, 2014; Sadorsky, 2011).
In recent years the use of the ARDL approach introduced by Pesaran and Shin (1999), and extended by Pesaran et al. (2001), has increased due to the technique’s flexibility in dealing with different data proprieties, for example Fuinhas and Marques (2012). Indeed, this methodology allows the correction of outliers and structural breaks. Some well-known historical events have had an impact on the nexus, particularly the oil shocks of 1973 and 1979, and the 2008 financial crisis. Controlling for possible structural breaks provides important information about the impact of those historical episodes. This is far from new in the literature. For instance, Marques et al. (2016) used impulse dummies to control for milestones in different sources of energy.
3. METHODOLOGY
This paper focuses on the global energy-growth nexus by dividing the world into four regions, namely: (i) America; (ii) Europe and Central Asia; (iii) Asia Pacific; and (iv) Africa and the Middle East. The information available restricted the study of aggregates to those cited. This was done by extracting the gross domestic product (GDP) (Y) and the primary energy consumption (E) for different regional aggregates from the World Bank’s
Development Indicators and the BP Statistical Review of World Energy, respectively. Y is measured in constant 2010 dollars and E is measured in tonnes of oil equivalent. To make the variables compatible, the data has been reorganized. The use of homogenous variables is required to meet this paper’s goal of applying the same methodology to different regions. The data comprises annual observations from 1968 to 2014. The prefix “L” denotes the natural logarithm, and “D” denotes the first difference of variables. Eviews 9.5 econometric software was used. Summary statistics are presented in Table 1.
The dynamics between energy consumption and economic growth were analyzed and the impact of historical events on the various nexus were observed. To do this, analyses of bivariate models with annual GDP (Y) and primary energy consumption (E) were performed. The use of bivariate models is recurrent in the literature (see for instance Hamit-Haggar, 2016; Marques et al., 2015; Mohammadi and Amin, 2015). When the aim is to evaluate the four traditional hypotheses for the energy-growth nexus, bivariate models have the advantage of allowing a direct interpretation of the relationships between variables. It should be noted that, to assess bivariate adequacy, the models should be exhaustively tested for normally distributed errors, serial correlation and autoregressive conditional heteroskedasticity.
Given that interactions between energy and growth were expected, the use of an ARDL model, as in Pesaran et al. (2001), is suitable because it can deal with endogeneity. For this, the variables must be I(0) or I(1). The integration order of the variables was evaluated through: (i) Graphical analyses of the level variables, and their first differences; (ii) visual examination of the series and their correlograms (not shown, to save space); and (iii) a modified Dickey–Fuller (MDF) test that follows Perron (1989) (Table 2). The MDF test allows the integration order of the variables to be analyzed in the presence of a single structural break, revealing the break date. For this reason, the MDF test is a first assessment of possible breakpoint dates in the models.
The MDF test suggests that all variables are at the most I(1). In addition, the results suggest that the recessions and energy crisis of the early 1980s had a worldwide impact. In the case of America, the results suggest that the 2008 financial crisis had an impact on economic growth, and that the recession of the early 1990s had an impact on American energy consumption. Likewise, the 2008 financial crisis impacted economic growth in Europe and Central Asia. In Asia Pacific, both variables were influenced by the Asian financial crisis of 1997. Given that the MDF unit root test identifies possible structural breaks, the use of ARDL methodology is suitable because it allows structural breaks to be controlled by
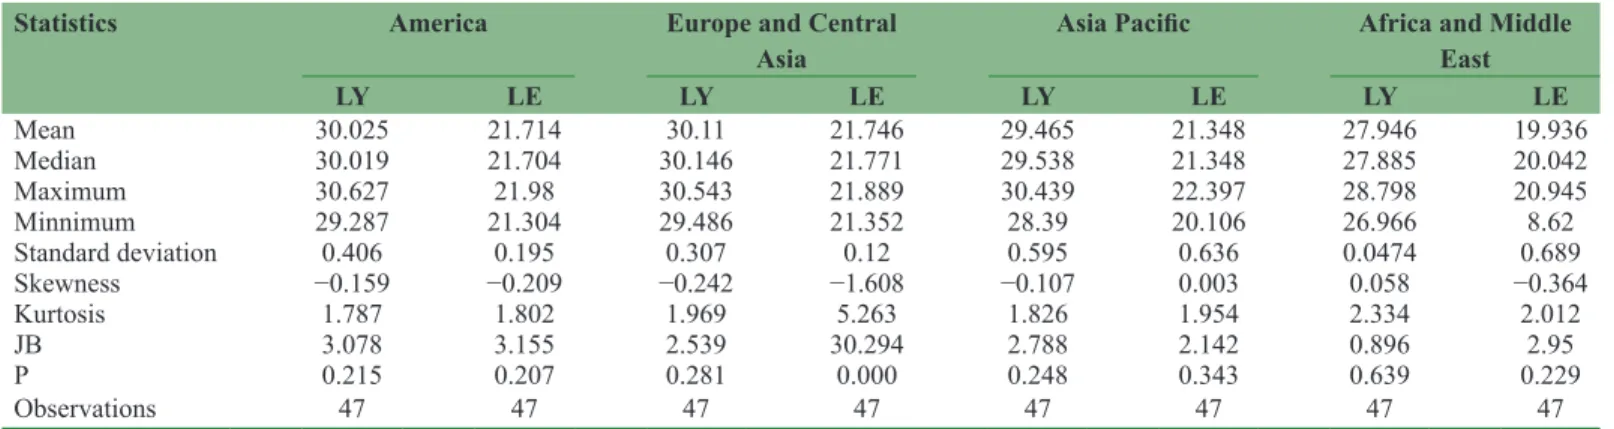
Table 1: Summary statistics
Statistics America Europe and Central
Asia Asia Pacific Africa and Middle East
LY LE LY LE LY LE LY LE Mean 30.025 21.714 30.11 21.746 29.465 21.348 27.946 19.936 Median 30.019 21.704 30.146 21.771 29.538 21.348 27.885 20.042 Maximum 30.627 21.98 30.543 21.889 30.439 22.397 28.798 20.945 Minnimum 29.287 21.304 29.486 21.352 28.39 20.106 26.966 8.62 Standard deviation 0.406 0.195 0.307 0.12 0.595 0.636 0.0474 0.689 Skewness −0.159 −0.209 −0.242 −1.608 −0.107 0.003 0.058 −0.364 Kurtosis 1.787 1.802 1.969 5.263 1.826 1.954 2.334 2.012 JB 3.078 3.155 2.539 30.294 2.788 2.142 0.896 2.95 P 0.215 0.207 0.281 0.000 0.248 0.343 0.639 0.229 Observations 47 47 47 47 47 47 47 47 JB: Jarque-Bera
Table 2: MDF unit root tests
Regions LY LE DLY DLE
America
t-statistic −4.83** −3.384 −5.961*** −7.508***
Specification (3) (3) (3) (1)
Break 2008 1992 1982 1983
Europe and Central Asia
t-statistic −3.984 −3.818 −5.840*** −5.808*** Specification (1) (1) (4) (3) Break 2009 1991 2009 1998 Asia Pacific t-statistic −5.011** −5.137** −8.543*** −5.202*** Specification (3) (3) (4) (4) Break 1997 2002 1998 1998
Africa and Middle East
t-statistic −5.373*** −4.305 −7.123*** −9.531**
Specification (3) (1) (1) (4)
Break 1982 1981 1987 1985
Trend specification/break specification: (1) Trend and intercept/trend and intercept; (2) trend and intercept/trend only; (3) trend and intercept/intercept only; (4) intercept only/intercept only. *** and ** denote statistical significance at 1% and 5% level, respectively. MDF: Modified Dickey–Fuller
introducing dummies. The need to introduce dummies in the ARDL model was evaluated using the Bay-Perron multiple breakpoints test and the Quandt-Andrews breakpoint test. The presence of cointegration was assessed using the ARDL bounds test approach introduced by Pesaran and Shin (1999) and extended by Pesaran et al. (2001) The general form of the unrestricted ECM of the ARDL may be specified as follows:
DLY t DLY DLE LY
LE t i k i t i i k i t i t t = + + + + + + = − = − − −
∑
∑
α α α α α α 0 1 1 2 0 3 4 1 5 1 µµ1t (1)Where the expected parameter signs are α0 ≠ 0, α1 ≠ 0, α2i ≠ 0, α3i ≠ 0, α4 < 0, α5 < 0. The parameters α2i, α3i, explain the short-run dynamic coefficients, while α4, α5 explain the long-run multipliers.
DLE t DLE DLY LE
LY t i k i t i i k i t i t t = + + + + + + = − = − − −
∑
∑
β β β β β β 0 1 1 2 0 3 4 1 5 1 µµ2t (2)Where, the expected parameter signs are β0 ≠ 0, β1 ≠ 0, β2i ≠ 0, β3i ≠ 0, β4 < 0, β5 < 0. The parameters β2i, β3i explain the short-run dynamic coefficients, while β4, β5 explain the long-run multipliers. Equation (1) leads to the following models: (i) A-Y, in the case of America; (ii) ECA-Y, for Europe and Central Asia; (iii) AP-Y, for Asia Pacific; and (iv) AME-Y, for Africa and the Middle East. Similarly, equation (2) leads to the following models: (i) A-E, for America; (ii) ECA-E, for Europe and Central Asia; (iii) AP-E, for Asia Pacific; and (iv) AME-E, Africa and the Middle East. To analyse short- and long-run behavior, short-run semi-elasticities and the long-run elasticities were performed.
4. RESULTS
Following the aforementioned methodology, the ARDL estimation, as per Pesaran et al. (2001), was performed (Table 3). To do this, the Eviews 9.5 automatic model selection criteria with 1 max lags was used. The use of 1 max lag allowed the short-run semi-elasticities, and the long-run elasticities to be estimated, without consuming too many degrees of freedom or compromising the quality of the results. The model’s residuals visually revealed the presence of structural breaks, which were confirmed by the Bay-Perron multiple breakpoints test and the Quandt-Andrews breakpoint test. To handle the structural breaks, shift dummies were introduced in the ARDL models. Following a parsimonious approach, variables that did not reveal statistical significance were removed from the estimations. In addition, impulse dummies were introduced to control for outliers.
All the dummies proved to be statistically significant, to at least a 10% level. The quality of the models was assessed by performing all the relevant diagnostic tests (Table 4), such as: (1) The Jarque– Bera normality test; (2) the Breusch–Godfrey serial correlation Lagrange multiplier test; (3) the autoregressive conditional
heteroskedasticity test for heteroskedasticity; and (4) the Ramsey RESET test for model specification. In general, the models revealed normally distributed errors, no serial correlation in the residuals, and no autoregressive conditional heteroskedasticity. By using the correlograms, the possibility of serial correlation in the AP-E model was analyzed in detail. No statistical significance was revealed. For this reason, serial correlation was not considered a problem.
The results revealed that America experienced permanent shifts in the energy-growth nexus caused by the second oil shock of 1979 and the 1987 stock market crash. In the European and Central Asian aggregates, the nexus was similarly impacted by the 1987 crash. For Europe and Central Asia, the period after 1994 also needed to be controlled. In this period, economic growth and energy consumption recovered after the major recession of 1990, with economic growth increasing faster than energy consumption. Moreover, the 2008 financial crisis impacted Europe and Central Asia by causing a decrease in both economic growth and energy consumption. Asia Pacific, experienced impacts from both the first and second oil shocks (1970 onwards and 1979 onwards). Additionally, the period from 1991 onwards, corresponding to the end of the Gulf War, impacted the Asia Pacific nexus. In Africa and the Middle East impacts on the nexus from the second oil shock were also observed. Additionally, Asia Pacific, and Africa and the Middle East experienced several disturbances in the nexus which were revealed in the model’s residuals and needed to be controlled using impulse dummies.
Given that the models passed all the relevant diagnostic tests, the ARDL bounds test were performed (Table 5). The bounds test revealed the presence of cointegration at the statistical significance of 1% for models A-Y, A-E, ECA-E, AP-Y, AP-E, AME-Y and AME-E.
The short-run semi-elasticities and long-run elasticities are presented in Table 6. The short-run semi-elasticities correspond to the coefficient of the first differenced variable. The long-run elasticities are calculated by dividing the coefficient of the lagged independent variable by the coefficient of the lagged independent variable, multiplied by −1.
All coefficients of short-run semi-elasticities revealed statistical significance at 1% level. With respect to long-run elasticities, the coefficients of the model AME-Y revealed statistical significance at a 10% level which must be considered inconclusive. All other long-run elasticities coefficients revealed statistical significance at 1%. In summary, our results reveal that, in the long-run, there is evidence of bi-directional causality between energy and growth in America and Asia Pacific, while in Europe, Central Asia, and Africa and the Middle East, there is causality running from economic growth to energy.
5. DISCUSSION
This paper is of particular interest because it provides directly comparable outcomes for different global regions, and offers an alternative perspective to the literature in which different results
have been found for the same countries or regional aggregates. The use of different methodologies has been acknowledged as one of the main causes of this divergence in overall results. However, the
paper’s results reveal that this divergence in previous results does not only originate from the use of different data or methodologies. The paper provides a new perspective on the nexus of energy
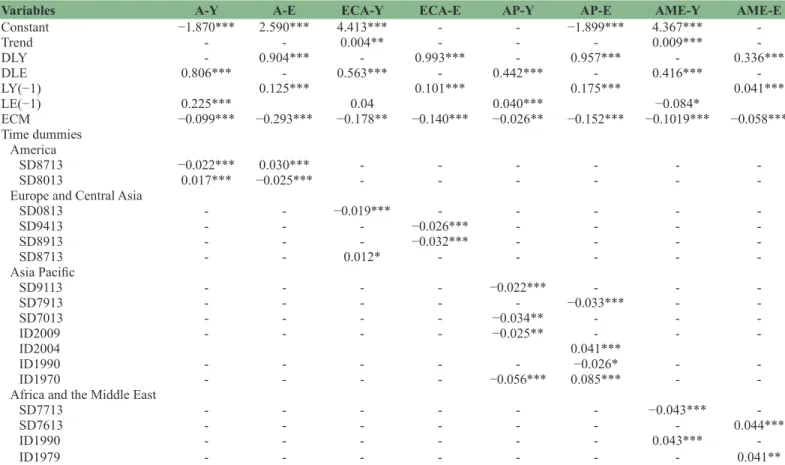
Table 3: ARDL models
Variables A-Y A-E ECA-Y ECA-E AP-Y AP-E AME-Y AME-E
Constant −1.870*** 2.590*** 4.413*** - - −1.899*** 4.367*** -Trend - - 0.004** - - - 0.009*** -DLY - 0.904*** - 0.993*** - 0.957*** - 0.336*** DLE 0.806*** - 0.563*** - 0.442*** - 0.416*** -LY(−1) 0.125*** 0.101*** 0.175*** 0.041*** LE(−1) 0.225*** 0.04 0.040*** −0.084* ECM −0.099*** −0.293*** −0.178** −0.140*** −0.026** −0.152*** −0.1019*** −0.058*** Time dummies America SD8713 −0.022*** 0.030*** - - - -SD8013 0.017*** −0.025*** - - - -Europe and Central Asia
SD0813 - - −0.019*** - - - - -SD9413 - - - −0.026*** - - - -SD8913 - - - −0.032*** - - - -SD8713 - - 0.012* - - - - -Asia Pacific SD9113 - - - - −0.022*** - - -SD7913 - - - −0.033*** - -SD7013 - - - - −0.034** - - -ID2009 - - - - −0.025** - - -ID2004 0.041*** ID1990 - - - −0.026* - -ID1970 - - - - −0.056*** 0.085*** - -Africa and the Middle East
SD7713 - - - −0.043***
-SD7613 - - - 0.044***
ID1990 - - - 0.043***
-ID1979 - - - 0.041**
***,** and * denote statistical significance at 1%, 5% and 10% level, respectively. ECM: Error correction model, ARDL: Autoregressive distributed lag
Table 4: Diagnostic tests
Tests A-Y A-E ECA-Y ECA-E AP-Y AP-E AME-Y AME-E
ARS 0.763 0.819 0.745 0.795 0.684 0.757 0.720 0.557 SER 0.010 0.010 0.010 0.012 0.010 0.014 0.015 0.016 JB 0.184 0.398 0.754 1.886 2.591 3.975 1.026 0.056 LM 0.350 3.993 1.871 0.041 2.641* 0.891 0.320 0.671 ARCH 0.224 0.084 0.662 1.154 0.248 0.152 0.413 0.770 RESET 1.213 0.041 1.047 1.549 0.027 0.034 0.787 0.412
Diagnostic tests results are based on F-statistic. ARS: Adjusted R-squared, SER: Standard error of regression, JB: Jarque–Bera normality test, LM: Breusch-Godfrey serial correlation Lagrange multiplier test, ARCH: Autoregressive conditional heteroskedasticity test, Reset: Ramsey RESET test, A: America, ECA: Europe and Central Asia, AP: Asia Pacific, AME: Africa and the Middle East
Table 5: Bounds test
Statistic A-Y A-E ECA-Y ECA-E AP-Y AP-E AME-Y AME-E
F-statistic 8.567*** 19.365*** 2.563 6.664*** 11.402*** 7.406** 15.025*** 25.824***
k=1, Where k represents the number of independent variables in equation estimated. Critical values for no intercept and no trend - for bottom and for top are, respectively, 4.81 and 6.02, for 1%; 3.15 and 4.11, for 5% and 2.44 and 3.28 for 10%. Critical values for unrestricted intercept and no trend for bottom and for top are, respectively, 6.84 and 7.84, for 1%; 4.94 and 5.73, for 5% and 4.04 and 4.78 for 10%. Critical values for unrestricted intercept and restricted trend for bottom and for top are, respectively, 6.1 and 6.73, for 1%; 4.68 and 5.15, for 5% and 4.05 and 4.49, for 10%. *** and ** denote statistical significance at 1%, 5% level, respectively. A: America, ECA: Europe and Central Asia, AP: Asia Pacific, AME: Africa and the Middle East
Table 6: Short-run semi-elasticities and long-run elasticities
Elasticities A-Y A-E ECA-Y ECA-E AP-Y AP-E AME-Y AME-E
Short-run 0.806*** 0.904*** 0.563*** 0.993*** 0.442*** 0.957*** 0.416*** 0.336*** Long-run 2.259*** 0.427*** 0.227*** 0.983*** 1.504*** 1.156*** −0.834* 0.712***
consumption and economic growth in four world regions, by highlighting both the short- and long-run effects.
The use of four regions reveals how historical events have impacted the different regions (Figure 1). The heterogeneity of the impact on each regional aggregate is evident. It should be noted that none of the historical oil shocks needed to be controlled for Europe or Central Asia, which is consistent with the presence of unidirectional causality between economic growth and energy consumption. In the aggregates of Asia Pacific, and of Africa and the Middle East, the nexus appears to be more susceptible to disturbances. For Africa and the Middle East, the shift dummies indicate specific behavior in which, after 1976, energy consumption grew rapidly and economic growth decelerated. In short, the results support the argument that periods of crisis have different impacts on each regional aggregate and therefore require different policy approaches.
In the short-run, bi-directional causality between energy consumption and economic growth was generally found. However, heterogenous results were found in the long-run. A long-run bi-directional causality between energy and growth was found for America and Asia Pacific. The presence of cointegration and statistically significant long-run elasticities revealed the robustness of the results. Both America and Asia Pacific revealed a strong energy dependence, given that their elasticities are superior to 1. For this reason, restrictions on energy consumption should be strongly discouraged, particularly in the case of America, which demonstrates a high elasticity. Furthermore, such impacts could persist for years, because a reduction in energy consumption will
probably cause a deceleration in economic growth and thus lead to a further reduction in energy consumption, given that the results indicate the existence of endogeneity. For these cases, the results suggest that reductions in energy consumption should be made by improving energy efficiency.
For Europe, Central Asia, and Africa and the Middle East, the direction of causality was found to be from economic growth to energy consumption. These results suggest that growth in Europe and Central Asia may lead to an inefficient increase in energy consumption. Recently, Saidi and Hammami (2015) found that increased GDP causes increased energy consumption globally in Europe, Asia, Latin America, the Caribbean, the Middle East, North Africa and the Sub-Sahara region for a sample of 58 countries. These results are consistent with those found in this paper. In addition, this paper goes further by considering the entire world and testing the hypothesis of energy consumption causing economic growth. It should be noted that despite no causality from energy consumption to economic growth being found, the long-run elasticities show that energy consumption will most likely lead to economic growth.
In the case of Africa and the Middle East, the results also reveal that, not only does energy consumption not cause economic growth, but that any increase in energy consumption tends to reduce economic growth. This seems to be a case where an excess of energy resources becomes a “curse” that constrains economic growth. This is consistent with the effects observed after 1976, when energy consumption accelerated and economic growth decelerated. These results are consistent with Fuinhas et al. (2015)
who found the “curse hypothesis” for a panel of oil producers. These are poorly diversified economies. For instance, according to the World Bank, 97% of Angolan exports come from oil accounts. Nowadays, low oil prices, civil wars and even high fiscal spending in some African and Middle Eastern countries have contributed to a slowdown of growth. Promoting diversification may help to change the energy-growth nexus in this region.
In short, the results indicate that the impact of historical periods of crisis are fairly heterogenous across the globe. The paper is thus of interest to those devising integrated energy policies. The results show that a future path of integrated energy policies can be followed with some limitations, in particular avoiding those that involve restrictive energy consumption policies, as stated above. In fact, the results support the need to develop joint energy policies for America and Asia Pacific, where similar nexus were found. Moreover, the possibility of Europe and Central Asia sharing joint policies should be considered. For Africa and the Middle East, the creation of specific energy policies is recommended. Lastly, a concern regarding global energy inefficiency arises due to the causality of economic growth on energy consumption. There is a need to increase efficiency in energy consumption thus preventing inefficient development caused by growth in energy consumption due to non-productive activities.
6. CONCLUSIONS
Using the ARDL bounds test approach with annual time series data from 1968 to 2014, the world energy-growth nexus was analyzed by dividing the world into four regions: America; Europe and Central Asia; Asia Pacific; and Africa and the Middle East. The paper provides a comparison of the results for each region using an identical methodology. The heterogeneity of the nexus throughout the world was confirmed, revealing that the use of different methodologies is not the main cause of the heterogenous results in the literature. In fact, the paper makes clear that there are heterogenous results even when the same methodology is applied. In addition, it was observed that historical events, such as the oil shocks, had different impacts on each regional aggregate. Regarding the common linkages previously found in the literature, we observed that in the long-run: (i) The “feedback hypothesis” is present in America and in Africa and the Middle East; and (ii) in Europe and Central Asia and in Africa and the Middle East, the “conservation hypothesis” was found. In the short-run, there is bi-directional causality except for in Africa and the Middle East, where no relationship was found. Additionally, evidence of the “curse hypothesis” was found in Africa and the Middle East. For this reason, the promotion of economic diversification in this regional aggregate is advisable.
These results support the development of joint energy policies, particularly for America and Asia Pacific where restrictive energy policies are not recommended because they are likely to hamper economic growth and their effects may persist for years. Improving energy efficiency is a potential way of overcoming this. In fact, increasing the efficiency of energy consumption should be a global goal to prevent inefficient energy consumption caused by
economic growth. Finally, the potential cooperation of Europe and Central Asia in a joint energy policy should be considered.
7. ACKNOWLEDGMENTS
The financial support of the NECE - Research Unit in Business Science and Economics, sponsored by the FCT - Portuguese Foundation for the Development of Science and Technology, Ministry of Education and Science, project UID/GES/04630/2013, is acknowledged.
REFERENCES
Aali-Bujari, A., Venegas-Martínez, F., Palafox-Roca, A.O. (2017), Impact of energy consumption on economic growth in major organization for economic cooperation and development economies (1977-2014): A panel data approach. International Journal of Energy Economics and Policy, 7(2), 18-25.
Adams, S., Klobodu, E.K.M., Opoku, E.E.O. (2016), Energy consumption, political regime and economic growth in Sub-Saharan Africa. Energy Policy, 96, 36-44.
Akinlo, A.E. (2008), Energy consumption and economic growth: Evidence from 11 Sub-Sahara African countries. Energy Economics, 30(5), 2391-2400.
Al-Iriani, M.A. (2006), Energy-GDP relationship revisited: An example from GCC countries using panel causality. Energy Policy, 34(17), 3342-3350.
Al-Mulali, U., Fereidouni, H.G., Lee, J.Y., Sab, C.N.B. (2013), Examining the bi-directional long run relationship between renewable energy consumption and GDP growth. Renewable and Sustainable Energy Reviews, 22, 209-222.
Borozan, D. (2013), Exploring the relationship between energy consumption and GDP: Evidence from Croatia. Energy Policy, 59, 373-381.
Bouoiyour, J., Selmi, R., Ozturk, I. (2014), The nexus between electricity consumption and economic growth: New insights from meta-analysis. International Journal of Energy Economics and Policy, 4(4), 621-635.
Caraiani, C., Lungu, C.I., Dascălu, C. (2015), Energy consumption and GDP causality: A three-step analysis for emerging European countries. Renewable and Sustainable Energy Reviews, 44, 198-210. Cheng, B.S., Lai, T.W. (1997), An investigation of co-integration and
causality between energy consumption and economic activity in Taiwan. Energy Economics, 19(4), 435-444.
Ciarreta, A., Zarraga, A. (2010), Economic growth-electricity consumption causality in 12 European countries: A dynamic panel data approach. Energy Policy, 38(7), 3790-3796.
Damette, O., Seghir, M. (2013), Energy as a driver of growth in oil exporting countries? Energy Economics, 37, 193-199.
Dritsaki, C., Dritsaki, M, (2014), Causal relationship between energy consumption, economic growth and CO2 emissions: A dynamic panel data approach. International Journal of Energy Economics and Policy, 4(2), 125-136.
Eggoh, J.C., Bangake, C., Rault, C. (2011), Energy consumption and economic growth revisited in African countries. Energy Policy, 39(11), 7408-7421.
Esso, J.L. (2010), The energy consumption-growth nexus in seven Sub-Saharan African countries. Economic Bulletin, 30(2), 1191-1209. Fang, Z., Chang, Y. (2016), Energy, human capital and economic growth
in Asia Pacific countries - Evidence from a panel cointegration and causality analysis. Energy Economics, 56, 177-184.
Fuinhas, J.A., Marques, A.C. (2012), Energy consumption and economic growth nexus in Portugal, Italy, Greece, Spain and Turkey: An ARDL bounds test approach (1965-2009). Energy Economics, 34(2), 511-517.
Fuinhas, J.A., Marques, A.C., Couto, A.P. (2015), Oil rents and economic growth in oil producing countries: Evidence from a macro panel. Economic Change and Restructuring, 48(3), 257-279.
Glasure, Y.U., Lee, A.R. (1998), Cointegration, error-correction, and the relationship between GDP and energy: The case of South Korea and Singapore. Resource and Energy Economics, 20(1), 17-25. Granger, C.W.J. (1988), Causality, cointegration, and control. Journal of
Economic Dynamics and Control, 12(2-3), 551-559.
Hamit-Haggar, M. (2016), Clean energy-growth nexus in Sub-Saharan Africa: Evidence from cross-sectionally dependent heterogeneous panel with structural breaks. Renewable and Sustainable Energy Reviews, 57, 1237-1244.
Han, Z.Y., Fan, Y., Wei, Y.M. (2004), Study on the cointegration and causality between GDP and energy consumption in China. International Journal of Global Energy Issues, 22(2), 225-232. Ishida, H. (2012), Causal relationship between fossil fuel consumption
and economic growth in the world. International Journal of Global Energy Issues, 35(6), 427-440.
Jahangir, A.M., Ara, B.I., Buysse, J., Van Huylenbroeck, G. (2012), Energy consumption, carbon emissions and economic growth nexus in Bangladesh: Cointegration and dynamic causality analysis. Energy Policy, 45, 217-225.
Jammazi, R., Aloui, C. (2015), On the interplay between energy consumption, economic growth and CO2 emission nexus in the GCC countries: A comparative analysis through wavelet approaches. Renewable and Sustainable Energy Reviews, 51, 1737-1751. Kasperowicz, R. (2014), Economic growth and energy consumption in 12
European countries: A panel data approach. Journal of International Studies, 7(3), 112-122.
Kraft, J., Kraft, A. (1978), On the relationship between energy and GNP. The Journal of Energy and Development, 3(2), 401-403.
Lee, C.C., Chang, C.P. (2005), Structural breaks, energy consumption, and economic growth revisited: Evidence from Taiwan. Energy Economics, 27(6), 857-872.
Marques, A.C., Fuinhas, J.A., Nunes, A.R. (2016), Electricity generation mix and economic growth: What role is being played by nuclear sources and carbon dioxide emissions in France? Energy Policy, 92, 7-19.
Marques, L.M., Fuinhas, J.A., Marques, A.C. (2015), On the global energy consumption and economic growth nexus: A long time span analysis. International Energy Journal, 15(4), 143-150.
Masih, A.M.M., Masih, R. (1996), Energy consumption, real income and temporal causality: Results from a multi-country study based on cointegration and error-correction modelling techniques. Energy Economics, 18(3), 165-183.
Mohammadi, H., Amin, M.D. (2015), Long-run relation and short-run dynamics in energy consumption-output relationship: International evidence from country panels with different growth rates. Energy Economics Part A, 52, 118-126.
Mohammadi, H., Parvaresh, S. (2014), Energy consumption and output: Evidence from a panel of 14 oil-exporting countries. Energy Economics, 41(0), 41-46.
Narayan, S. (2016), Predictability within the energy consumption-economic growth nexus: Some evidence from income and regional groups. Economic Modelling, 54, 515-521.
Nasreen, S., Anwar, S. (2014), Causal relationship between trade openness, economic growth and energy consumption: A panel data analysis of Asian countries. Energy Policy, 69, 82-91.
Ocal, O., Aslan, A. (2013), Renewable energy consumption-economic growth nexus in Turkey. Renewable and Sustainable Energy Reviews, 28, 494-499.
Oh, W., Lee, K. (2004), Causal relationship between energy consumption and GDP revisited: The case of Korea 1970-1999. Energy Economics, 26(1), 51-59.
Omri, A. (2013), CO2 emissions, energy consumption and economic growth nexus in MENA countries: Evidence from simultaneous equations models. Energy Economics, 40, 657-664.
Ozcan, B. (2013), The nexus between carbon emissions, energy consumption and economic growth in middle East countries: A panel data analysis. Energy Policy, 62, 1138-1147.
Ozturk, I. (2010), A literature survey on energy-growth nexus. Energy Policy, 38(1), 340-349.
Ozturk, I., Acaravci, A. (2011), Electricity consumption and real GDP causality nexus: Evidence from ARDL bounds testing approach for 11 MENA countries. Applied Energy, 88(8), 2885-2892.
Ozturk, I., Aslan, A., Kalyoncu, H. (2010), Energy consumption and economic growth relationship: Evidence from panel data for low and middle income countries. Energy Policy, 38(8), 4422-4428. Pala, A. (2016), Which energy-growth hypothesis is valid in OECD
countries? Evidence from panel Granger causality. International Journal of Energy Economics and Policy, 6(1), 28-34.
Pao, H.T., Fu, H.C. (2013), Renewable energy, non-renewable energy and economic growth in Brazil. Renewable and Sustainable Energy Reviews, 25, 381-392.
Perron, P. (1989), The great crash, the oil price shock, and the unit root hypothesis. Econometrica, 57(6), 1361-1401.
Pesaran, M.H., Shin, Y. (1999), An autoregressive distributed lag modelling approach to cointegration analysis. In: Strom, S., Strom, S., editors. Econometrics and Economic Theory in the 20th Century. Cambridge: Cambridge University Press. p371-413.
Pesaran, M.H., Shin, Y., Smith, R.J. (2001), Bounds testing approaches to the analysis of level relationships. Journal of Applied Econometrics, 16(3), 289-326.
Rezitis, A.N., Ahammad, S.M. (2015), The relationship between energy consumption and economic growth in South and Southeast Asian countries: A panel vector autoregression approach and causality analysis. International Journal of Energy Economics and Policy, 5(3), 704-715.
Sadorsky, P. (2011), Trade and energy consumption in the middle East. Energy Economics, 33(5), 739-749.
Sadorsky, P. (2012), Energy consumption, output and trade in South America. Energy Economics, 34(2), 476-488.
Saidi, K., Hammami, S. (2015), The impact of CO2 emissions and economic growth on energy consumption in 58 countries. Energy Reports, 1, 62-70.
Sims, C.A. (1972), Money, income, and causality. American Economic Review, 62(4), 540-552.
Śmiech, S., Papież, M. (2014), Energy consumption and economic growth in the light of meeting the targets of energy policy in the EU: The bootstrap panel Granger causality approach. Energy Policy, 71, 118-129.
Stern, D.I. (2000), A multivariate cointegration analysis of the role of energy in the US macroeconomy. Energy Economics, 22(2), 267-283. Yıldırım, E., Sukruoglu, D., Aslan, A. (2014), Energy consumption
and economic growth in the next 11 countries: The bootstrapped autoregressive metric causality approach. Energy Economics, 44, 14-21.
Yu, E.S.H., Hwang, B.K. (1984), The relationship between energy and GNP: Further results. Energy Economics, 6(3), 186-190.