Edited by: Richard Eleftherios Boyatzis, Case Western Reserve University, United States Reviewed by: Leandro S. Almeida, University of Minho, Portugal Celestino Rodríguez, Universidad de Oviedo Mieres, Spain David Álvarez-García, Universidad de Oviedo Mieres, Spain *Correspondence: João Marôco [email protected] Specialty section: This article was submitted to Organizational Psychology, a section of the journal Frontiers in Psychology Received:23 February 2018 Accepted:02 March 2018 Published:20 March 2018 Citation: Sinval J, Pasian S, Queirós C and Marôco J (2018) Brazil-Portugal Transcultural Adaptation of the UWES-9: Internal Consistency, Dimensionality, and Measurement Invariance. Front. Psychol. 9:353. doi: 10.3389/fpsyg.2018.00353
Brazil-Portugal Transcultural
Adaptation of the UWES-9: Internal
Consistency, Dimensionality, and
Measurement Invariance
Jorge Sinval1,2, Sonia Pasian1, Cristina Queirós2and João Marôco3*
1Faculty of Philosophy, Sciences and Letters of Ribeirão Preto, University of São Paulo, São Paulo, Brazil,2Faculty of Psychology and Education Sciences, University of Porto, Porto, Portugal,3William James Centre for Research, ISPA-Instituto Universitário, Lisboa, Portugal
The aim of this paper is to present a revision of international versions of the Utrecht Work Engagement Scale and to describe the psychometric properties of a Portuguese version of the UWES-9 developed simultaneously for Brazil and Portugal, the validity evidence related with the internal structure, namely, Dimensionality, measurement invariance between Brazil and Portugal, and Reliability of the scores. This is the first UWES version developed simultaneously for both countries, and it is an important instrument for understanding employees’ work engagement in the organizations, allowing human resources departments to better use workforces, especially when they are migrants. A total of 524 Brazilian workers and 522 Portuguese workers participated in the study. Confirmatory Factor Analysis, group comparisons, and Reliability estimates were used. The use of workers who were primarily professionals or administrative support, according to ISCO-08, reinforced the need to collect data on other professional occupations. Confirmatory factor analysis showed acceptable fit for the UWES-9 original three-factor solution, and a second-order factor structure has been proposed that presented an acceptable fit. Full-scale invariance was obtained between the Portuguese and Brazilian samples, both for the original three-factor first-order and second-order models. Data revealed that Portuguese and Brazilian workers didn’t show statistically significant differences in the work engagement dimensions. This version allows for direct comparisons of means and, consequently, for performance of comparative and cross-cultural studies between these two countries.
Keywords: work engagement, Portuguese-Brazilian version, measurement invariance, reliability of the scores, validity evidence, psychometric properties
INTRODUCTION
The global economic crisis elicited important changes in the workforce (The Organisation for
Economic Co-operation and Development; Pilati et al., 2015; OECD, 2016), namely workers
changing their physical location in order to have a better salary or even a job. International enterprises also frequently changed their physical location to decrease taxes, for political reasons or to achieve lower labor costs. Moreover, workers’ career expectations increased occupational
workers (Dollard et al., 2014). Due to the commonalities in language and cultural values, Brazilians are the majority of
foreign workers in Portugal, and vice-versa (INE, 2014). In
2014, Portuguese workers represented 1% of European labor
inflows while Brazilians represented 1.1% (OECD, 2016). The
Brazilian migrants dominate the inflow entries to Portugal at 21% (Serviço de Estrangeiros e Fronteiras, 2016). Reciprocal migrant flows created new challenges to enterprises’ functioning and in research about occupational health, cross-cultural studies and
bias in personality assessment (van de Vijver, 2000; Hofstede
et al., 2010). Moreover, Occupational Health departments are continuously alert for the psychosocial risks at work and workers’ well-being, referring to positive mental health as a promoter
of active and healthy aging (Direção-Geral da saúde, 2013;
European Agency for Safety Health at Work, 2016).
Simultaneously, psychology reinforces the need to research new challenges instead of negative topics and to valorize
well-being at work (Scorsolini-Comin et al., 2013; van Veldhoven and
Peccei, 2015; Mäkikangas et al., 2016) or positive states such as
engagement within Positive Occupational Psychology (Bakker
et al., 2008, 2012; Byrne, 2014; Truss et al., 2014; Chambel, 2016; Salanova et al., 2016). Since engaged workers seem to be more energetic, enthusiastic regarding their work and have greater
initiative, innovativeness and well-being (Alfes et al., 2013; Shuck
et al., 2014; Bal and De Lange, 2015; de Camargo et al., 2015; Sattar et al., 2015; Graffigna, 2017; Presbitero, 2017), it is well documented that regarding human resources, work engagement plays a mediating role between organizations’ human resources management practices and workers’ job satisfaction, performance outcomes, team cohesion, reduced turnover or reduced job stress. Work engagement can be defined as a positive motivational construct characterized by vigor, dedication, and absorption and, within workplaces’ psychology, it is generally seen as
a protector against burnout (Schaufeli and Salanova, 2007;
Schaufeli and Bakker, 2010). Vigor refers to high levels of persistence, energy, and mental resilience while working, and the willingness to invest effort in one’s work. Dedication is characterized by being strongly involved in one’s work and experiencing a sense of meaning, enthusiasm, inspiration, and pride. Finally, absorption refers to being completely concentrated and happily immersed in one’s work, with distortion of time
and intrinsic enjoyment (Schaufeli et al., 2002b). Globally,
work engagement is referred to a cognitive-affective persistent state in time, which is not focused on an object or a specific
behavior (Salanova et al., 2000; Schaufeli, 2017). It is related to
performance (Pittenger, 2015; Knight et al., 2017; Reijseger et al.,
2017) and to economy, governance, and culture (Schaufeli, 2017).
A recent report presented bySchaufeli (2017)analyses data from
43,850 employees from thirty-five European countries, from the “6th European Working Conditions Survey–2015,” aiming to identify the relationships between work engagement at the country level and several national economic, governance and cultural indicators. The author concludes that the most engaged countries are in Northwestern Europe, whereas the least engaged are located in Southern Europe or the Balkans, with Portugal being under the European average (3.69 vs. 3.94 on a 1–5 scale).
The most disseminated instrument to measure work engagement is the Utrecht Work Engagement Scale—UWES (Mäkikangas et al., 2016; Knight et al., 2017), created bySchaufeli and Bakker (2003). Its properties need to be investigated, to use it with more rigor. This paper aims to present a revision of international versions of the Utrecht Work Engagement Scale and to describe psychometric properties of a Portuguese version of the UWES-9 developed simultaneously for Brazil and Portugal. The UWES has a version with 17 items, distributed among three dimensions as follows: vigor (6 items), dedication (5 items), and absorption (6 items). Despite a very recent and
ultra-short measure of work engagement with 3 items (Schaufeli
et al., 2017), a short version is frequently used having 9 items (UWES-9), 3 for each dimension, and is recommended by
some authors over the longer version (Nerstad et al., 2010;
Hernandez-Vargas et al., 2016), in order to improve data quality, with advantages such as the potential decrease of missing values, the shorter amount of time to complete the questionnaire, and the increased likelihood of completing
the questionnaire (Kruyen et al., 2013). This short version
produced data with good psychometric properties when it
was developed in the original sample (Schaufeli et al., 2006),
but also in other recent independent studies (de Bruin and
Henn, 2013; Littman-Ovadia and Balducci, 2013; Panthee et al., 2014; Fong and Ho, 2015; Vazquez et al., 2015). The internal consistency (Cronbach’s Alpha) usually shows acceptable values (Fong and Ng, 2012) and, although is common to find high inter-factor correlations between the three dimensions, the factorial invariance of the UWES across countries has been
demonstrated in student samples (Schaufeli et al., 2002a).
Balducci et al. (2010) used a sample of Italian and Dutch workers, where they applied each country’s version, instead of the same transcultural version, due to language specificities. Also in Greek and Dutch employees, measurement invariance
was obtained using each national language (Xanthopoulou
et al., 2012). Schaufeli et al. (2006) selected items through an iterative process from the original scale to rebuild the UWES-9 and obtained a version with good psychometric proprieties, namely Cronbach’s α higher than 0.80 and a three-factor solution that fit the data better than a one-factor solution.
Being a recent and positive occupational measure, and due to its ease of use, the UWES has been translated into many languages (Schaufeli and Bakker, 2010), such as Serbian (Petrovi´c et al.,
2017), Spanish (Schaufeli et al., 2002a; Hernandez-Vargas et al.,
2016), Hebrew (Littman-Ovadia and Balducci, 2013), Chinese
(Fong and Ng, 2012), Norwegian (Nerstad et al., 2010), Italian (Balducci et al., 2010), Japanese (Shimazu et al., 2008), and
Portuguese (Schaufeli and Bakker, 2003; Vazquez et al., 2015),
showing the robustness and relevance of the three-dimensional construct of work engagement among different cultures. Despite
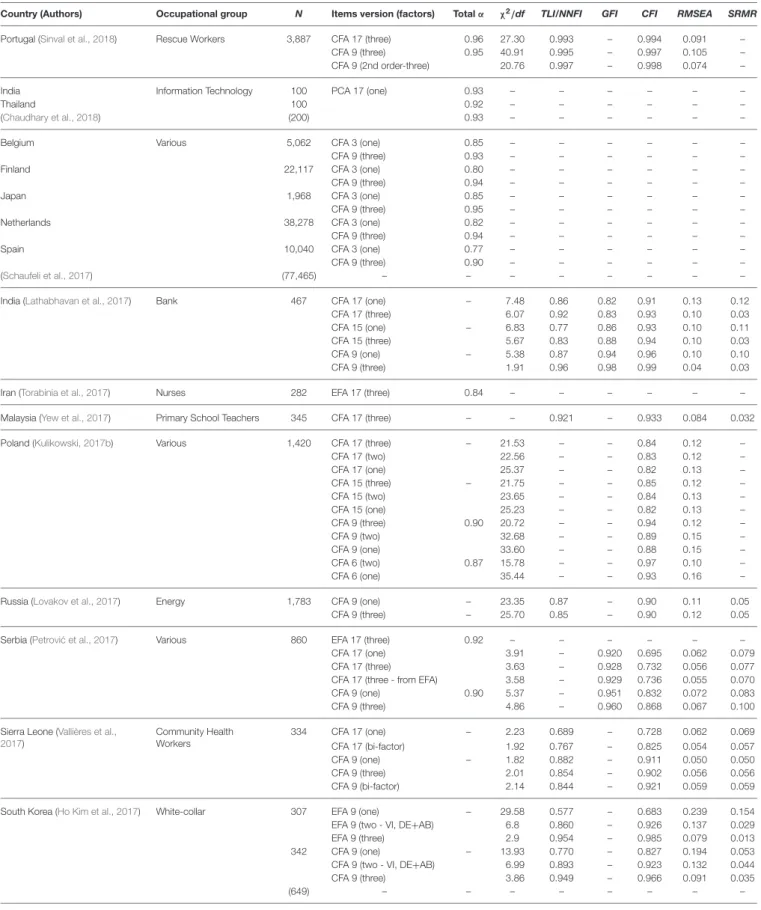
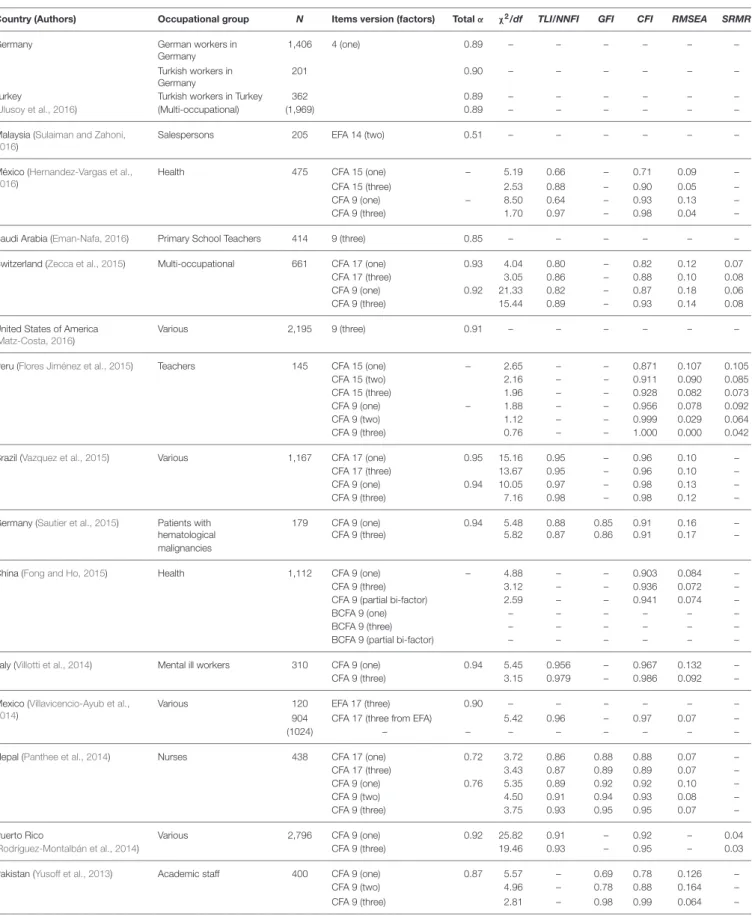
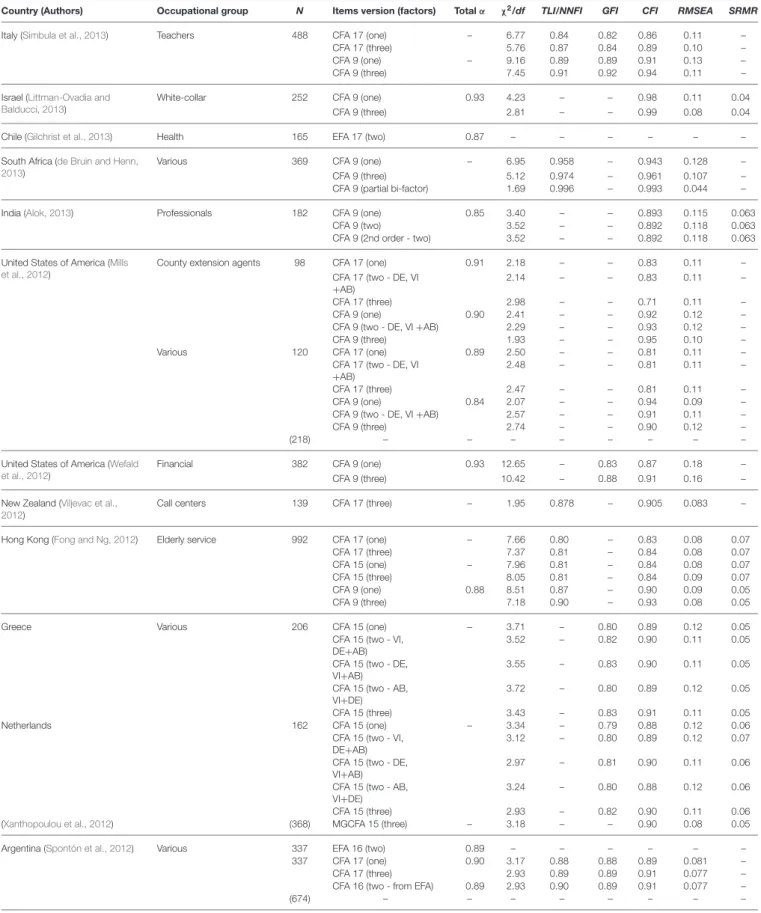
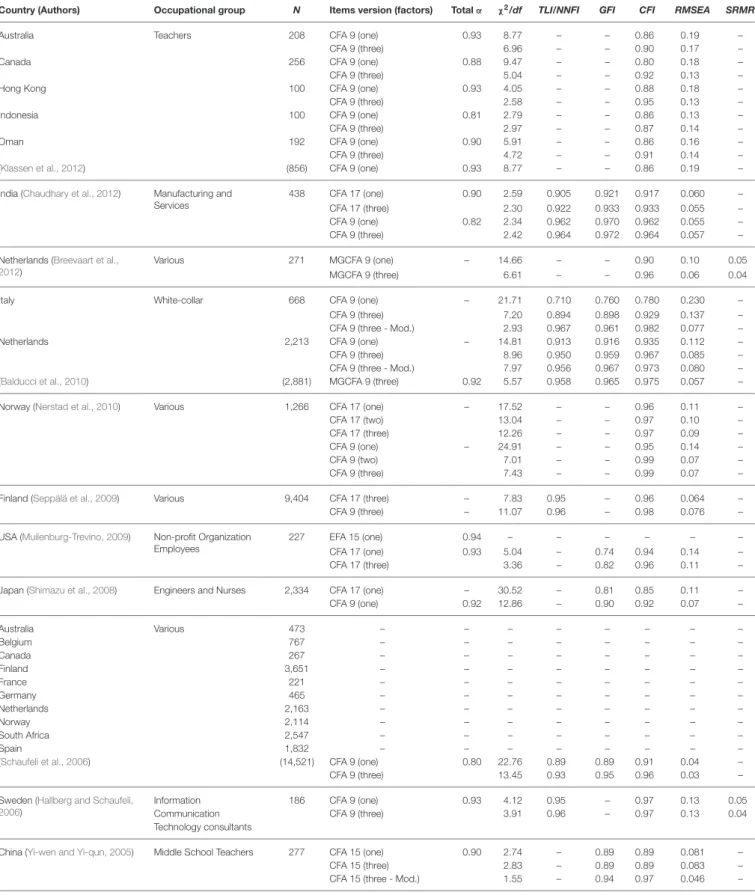
the recent literature review of Kulikowski (2017a), in Table 1
we present a revision of some adapted versions based on the UWES-17 version or on reduced versions, using as criteria the UWES’ application to workers in different countries, as well psychometric properties, considering not only confirmatory analysis referred by Kulikowski but also Exploratory Factor
TABLE 1 | UWES versions and its Goodness-of-fit details.
Country (Authors) Occupational group N Items version (factors) Total α χ2/df TLI/NNFI GFI CFI RMSEA SRMR Portugal (Sinval et al., 2018) Rescue Workers 3,887 CFA 17 (three) 0.96 27.30 0.993 – 0.994 0.091 –
CFA 9 (three) 0.95 40.91 0.995 – 0.997 0.105 – CFA 9 (2nd order-three) 20.76 0.997 – 0.998 0.074 – India Information Technology 100 PCA 17 (one) 0.93 – – – – – –
Thailand 100 0.92 – – – – – –
(Chaudhary et al., 2018) (200) 0.93 – – – – – –
Belgium Various 5,062 CFA 3 (one) 0.85 – – – – – – CFA 9 (three) 0.93 – – – – – – Finland 22,117 CFA 3 (one) 0.80 – – – – – – CFA 9 (three) 0.94 – – – – – – Japan 1,968 CFA 3 (one) 0.85 – – – – – – CFA 9 (three) 0.95 – – – – – – Netherlands 38,278 CFA 3 (one) 0.82 – – – – – – CFA 9 (three) 0.94 – – – – – – Spain 10,040 CFA 3 (one) 0.77 – – – – – – CFA 9 (three) 0.90 – – – – – –
(Schaufeli et al., 2017) (77,465) – – – – – – – –
India (Lathabhavan et al., 2017) Bank 467 CFA 17 (one) – 7.48 0.86 0.82 0.91 0.13 0.12 CFA 17 (three) 6.07 0.92 0.83 0.93 0.10 0.03 CFA 15 (one) – 6.83 0.77 0.86 0.93 0.10 0.11 CFA 15 (three) 5.67 0.83 0.88 0.94 0.10 0.03 CFA 9 (one) – 5.38 0.87 0.94 0.96 0.10 0.10 CFA 9 (three) 1.91 0.96 0.98 0.99 0.04 0.03 Iran (Torabinia et al., 2017) Nurses 282 EFA 17 (three) 0.84 – – – – – – Malaysia (Yew et al., 2017) Primary School Teachers 345 CFA 17 (three) – – 0.921 – 0.933 0.084 0.032 Poland (Kulikowski, 2017b) Various 1,420 CFA 17 (three) – 21.53 – – 0.84 0.12 –
CFA 17 (two) 22.56 – – 0.83 0.12 – CFA 17 (one) 25.37 – – 0.82 0.13 – CFA 15 (three) – 21.75 – – 0.85 0.12 – CFA 15 (two) 23.65 – – 0.84 0.13 – CFA 15 (one) 25.23 – – 0.82 0.13 – CFA 9 (three) 0.90 20.72 – – 0.94 0.12 – CFA 9 (two) 32.68 – – 0.89 0.15 – CFA 9 (one) 33.60 – – 0.88 0.15 – CFA 6 (two) 0.87 15.78 – – 0.97 0.10 – CFA 6 (one) 35.44 – – 0.93 0.16 – Russia (Lovakov et al., 2017) Energy 1,783 CFA 9 (one) – 23.35 0.87 – 0.90 0.11 0.05
CFA 9 (three) – 25.70 0.85 – 0.90 0.12 0.05 Serbia (Petrovi ´c et al., 2017) Various 860 EFA 17 (three) 0.92 – – – – – –
CFA 17 (one) 3.91 – 0.920 0.695 0.062 0.079 CFA 17 (three) 3.63 – 0.928 0.732 0.056 0.077 CFA 17 (three - from EFA) 3.58 – 0.929 0.736 0.055 0.070 CFA 9 (one) 0.90 5.37 – 0.951 0.832 0.072 0.083 CFA 9 (three) 4.86 – 0.960 0.868 0.067 0.100 Sierra Leone (Vallières et al.,
2017) Community Health Workers 334 CFA 17 (one) – 2.23 0.689 – 0.728 0.062 0.069 CFA 17 (bi-factor) 1.92 0.767 – 0.825 0.054 0.057 CFA 9 (one) – 1.82 0.882 – 0.911 0.050 0.050 CFA 9 (three) 2.01 0.854 – 0.902 0.056 0.056 CFA 9 (bi-factor) 2.14 0.844 – 0.921 0.059 0.059 South Korea (Ho Kim et al., 2017) White-collar 307 EFA 9 (one) – 29.58 0.577 – 0.683 0.239 0.154 EFA 9 (two - VI, DE+AB) 6.8 0.860 – 0.926 0.137 0.029 EFA 9 (three) 2.9 0.954 – 0.985 0.079 0.013 342 CFA 9 (one) – 13.93 0.770 – 0.827 0.194 0.053 CFA 9 (two - VI, DE+AB) 6.99 0.893 – 0.923 0.132 0.044 CFA 9 (three) 3.86 0.949 – 0.966 0.091 0.035 (649) – – – – – – – –
TABLE 1 | Continued
Country (Authors) Occupational group N Items version (factors) Total α χ2/df TLI/NNFI GFI CFI RMSEA SRMR Germany German workers in
Germany
1,406 4 (one) 0.89 – – – – – – Turkish workers in
Germany
201 0.90 – – – – – – Turkey Turkish workers in Turkey 362 0.89 – – – – – –
(Ulusoy et al., 2016) (Multi-occupational) (1,969) 0.89 – – – – – –
Malaysia (Sulaiman and Zahoni, 2016)
Salespersons 205 EFA 14 (two) 0.51 – – – – – – México (Hernandez-Vargas et al.,
2016)
Health 475 CFA 15 (one) – 5.19 0.66 – 0.71 0.09 – CFA 15 (three) 2.53 0.88 – 0.90 0.05 – CFA 9 (one) – 8.50 0.64 – 0.93 0.13 – CFA 9 (three) 1.70 0.97 – 0.98 0.04 – Saudi Arabia (Eman-Nafa, 2016) Primary School Teachers 414 9 (three) 0.85 – – – – – – Switzerland (Zecca et al., 2015) Multi-occupational 661 CFA 17 (one) 0.93 4.04 0.80 – 0.82 0.12 0.07
CFA 17 (three) 3.05 0.86 – 0.88 0.10 0.08 CFA 9 (one) 0.92 21.33 0.82 – 0.87 0.18 0.06 CFA 9 (three) 15.44 0.89 – 0.93 0.14 0.08 United States of America
(Matz-Costa, 2016) Various 2,195 9 (three) 0.91 – – – – – –
Peru (Flores Jiménez et al., 2015) Teachers 145 CFA 15 (one) – 2.65 – – 0.871 0.107 0.105 CFA 15 (two) 2.16 – – 0.911 0.090 0.085 CFA 15 (three) 1.96 – – 0.928 0.082 0.073 CFA 9 (one) – 1.88 – – 0.956 0.078 0.092 CFA 9 (two) 1.12 – – 0.999 0.029 0.064 CFA 9 (three) 0.76 – – 1.000 0.000 0.042 Brazil (Vazquez et al., 2015) Various 1,167 CFA 17 (one) 0.95 15.16 0.95 – 0.96 0.10 –
CFA 17 (three) 13.67 0.95 – 0.96 0.10 – CFA 9 (one) 0.94 10.05 0.97 – 0.98 0.13 – CFA 9 (three) 7.16 0.98 – 0.98 0.12 – Germany (Sautier et al., 2015) Patients with 179 CFA 9 (one) 0.94 5.48 0.88 0.85 0.91 0.16 – hematological CFA 9 (three) 5.82 0.87 0.86 0.91 0.17 – malignancies
China (Fong and Ho, 2015) Health 1,112 CFA 9 (one) – 4.88 – – 0.903 0.084 – CFA 9 (three) 3.12 – – 0.936 0.072 – CFA 9 (partial bi-factor) 2.59 – – 0.941 0.074 – BCFA 9 (one) – – – – – – BCFA 9 (three) – – – – – – BCFA 9 (partial bi-factor) – – – – – – Italy (Villotti et al., 2014) Mental ill workers 310 CFA 9 (one) 0.94 5.45 0.956 – 0.967 0.132 – CFA 9 (three) 3.15 0.979 – 0.986 0.092 – Mexico (Villavicencio-Ayub et al.,
2014)
Various 120 EFA 17 (three) 0.90 – – – – – – 904 CFA 17 (three from EFA) 5.42 0.96 – 0.97 0.07 – (1024) – – – – – – – – Nepal (Panthee et al., 2014) Nurses 438 CFA 17 (one) 0.72 3.72 0.86 0.88 0.88 0.07 – CFA 17 (three) 3.43 0.87 0.89 0.89 0.07 – CFA 9 (one) 0.76 5.35 0.89 0.92 0.92 0.10 – CFA 9 (two) 4.50 0.91 0.94 0.93 0.08 – CFA 9 (three) 3.75 0.93 0.95 0.95 0.07 – Puerto Rico Various 2,796 CFA 9 (one) 0.92 25.82 0.91 – 0.92 – 0.04
(Rodríguez-Montalbán et al., 2014) CFA 9 (three) 19.46 0.93 – 0.95 – 0.03
Pakistan (Yusoff et al., 2013) Academic staff 400 CFA 9 (one) 0.87 5.57 – 0.69 0.78 0.126 – CFA 9 (two) 4.96 – 0.78 0.88 0.164 – CFA 9 (three) 2.81 – 0.98 0.99 0.064 – (Continued)
TABLE 1 | Continued
Country (Authors) Occupational group N Items version (factors) Total α χ2/df TLI/NNFI GFI CFI RMSEA SRMR Italy (Simbula et al., 2013) Teachers 488 CFA 17 (one) – 6.77 0.84 0.82 0.86 0.11 –
CFA 17 (three) 5.76 0.87 0.84 0.89 0.10 – CFA 9 (one) – 9.16 0.89 0.89 0.91 0.13 – CFA 9 (three) 7.45 0.91 0.92 0.94 0.11 – Israel (Littman-Ovadia and
Balducci, 2013)
White-collar 252 CFA 9 (one) 0.93 4.23 – – 0.98 0.11 0.04 CFA 9 (three) 2.81 – – 0.99 0.08 0.04 Chile (Gilchrist et al., 2013) Health 165 EFA 17 (two) 0.87 – – – – – – South Africa (de Bruin and Henn,
2013)
Various 369 CFA 9 (one) – 6.95 0.958 – 0.943 0.128 – CFA 9 (three) 5.12 0.974 – 0.961 0.107 – CFA 9 (partial bi-factor) 1.69 0.996 – 0.993 0.044 – India (Alok, 2013) Professionals 182 CFA 9 (one) 0.85 3.40 – – 0.893 0.115 0.063
CFA 9 (two) 3.52 – – 0.892 0.118 0.063 CFA 9 (2nd order - two) 3.52 – – 0.892 0.118 0.063 United States of America (Mills
et al., 2012)
County extension agents 98 CFA 17 (one) 0.91 2.18 – – 0.83 0.11 – CFA 17 (two - DE, VI
+AB)
2.14 – – 0.83 0.11 – CFA 17 (three) 2.98 – – 0.71 0.11 – CFA 9 (one) 0.90 2.41 – – 0.92 0.12 – CFA 9 (two - DE, VI +AB) 2.29 – – 0.93 0.12 – CFA 9 (three) 1.93 – – 0.95 0.10 – Various 120 CFA 17 (one) 0.89 2.50 – – 0.81 0.11 –
CFA 17 (two - DE, VI +AB)
2.48 – – 0.81 0.11 – CFA 17 (three) 2.47 – – 0.81 0.11 – CFA 9 (one) 0.84 2.07 – – 0.94 0.09 – CFA 9 (two - DE, VI +AB) 2.57 – – 0.91 0.11 – CFA 9 (three) 2.74 – – 0.90 0.12 – (218) – – – – – – – – United States of America (Wefald
et al., 2012)
Financial 382 CFA 9 (one) 0.93 12.65 – 0.83 0.87 0.18 – CFA 9 (three) 10.42 – 0.88 0.91 0.16 – New Zealand (Viljevac et al.,
2012)
Call centers 139 CFA 17 (three) – 1.95 0.878 – 0.905 0.083 – Hong Kong (Fong and Ng, 2012) Elderly service 992 CFA 17 (one) – 7.66 0.80 – 0.83 0.08 0.07
CFA 17 (three) 7.37 0.81 – 0.84 0.08 0.07 CFA 15 (one) – 7.96 0.81 – 0.84 0.08 0.07 CFA 15 (three) 8.05 0.81 – 0.84 0.09 0.07 CFA 9 (one) 0.88 8.51 0.87 – 0.90 0.09 0.05 CFA 9 (three) 7.18 0.90 – 0.93 0.08 0.05 Greece Various 206 CFA 15 (one) – 3.71 – 0.80 0.89 0.12 0.05
CFA 15 (two - VI, DE+AB)
3.52 – 0.82 0.90 0.11 0.05 CFA 15 (two - DE,
VI+AB)
3.55 – 0.83 0.90 0.11 0.05 CFA 15 (two - AB,
VI+DE)
3.72 – 0.80 0.89 0.12 0.05 CFA 15 (three) 3.43 – 0.83 0.91 0.11 0.05 Netherlands 162 CFA 15 (one) – 3.34 – 0.79 0.88 0.12 0.06
CFA 15 (two - VI, DE+AB)
3.12 – 0.80 0.89 0.12 0.07 CFA 15 (two - DE,
VI+AB)
2.97 – 0.81 0.90 0.11 0.06 CFA 15 (two - AB,
VI+DE)
3.24 – 0.80 0.88 0.12 0.06 CFA 15 (three) 2.93 – 0.82 0.90 0.11 0.06
(Xanthopoulou et al., 2012) (368) MGCFA 15 (three) – 3.18 – – 0.90 0.08 0.05
Argentina (Spontón et al., 2012) Various 337 EFA 16 (two) 0.89 – – – – – – 337 CFA 17 (one) 0.90 3.17 0.88 0.88 0.89 0.081 – CFA 17 (three) 2.93 0.89 0.89 0.91 0.077 – CFA 16 (two - from EFA) 0.89 2.93 0.90 0.89 0.91 0.077 – (674) – – – – – – – – (Continued)
TABLE 1 | Continued
Country (Authors) Occupational group N Items version (factors) Total α χ2/df TLI/NNFI GFI CFI RMSEA SRMR Australia Teachers 208 CFA 9 (one) 0.93 8.77 – – 0.86 0.19 –
CFA 9 (three) 6.96 – – 0.90 0.17 – Canada 256 CFA 9 (one) 0.88 9.47 – – 0.80 0.18 – CFA 9 (three) 5.04 – – 0.92 0.13 – Hong Kong 100 CFA 9 (one) 0.93 4.05 – – 0.88 0.18 – CFA 9 (three) 2.58 – – 0.95 0.13 – Indonesia 100 CFA 9 (one) 0.81 2.79 – – 0.86 0.13 – CFA 9 (three) 2.97 – – 0.87 0.14 – Oman 192 CFA 9 (one) 0.90 5.91 – – 0.86 0.16 – CFA 9 (three) 4.72 – – 0.91 0.14 –
(Klassen et al., 2012) (856) CFA 9 (one) 0.93 8.77 – – 0.86 0.19 –
India (Chaudhary et al., 2012) Manufacturing and Services
438 CFA 17 (one) 0.90 2.59 0.905 0.921 0.917 0.060 – CFA 17 (three) 2.30 0.922 0.933 0.933 0.055 – CFA 9 (one) 0.82 2.34 0.962 0.970 0.962 0.055 – CFA 9 (three) 2.42 0.964 0.972 0.964 0.057 – Netherlands (Breevaart et al.,
2012)
Various 271 MGCFA 9 (one) – 14.66 – – 0.90 0.10 0.05 MGCFA 9 (three) 6.61 – – 0.96 0.06 0.04 Italy White-collar 668 CFA 9 (one) – 21.71 0.710 0.760 0.780 0.230 –
CFA 9 (three) 7.20 0.894 0.898 0.929 0.137 – CFA 9 (three - Mod.) 2.93 0.967 0.961 0.982 0.077 – Netherlands 2,213 CFA 9 (one) – 14.81 0.913 0.916 0.935 0.112 – CFA 9 (three) 8.96 0.950 0.959 0.967 0.085 – CFA 9 (three - Mod.) 7.97 0.956 0.967 0.973 0.080 –
(Balducci et al., 2010) (2,881) MGCFA 9 (three) 0.92 5.57 0.958 0.965 0.975 0.057 –
Norway (Nerstad et al., 2010) Various 1,266 CFA 17 (one) – 17.52 – – 0.96 0.11 – CFA 17 (two) 13.04 – – 0.97 0.10 – CFA 17 (three) 12.26 – – 0.97 0.09 – CFA 9 (one) – 24.91 – – 0.95 0.14 – CFA 9 (two) 7.01 – – 0.99 0.07 – CFA 9 (three) 7.43 – – 0.99 0.07 – Finland (Seppälä et al., 2009) Various 9,404 CFA 17 (three) – 7.83 0.95 – 0.96 0.064 – CFA 9 (three) – 11.07 0.96 – 0.98 0.076 – USA (Muilenburg-Trevino, 2009) Non-profit Organization
Employees
227 EFA 15 (one) 0.94 – – – – – – CFA 17 (one) 0.93 5.04 – 0.74 0.94 0.14 – CFA 17 (three) 3.36 – 0.82 0.96 0.11 – Japan (Shimazu et al., 2008) Engineers and Nurses 2,334 CFA 17 (one) – 30.52 – 0.81 0.85 0.11 – CFA 9 (one) 0.92 12.86 – 0.90 0.92 0.07 – Australia Various 473 – – – – – – – – Belgium 767 – – – – – – – – Canada 267 – – – – – – – – Finland 3,651 – – – – – – – – France 221 – – – – – – – – Germany 465 – – – – – – – – Netherlands 2,163 – – – – – – – – Norway 2,114 – – – – – – – – South Africa 2,547 – – – – – – – – Spain 1,832 – – – – – – – –
(Schaufeli et al., 2006) (14,521) CFA 9 (one) 0.80 22.76 0.89 0.89 0.91 0.04 –
CFA 9 (three) 13.45 0.93 0.95 0.96 0.03 – Sweden (Hallberg and Schaufeli,
2006)
Information 186 CFA 9 (one) 0.93 4.12 0.95 – 0.97 0.13 0.05 Communication CFA 9 (three) 3.91 0.96 – 0.97 0.13 0.04 Technology consultants
China (Yi-wen and Yi-qun, 2005) Middle School Teachers 277 CFA 15 (one) 0.90 2.74 – 0.89 0.89 0.081 – CFA 15 (three) 2.83 – 0.89 0.89 0.083 – CFA 15 (three - Mod.) 1.55 – 0.94 0.97 0.046 – (Continued)
TABLE 1 | Continued
Country (Authors) Occupational group N Items version (factors) Total α χ2/df TLI/NNFI GFI CFI RMSEA SRMR South Africa (Storm and
Rothmann, 2003)
Police Officers 2,396 CFA 17 (three) – 17.06 0.91 0.90 0.92 0.08 – CFA 17 (one) 18.91 0.90 0.87 0.91 0.09 – CFA 15 (three) – 13.30 0.93 0.94 0.95 0.07 – CFA 13 (one) – 12.34 0.95 0.95 0.96 0.06 – Germany (Sonnentag, 2003) Public Service 147 PCA 17 (one) 0.91 – – – – – – The extracted results are presented with two or three decimal places depending of the original authors report. Mod., Modification Indices; BCFA, Bayesian Confirmatory Factor Analysis; CFA, Confirmatory Factor Analysis; EFA, Exploratory Factor Analysis; MGCFA, Multi-Group Confirmatory Factor Analysis; PCA, Principal Component Analysis; GFI, goodness-of-fit index; RMSEA, Root Mean Square Error of Approximation; NNFI, Non Normed Fit Index; TLI, Tucker Lewis Index; CFI, Comparative Fit Index; SRMR, Standardized Root Mean Square Residual.
Analysis. Thus, we included more studies, allowing a more global perspective on UWES versions. The UWES has also been used among different occupational groups (e.g., students, hospital staff, managers, police officers, teachers), and a study by Seppälä et al. (2009) showed that the UWES-9’s structure, but not the UWES-17’s structure, remained relatively unchanged
among the different occupational groups.Extremera et al. (2012)
found factorial invariance for the Spanish UWES-15 between genders in a multi-occupational sample, and between two
different multi-occupational samples. More recently,
Rodríguez-Montalbán et al. (2014)concluded that the UWES-9 has a better
fit to a tri-factorial structure, while Hernandez-Vargas et al.
(2016) confirmed the three-factorial structure in the UWES-9 and UWES-17 scales, concluding that the UWES-9 showed a better goodness-of-fit and measurement invariance among two Mexican samples.
While researchers have translated the UWES’ student version into Portuguese (UWES-S, version of 14-item from UWES-17) and confirmed its good psychometric properties or invariance (Schaufeli et al., 2002a; Cadime et al., 2016), there is a lack of rigorous validation studies with either version of the UWES among Portuguese workers. Some studies used the 24-item
original version (e.g.,Picado et al., 2008), while others used only
the vigor and dedication “core” work engagement scales (e.g.
Chambel, 2012), thereby jeopardizing a better understanding of work engagement among Portuguese workers. Additionally, cross-cultural studies with the UWES among students were performed in several countries, including the Philippines and
Argentina (Mesurado et al., 2016), Spain and the Netherlands
(Schaufeli et al., 2002a), Turkey (Çapri et al., 2017), Ecuador (Portalanza Chavarría et al., 2017), South Africa (Mostert et al.,
2017), South Korea (Römer, 2016), Puerto Rico (
Sánchez-Cardona et al., 2016), India (Rastogi et al., 2017), Japan (Tsubakita et al., 2017), Lithuania (Paradnike and Bandzeviˇciene,
2015), China (Meng and Jin, 2017), and the USA (Mills et al.,
2012), looking for the cultural influences and impact of national
values on participants and organizations (Hofstede et al., 2010).
To perform cross-cultural studies, including personality
assessment (Dana, 2000), or to compare constructs
within nations (Davidov et al., 2014), equivalent construct
measurements are required, allowing meaningful comparisons of means or/and relations between constructs. The latent structure and its items should have stability across countries (measurement
invariance according to van de Schoot et al., 2015). Although
this seems to be a logical prerequisite, measurement invariance is
rarely tested as it should be (Davidov et al., 2014), and sometimes
when it is tested, it is done without adequate parametrization
for ordinal items (Koh and Zumbo, 2008; Hirschfeld and von
Brachel, 2014). If measurement invariance is not obtained, the constructs’ meaning is different and means of each group cannot
be compared (Putnick and Bornstein, 2016). Considering the
existence of a Brazilian UWES version (Vazquez et al., 2015)
but the absence of a Portuguese version for multi-occupational groups, and, especially, the absence of a UWES-9 version adapted simultaneously for both countries, it seems crucial to develop a unique version that will allow development of comparative studies of workers‘ work engagement in Portugal and Brazil. This version would be useful for future studies extended to other countries with Portuguese as the official language, such as the African Nations of Angola and Mozambique, Guinea-Bissau, Cape-Verde and São Tomé and Príncipe. Response bias is more likely to occur with long and time-consuming scales, while short versions tend to reduce this kind of bias. They are also easier to use, especially when they are used with other scales.
As far as we know, this is the first study using the same UWES version developed for both countries. We aim to assess the validity evidence related to the internal structure of the Portuguese version (PT-BR and PT-PT) of the original Utrecht
Work Engagement Scale 9 items version (Schaufeli et al., 2006).
More specifically, we evaluated: the UWES’ Dimensionality, measurement invariance, and Reliability of the scores accordingly to the Standards for Educational and Psychological Testing
framework (American Educational Research Association, 2014),
and the existence of a work engagement second-order factor. We compared the fit of the original UWES-9 tri-factorial structure between Brazil and Portugal, considering cultural similarities between samples of Brazilian and Portuguese workers, and also the existence of numerous versions of UWES; we hypothesized: (H1) the original UWES-9 three-factor first-order structure will present evidence of construct validity; (H2) an invariant structure for both countries; (H3) and will show a second-order latent factor, work engagement, with validity evidence that supports its usage among workers from Portugal and Brazil; (H4) the UWES-9 second-order latent factor model will show measurement invariance between countries; and, (H5) UWES-9’s dimensions will present different mean scores for Brazilian and Portuguese workers due to socio-cultural differences between the two countries.
METHOD
Participants
A sample of 524 Brazilian workers and a sample of 522 Portuguese workers completed the UWES-9. Participation was anonymous and voluntary. The average age was 35.57 years old (SD = 10.04), with 64% being female. Using the International
Standard Classification of Occupations - ISCO-08 (International
Labour Office, 2012) to allow for comparisons between countries, worker’s occupations were mainly categorized as professional or administrative support (Table 2). Regarding educational level, 78% of the sample had, at the least, graduated from college. The high percentage of Masters in Portugal is due to recent changes in graduation, corresponding mostly to integrated masters, which are similar to college graduation in Brazil. We used non-probabilistic convenience sampling, with the following inclusion criteria: all participants had, as workers, a contract or formal ties with their employers, were able to read, and had easy access to a PC, smartphone or tablet, to access the online platform where the instruments were deployed.
Measures
To assess work engagement, we used the Utrecht Work
Engagement Scale short version UWES-9 (Schaufeli and Bakker,
2003), developing a new version for the Portuguese language
transculturally adapted both for Brazil and Portugal (Table 3). The UWES-9 is a self-report scale scored on a 7-point rating scale (0 = never; 6 = always) with three questions each about the three dimensions of vigor, dedication, and absorption. The 9 was chosen because previous research with the UWES-9 has shown validity evidence across different countries such as
Japan, Spain, Norway and China (Shimazu et al., 2008; Nerstad
et al., 2010; Fong and Ng, 2012).
Thus, to develop this Portuguese version, we used UWES’
original manual (Schaufeli and Bakker, 2003) and we followed
the International Test Commission guidelines for translating and
adapting tests (International Test Commission, 2017) adapting
the items to the Portuguese language per the Orthographic Agreement signed by both Portugal and Brazil in 2009. We discussed the items with Portuguese and Brazilian specialists on psychology and methodology, to create a version of the items that gathered the consensus of the specialists regarding the cultural, semantic and idiomatic equivalence in both countries. Finally, we did a small pilot test with 15 workers from each country, who didn’t suggest any modifications and understood the adapted UWES-9 items. The final single version (for both countries) had no other changes besides the translation to adapt words according to each country’s specificities.
Procedures
Data were gathered from 2014 to 2017, simultaneously in both countries, in an effort to respect each institution’s authorization and to have a larger sample, since web surveys present low
response rates (Massey and Tourangeau, 2013). The participants
filled a self-report psychometric instrument (UWES-9) and a brief sociodemographic questionnaire, both of which were
available online using LimeSurvey software (Limesurvey GmbH,
2017) running on the website of each faculty in each country.
Using several contact persons, researchers invited, in person or via e-mail, 260 Portuguese and 280 Brazilian companies to disseminate the study and ask for voluntary participation among nearby 1,500 workers of each country. Nearly 35% of the disseminated questionnaires were completed in both countries. Before they completed the survey, some information about the study was presented, explaining the aims and explaining that it was a research study where the company would not
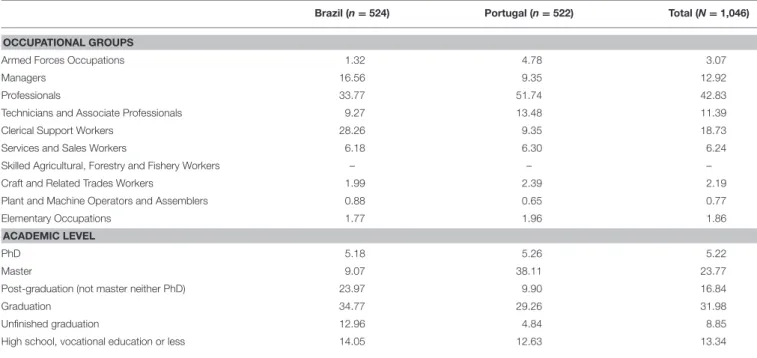
TABLE 2 | Percentage of occupational groups for each country and total.
Brazil (n = 524) Portugal (n = 522) Total (N = 1,046)
OCCUPATIONAL GROUPS
Armed Forces Occupations 1.32 4.78 3.07
Managers 16.56 9.35 12.92
Professionals 33.77 51.74 42.83
Technicians and Associate Professionals 9.27 13.48 11.39
Clerical Support Workers 28.26 9.35 18.73
Services and Sales Workers 6.18 6.30 6.24
Skilled Agricultural, Forestry and Fishery Workers – – –
Craft and Related Trades Workers 1.99 2.39 2.19
Plant and Machine Operators and Assemblers 0.88 0.65 0.77
Elementary Occupations 1.77 1.96 1.86
ACADEMIC LEVEL
PhD 5.18 5.26 5.22
Master 9.07 38.11 23.77
Post-graduation (not master neither PhD) 23.97 9.90 16.84
Graduation 34.77 29.26 31.98
Unfinished graduation 12.96 4.84 8.85
T A B L E 3 | U W E S -9 or ig in al an d P or tu gu es e ve rs io ns . It e m O ri gi na l U W E S –9 ( S c ha uf e li a nd B a k k e r, 2 0 0 3 ) P or tugue s e (B ra zi l a nd P or tuga l) v e rs ion of U W E S -9 N ev er A lm os t nev er R ar el y S om et im es O ften Ver y of ten A lw ay s N un ca Q uas e nun ca À s vez es R eg ul ar m en te Fr eq uent em en te Q uas e sem p re S em p re 0 1 2 3 4 5 6 0 1 2 3 4 5 6 N ev er A few tim es a year or les s O nce a m on th or les s A few tim es a m on th O nce a w eek A few tim es a w eek Ev er y d ay N en hum a vez A lg um as vez es p or an o Um a vez ou m en os p or m ês A lg um as vez es p or m ês Um a vez p or sem an a A lg um as vez es p or sem an a To d os os d ias V igor V igor 1 A t m y w or k, If eel b ur st in g w ith en er gy S in to -m e ch ei o d e en er gi a no m eu tr ab al ho 2 A t m y jo b ,I feel st ro ng an d vi go ro us S in to -m e co m fo rça e vi go r no m eu tr ab al ho 5 W hen Ig et up in th e m or ni ng ,I feel lik e go in g to w or k Q uan d o m e lev ant o p el a m an hã, tenh o vo nt ad e d e ir tr ab al har D e di c a ti on D e di c a ç ã o 3 Iam en th us ias tic ab ou t m y jo b S ou um a p es so a en tu si as m ad a co m o m eu tr ab al ho 4 M y jo b in sp ires m e O m eu tr ab al ho in sp ira-m e 7 Iam p ro ud on th e w or k th at Id o Ten ho or gu lh o no tr ab al ho q ue real iz o Abs or pt ion Abs or ç ã o 6 If eel hap p y w hen Iam w or ki ng in ten sel y S in to -m e fel iz q uan d o es to u in ten sam en te en vo lv id o no tr ab al ho 8 Iam im m er sed in m y w or k Fi co ab so rv id o co m o m eu tr ab al ho 9 Ig et car ried aw ay w hen I’m w or ki ng S in to -m e tão em p ol gad o, q ue m e d ei xo lev ar q uan d o es to u a tr ab al har
access individual data, and that companies simply helped the researchers disseminating the study. Informed consent was obtained online from all participants. The online survey presented, to begin with, information about the study’s aims (and an institutional mail to answer doubts if the participant wanted), and also the Consent Form: “I agree to participate in this research study. I understand the purpose and nature of this study and I’m participating voluntarily. My answers in this study will remain confidential. I can withdraw my participation at any time.” If the person agreed to participate, then he/she clicked “Yes” and was prompted to begin completing the survey. Upon completing the survey, participants were presented the sentence: “Thank you for your participation. It is not possible to identify your questions individually and the analysis will be performed as aggregated data by university researchers,” aiming to reinforce the confidential nature of data.
To allow comparative studies, the same procedures were used in both countries. The study was approved by the Ethics Committee of the University of Porto, Portugal, and the University of São Paulo, Brazil, and followed the usual rules for online surveys, namely no access of participants’ companies to individual results, and no direct contact between participants and researchers (a few used the email to clarify some details about the access to individual data, but it is not possible to identify if they participated in the study).
Data Analysis
Aiming to confirm the original structure of the instrument, a confirmatory factor analysis (CFA) was conducted to verify if the proposed 3-factor structure presented an adequate fit to the study sample. We used as the goodness-of-fit indices the TLI (Tucker
Lewis Index), NFI (Normed Fit Index), χ2/df (ratio chi-square
and degrees of freedom), CFI (comparative fit index) and the RMSEA (root mean square error of approximation). The fit of
the model was considered good for χ2/df smaller than 5, CFI,
NFI and TLI values above 0.95 and RMSEA values below 0.08 (Hoyle, 1995; Boomsma, 2000; McDonald and Ho, 2002; Byrne,
2016). All statistical analyses were performed with R (R Core
Team, 2017) and Rstudio (RStudio Team, 2017). The descriptive
statistics were obtained with the skimr package (Arino de la
Rubia et al., 2017). The CFA analysis was conducted with the
lavaan package (Rosseel, 2012) using the Weighted Least Squares
Means and Variances (WLSMV) estimation method.
To analyze the convergent validity evidence, the average
variance extracted (AVE) was estimated as described inFornell
and Larcker (1981)and Marôco (2014). Values of AVE ≥ 0.5 were considered indicative of the constructs’ convergent validity
evidence of the UWES’ factors (Hair et al., 2009).
For discriminant validity evidence, to check if the items that represent a dimension were not strongly correlated with other
dimensions (Marôco, 2014), discriminant validity evidence was
checked (Fornell and Larcker, 1981; Marôco, 2014): for two
factors x and y, if AVEx and AVEy ≥ ρ2xy (squared correlation
between the factors x and y) there is discriminant validity evidence.
The reliability of the scores was assessed with estimates of internal consistency, the Composite Reliability (CR), ordinal α
(Oliden and Zumbo, 2008) and ω (Raykov, 2001); higher values were indicative of better internal consistency results.
The reliability estimates and measurement invariance for the first-order three-factor model taking in account the categorical
items with theta-parameterization (Millsap and Yun-Tein,
2004) were calculated with the semTools package (SemTools
Contributors, 2016). Measurement invariance for the
second-order model was assessed with the lavaan package (Rosseel,
2012), comparing a group of seven different models based on
the recommendations ofMillsap and Yun-Tein (2004) and on
the second-order models’ invariance specificities (Chen et al.,
2005): (a) configural invariance, (b) first-order factor loadings,
(c) second-order factor loadings, (d) thresholds of measured variables, (e) intercepts of first-order factors, (f) disturbances of first-order factors, and (g) residual variances of observed variables. The percentiles were calculated using the doBy package (Højsgaard and Halekoh, 2016). The comparisons of the raw levels of the UWES’ factors between countries’ groups were addressed using a t-student test for independent groups using the
stats package (R Core Team, 2017). The effect sizes (Cohen’s d)
were calculated using the lsr package (Navarro, 2015).
RESULTS
Validity Evidence Based on Internal
Structure
Dimensionality
Items’ distributional properties
Summary measures, skewness (sk), kurtosis (ku) and a histogram for each of the nine items are presented (Table 4) and were used to judge distributional properties and psychometric sensitivity. Absolute values of ku smaller than 7 and sk smaller than 3 were considered as indicative of no strong deviations from the
normal distribution (Finney and DiStefano, 2013). The Mardia’s
Multivariate Kurtosis for the nine items of UWES was 90.36; p < 0.001. All possible answer values for each item were also present, and no outliers were deleted. These items’ distributional properties are indicative of appropriate psychometric sensitivity, as it would be expected that these items would follow an
approximate normal distribution in the population under study. Despite these univariate and multivariate normality indicators, the WLSMV estimator was used, taking into consideration the ordinal level of measurement of the items.
Factor related validity evidence
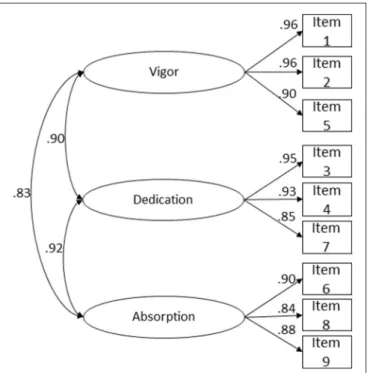
The 3-factor model fit to the data was acceptable (Figure 1), since CFI, NFI, and TLI values were above 0.95, but RMSEA values were above 0.10, while the factor weight of all items was above 0.84.
FIGURE 1 | UWES-9 tri-factor structure fit to a combined sample of Portuguese (n = 520) and Brazilian Workers (n = 524). Correlations between latent variables, and factor loadings for each item are shown χ2(24)=408.520, p <0.001, N = 1,046, CFI = 0.998, NFI = 0.998, TLI = 0.997, RMSEA = 0.124, P(RMSEA ≤ 0.05) < 0.001, 90% CI (0.113; 0.135).
TABLE 4 | UWES’ items descriptive statistics.
UWES-9 items Mean SD Minimum Maximum Skewness Kurtosis Histogram
UWES1V 4.14 1.38 0 6 −0.73 −0.09 UWES2V 4.14 1.42 0 6 −0.77 −0.04 UWES3D 4.31 1.54 0 6 −0.84 −0.15 UWES4D 4.05 1.72 0 6 −0.66 −0.59 UWES5V 3.74 1.78 0 6 −0.53 −0.77 UWES6A 4.54 1.54 0 6 −1.13 0.56 UWES7D 4.72 1.53 0 6 −1.37 1.26 UWES8A 4.44 1.51 0 6 −1.04 0.45 UWES9A 3.98 1.71 0 6 −0.70 −0.40
Convergent validity evidence
The AVE was good, for Vigor (0.89), for Dedication (0.83) and Absorption (0.76). These results suggest good convergent validity evidence for the UWES-9 and demonstrated that items contained within each factor are related to each other.
Discriminant validity evidence
Regarding the discriminant validity evidence, AVEvigor = 0.89
and AVEdedication = 0.83 were bigger than r2VD = 0.81, the
AVEabsorption=0.76 and AVEdedication=0.83 were both smaller
than r2AD = 0.85, and the AVEvigor = 0.89 and and the
AVEabsorption = 0.76 were both bigger than r2VA = 0.69. The
discriminant validity evidence was good between Vigor and Absorption and between Vigor and Dedication, and bad between Dedication and Absorption. These findings showed that some factors are strongly related to each other.
Second-order construct
Second-order models are potentially applicable when the first-order factors are highly correlated with each other, and when there is a higher order factor that possibly is responsible for
the relations between the first-order factors (Chen et al., 2005;
Marôco, 2014).
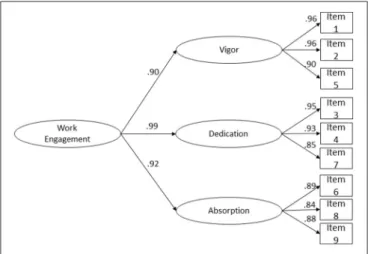
Considering the high correlations between Vigor, Dedication and Absorption and the lack of discriminant validity evidence between the Dedication and Absorption factors, we added a second-order factor that we named Work Engagement. The goodness-of-fit of the second-order model was considered acceptable (Figure 2), and the loadings of Work Engagement on its first-order factors were quite high and statistically significant (p < 0.001): 0.88 for Vigor, 0.98 for Dedication and 0.94 for Absorption, suggesting that the second-order factor is equally defined by the first-order dimensions of the work engagement scale.
FIGURE 2 | UWES-9 second-order latent factor structure fit a combined sample of Portuguese (n = 522) and Brazilian Workers (n = 524).
Second-order latent loadings for each factor, and factor loadings for each item are shown χ2(25)=409.919, p < 0.001, N = 1,046, CFI = 0.998, NFI = 0.998, TLI =0.997, RMSEA = 0.121, P(RMSEA ≤ 0.05) < 0.001, 90% CI (0.111; 0.132).
Considering previous analysis and high correlations between the factors, we propose that the UWES-9 can be used to define
work engagement as a second-order factor (Chen et al., 2005).
This model was supported by the data, showing better goodness-of-fit indices than the three-factor (one-order) solution. This indicates that in addition to the three UWES subdimensions, there is also a more general domain-specific work engagement. With this solution, we keep aligned with the theoretical
three-factor division of UWES (Schaufeli and Bakker, 2003), but also
show that work engagement can be a second-order dimension. Reliability of the Scores: Internal Consistency Evidence
Regarding internal consistency (Table 5), ordinal Cronbach’s α for the total sample was 0.95, suggesting very good internal consistency evidence. Additionally, we presented other ordinal reliability estimates (CR and ω) to allow future comparisons with other studies. Those other estimates also presented good internal consistency evidence.
The proportion of the second-order factor explaining the
variance at first-order factors’ level (ωL2) was 0.96, the proportion
of the second-order factor explaining the total score (ωL1) was
0.93, and the proportion of observed variance explained by the second-order factor after controlling for the uniqueness from
the first-order factor (ωpartialL1) was 0.97. Thus, the internal
consistency of the higher-order construct was very good. Measurement Invariance
To detect whether the same original three-factor model holds in each country (Table 6), a group of nested models with
indications of equivalence is needed (Marôco, 2014). This should
be done considering the ordinal nature of the scale. Thus, we tested measurement invariance for categorical items with theta-parameterization. Full uniqueness measurement invariance was
supported by theCheung and Rensvold (2002)criterion (1CFI <
0.01), and also partial scalar invariance by the (more) restrictive
1χ2criterion (Satorra and Bentler, 2001); the test comparing the
fit of the constrained vs. free models is not statistically significant. Results supported the structural invariance between Portugal and Brazil.
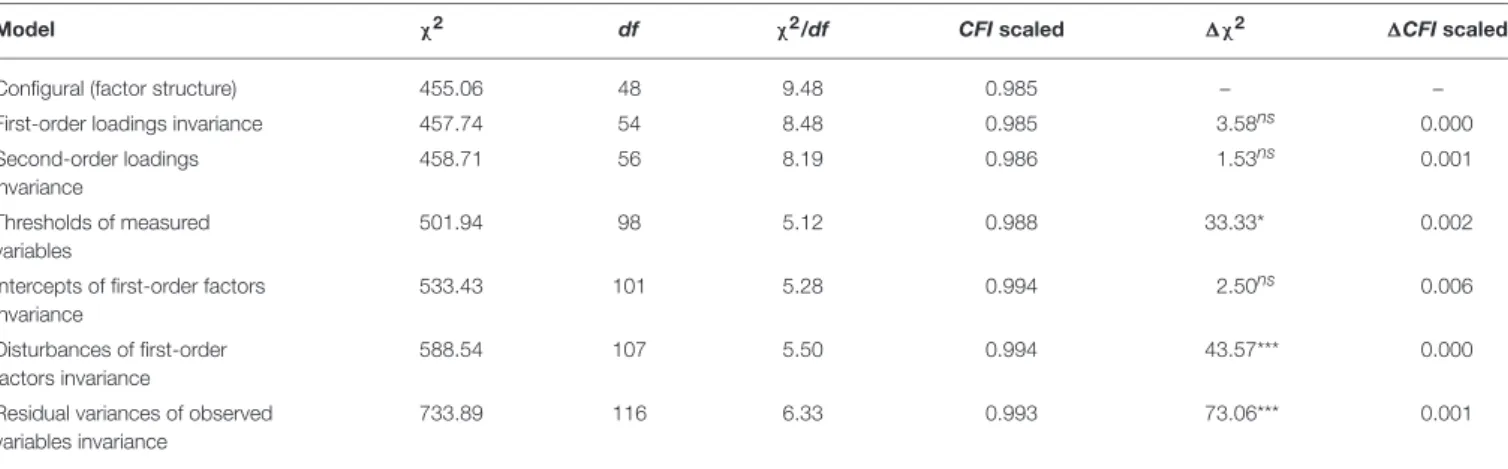
Regarding the UWES-9 second-order three-factor structure, full uniqueness measurement invariance was supported by the Cheung and Rensvold (2002) criterion (1CFI < 0.01),
and the 1χ2 (Satorra and Bentler, 2001) supported (partial)
scalar invariance for the models comparison between countries (Table 7).
TABLE 5 | Internal consistency of UWES dimensions. UWES-9
dimension
OrdinalαTotal sample OrdinalωTotal sample CRTotal sample
Vigor 0.93 0.94 0.96
Dedication 0.93 0.92 0.94
Absorption 0.90 0.88 0.91
TABLE 7 | UWES-9 second-order three-factor latent model comparison between countries.
Model χ2 df χ2/df CFIscaled 1χ2 1CFIscaled
Configural (factor structure) 455.06 48 9.48 0.985 – –
First-order loadings invariance 457.74 54 8.48 0.985 3.58ns 0.000
Second-order loadings invariance 458.71 56 8.19 0.986 1.53ns 0.001 Thresholds of measured variables 501.94 98 5.12 0.988 33.33* 0.002
Intercepts of first-order factors invariance
533.43 101 5.28 0.994 2.50ns 0.006
Disturbances of first-order factors invariance
588.54 107 5.50 0.994 43.57*** 0.000
Residual variances of observed variables invariance
733.89 116 6.33 0.993 73.06*** 0.001
nsp > 0.05;*p < 0.05; ***p < 0.001.
TABLE 6 | Model comparison between Portugal and Brazil. Model
invariance
χ2 df χ2/df CFIscaled 1χ2 1CFIscaled
Configural (factor structure) 455.06 48 9.48 0.985 – – Metric (loadings) 457.74 54 8.48 0.985 4.88ns 0.000 Scalar (thresholds) 500.83 96 5.22 0.987 66.62** 0.002 Full uniqueness (residuals) 609.22 105 5.80 0.986 100.97*** 0.002 Latent means 619.79 108 5.74 0.993 0.439ns 0.008 nsp > 0.05;**p < 0.01; ***p < 0.001.
Dimensions’ Comparisons
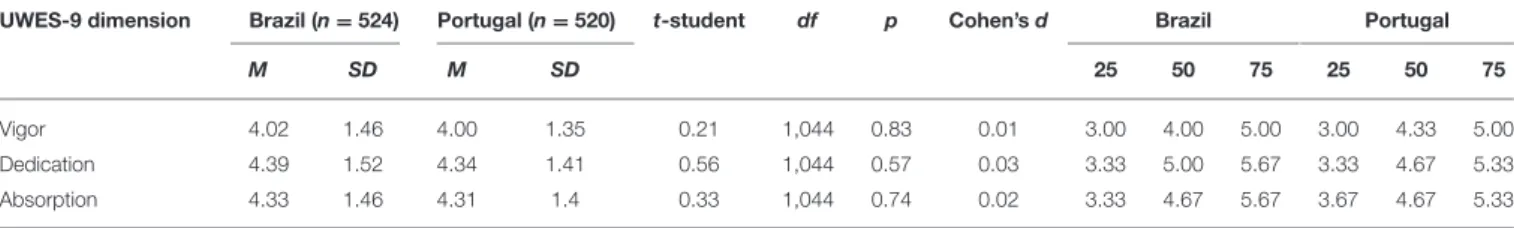
Finally, since we had measurement invariance between samples, we performed a comparative analysis of the UWES dimensions between the two countries (Table 8). There were no statistically significant differences on the UWES dimensions between Portuguese and Brazilian workers.
DISCUSSION
Our results confirmed four of the five hypotheses. The UWES-9 tri-factorial first-order model showed validity evidence that allows its use among workers from Brazil and Portugal (H1). This result is in line with several studies showing that the UWES-9 three-factor first-order model has acceptable (at least)
psychometric properties (Villotti et al., 2014; Flores Jiménez
et al., 2015; Vazquez et al., 2015; Sinval et al., 2018), although other studies presented better fit with other alternative model
structures (de Bruin and Henn, 2013; Ho Kim et al., 2017).
Our results also revealed that this version of the UWES-9 presented measurement invariance for Portugal and Brazil,
which allows its use in comparative studies between these countries and confirms the second hypothesis (H2). In fact, measurement invariance has also been found between other countries: samples of white-collar workers from the
Netherlands and Italy presented metric invariance (Balducci
et al., 2010); UWES-15 version between Greek and Dutch
workers (Xanthopoulou et al., 2012); the student version
(UWES-S) presented invariance only for the absorption dimension among samples of students from Portugal, Spain, and the
Netherlands (Schaufeli et al., 2002a). Our findings support the
need for more studies to test measurement invariance across
countries (Schaufeli et al., 2006). Other studies demonstrated
factorial invariance for members of the same occupational
group between different countries or ethnic groups (Storm and
Rothmann, 2003), which, in turn, makes UWES’ measurement invariance more likely. Additionally, no factorial invariance across samples from various countries of different continents was
found in the study ofSchaufeli et al. (2006).
Regarding the third hypothesis, the second-order latent factor work engagement was proposed following concerns with the high correlations between the three latent factors of the UWES-9
found in various studies (Schaufeli et al., 2002b; Schaufeli and
Bakker, 2003). Our results confirmed H3, and this kind of approach isn’t a novelty in the sense that others tried this with two
first-order latent factors, vigor and dedication (Alok, 2013) and
with three first-order latent factors (Sinval et al., 2018). However,
in the first study a one-factor model presented better fit, and in the second study the second-order model had a better fit than the first-order one in a Portuguese sample of rescue workers. Moreover, no studies with second-order UWES’ models were found for samples of workers from Brazil.
Concerning the measurement invariance of this second-order model (H4), our study obtained a novel finding, since we found measurement invariance for the level of residual variances of observed variables across samples of workers from various occupational groups of both countries. Partial metric invariance
was found before (Sinval et al., 2018) for a second-order
model across different occupations (firefighters, nurses, and police officers), although this is the first study that presents full
TABLE 8 | Comparative analysis between countries (means, SD and percentiles).
UWES-9 dimension Brazil (n = 524) Portugal (n = 520) t-student df p Cohen’s d Brazil Portugal
M SD M SD 25 50 75 25 50 75
Vigor 4.02 1.46 4.00 1.35 0.21 1,044 0.83 0.01 3.00 4.00 5.00 3.00 4.33 5.00
Dedication 4.39 1.52 4.34 1.41 0.56 1,044 0.57 0.03 3.33 5.00 5.67 3.33 4.67 5.33
Absorption 4.33 1.46 4.31 1.4 0.33 1,044 0.74 0.02 3.33 4.67 5.67 3.67 4.67 5.33
measurement invariance across different countries for a second-order model of the UWES-9, which is particularly interesting given the fact that these two countries are from different continents. The vast majority of the studies on work engagement were conducted in countries from North America and Western
Europe (Hu et al., 2014), but our study included a South America
country that can be compared with a European country regarding work engagement.
The dimensions of UWES-9 didn’t present statistically significant different levels between Brazil and Portugal, rejecting H5, formulated based on socio-cultural differences between these countries. However, no other studies comparing Portugal and Brazil in terms of work engagement with this instrument were found, since other studies measured the three UWES dimensions in Portugal and Brazil individually in various occupations (Marques-Pinto and Picado, 2011; Vazquez et al., 2015), using different versions of the instrument; thus, their findings could not be directly compared with ours. This enforces the utility of using our version of the UWES-9 to establish larger comparisons with rigor between two brother countries. Maybe socio-cultural differences are not so strong between Portugal and Brazil, or since data were collected during the world economic crisis, the workers are thankful to have a job (work engagement levels are moderate to high) and work engagement levels are not affected by the country. Having now a unique instrument in the Portuguese language, further studies can be developed, since cross-cultural studies between Portugal-Brazil are not that frequent.
After presenting a revision of the international versions of Utrecht Work Engagement Scale, this paper aimed to investigate the validity evidence related to the scale dimensionality of the Portuguese version of the UWES-9 developed simultaneously for Brazil and Portugal, namely, dimensionality, measurement invariance between Brazil and Portugal, and reliability of the scores. Our version showed good convergent validity evidence and acceptable discriminant validity evidence, and measurement invariance evidence for both the first- and second-order models for use in the Portuguese vs. Brazilian cultural context. The goodness-of-fit indices were good/acceptable for the UWES nine item version. This solution is corroborated by some international studies and may have been found because work engagement, as measured by the UWES, is a construct with high correlations
between factors (Mauno et al., 2007; Hakanen et al., 2008; Weigl
et al., 2010; Federici and Skaalvik, 2011; Chughtai and Buckley, 2013; Agarwal, 2014). In fact, a meta-analytic study found very high correlations between UWES factors: 0.95 between vigor and absorption, 0.90 between dedication and absorption and 0.88
between vigor and dedication (Christian and Slaughter, 2007).
We suggested that a second-order latent factor might account for such intercorrelations, and in our study it presented an acceptable fit. It is very common that when conducting confirmatory factor analysis, a three-factor solution may not be clear, but still fits as a possible model to interpret the work engagement results (Schaufeli and Bakker, 2010).
Previous research showed (see Table 1) that the UWES-9 three-factor solution was invariant between Italy and Dutch
white-collar workers samples (Balducci et al., 2010), but with
two versions of the instrument, one in each language. Although measurement invariance wasn’t obtained in a study between
10 countries with the UWES-9 (Schaufeli et al., 2006), the
UWES showed invariance in South African police officers of
different racial groups (Storm and Rothmann, 2003). Also,
for different Japanese occupations, the UWES-9 (one factor)
showed measurement invariance (Shimazu et al., 2008). For a
Dutch, Spanish and Portuguese student sample, the UWES-S (student survey) showed invariance only for the Absorption factor across the three countries; three-factor structure invariance
wasn’t obtained (Schaufeli et al., 2002a). However, in this
study, with a sample of Portuguese and Brazilian workers, the results revealed measurement invariance, allowing comparisons of means between these two countries using the same UWES-9
version. Our results are in line with those obtained bySeppälä
et al. (2009), who analyzed five different studies (N = 9,404), including a three-year longitudinal study (n = 2,555) among different occupational samples, concluding that vigor, dedication, and absorption presented a correlated three-factor structure, and although the structure of the UWES-17 did not remain the same across the samples and time, the structure of the UWES-9
remained relatively unchanged. AlthoughSchaufeli et al. (2006)
argued that measurement invariance is less likely to be obtained
between different occupational groups,Hernandez-Vargas et al.
(2016)found invariance across two Mexican samples, and our results showed measurement invariance across countries with samples containing different occupational groups. Moreover, the UWES-9 showed different means and percentiles for each country, with Portugal presenting higher values for vigor and absorption, which could be explained by different cultural
values (Hofstede et al., 2010) or occupational activities (see
Table 2) related primarily to mental demands instead of physical demands, and thus increasing absorption levels. Cross-cultural
analysis from Hu et al. (2014) compared work engagement
across East Asia (China and Japan) and Western Europe (Finland, Netherlands, and Spain), concluding that European employees were more engaged than Asian employees. Recently,
positively related to nations’ economic activity, and also with lower work centrality (thus valorizing leisure over work), strong democracy, high integrity, low corruption, gender inequality, and individualistic culture.
CONCLUSION
This Portuguese transcultural UWES-9 version has good construct validity evidence, and its use can be recommended in future research, namely to perform comparative studies between Portuguese-speaking countries or groups, to analyze work engagement’s association with other recent constructs, such
as job crafting as a protector from job boredom (Harju et al.,
2016), the relationship of work engagement with productivity or
person-job fit (De Beer et al., 2016; Fuller and Shikaloff, 2017),
or occupational differences in work engagement (Innstrand,
2016) or to perform longitudinal studies (Seppälä et al., 2009).
Additionally, we will be able to understand if these different groups/countries can differently perceive work engagement between them according to cultural and organizational values (Hofstede et al., 2010). Also, multi-cultural workforces that are
increasing in each country (OECD, 2016) challenge researchers
to pursue new research topics such as psychological assessment
and interventions with multicultural populations (Dana, 2000;
López, 2000). A transculturally valid UWES scale can aid research efforts to study migrant flows and employees’ well-being and productivity between Portugal and Brazil.
The study has some limitations, namely the convenience sample and the fact that only those with a professional occupation participated. Additionally, the samples were dependent on voluntary participation, which can elicit some bias or reflect the healthy worker myth, which means that those who are satisfied participate more in research studies, while the most
disengaged are too stressed to collaborate, according to Shah
(2009). In the future, it will be important to also evaluate workers’ situations as migrant or native, since it can affect their relationship with institutions and colleagues, thus influencing their work engagement. Moreover, other structures can be tested
in the future, such as two latent factors (Gilchrist et al., 2013;
Sulaiman and Zahoni, 2016).
Regarding theoretical implications, considering previous analysis and high correlations between the factors, we propose that the UWES-9 can be used to define work engagement as a second-order factor. This model was supported by the data, showing better goodness-of-fit indices than the three-factor (one-order) solution. This indicates that in addition to the three UWES sub-dimensions, there is also a more general domain-specific work engagement. With this solution, we keep aligned with the theoretical three-factor division of the UWES, but also show that work engagement can be a second-order construct. This is one of the main novelties of our study.
As practical implications, the UWES-9 transcultural version presented acceptable psychometric properties and invariance between Portugal and Brazil, allowing cross-cultural studies between these countries. Recent international workforce flows present a challenge for human resource management, since migrants are used to increase productivity, but they can have different perceptions about the organization where they are
employees (Pocnet et al., 2015; Wojczewski et al., 2015; Le
et al., 2016). Migrant workers’ work engagement with labor
market has already attracted researchers’ interest (Samaluk, 2016)
and UWES seems to be an important measure to understand employees’ work engagement in the organizations, allowing human resources departments to better adapt their practices to workforces, especially when the workers are migrants. Moreover, asSchaufeli (2017)recently argued, work engagement may not only be studied at the individual, psychological level, but also at the collective and national level as it relates in meaningful ways with various economic and sociocultural indicators, helping organizations to increase their productivity due to engaged workers who present high performance and job satisfaction (Christian et al., 2011).
ETHICS STATEMENT
This study was carried out in accordance with the
recommendations of the Ethics guidelines, of the FPCEUP and FFCLRP-USP Ethics Committees with written informed consent from all subjects. All subjects gave written informed consent in accordance with the Declaration of Helsinki. The protocol was approved by the FPCEUP and FFCLRP-USP Ethics Committees.
AUTHOR CONTRIBUTIONS
All authors of this research paper have directly participated in the planning, execution, or analysis of this study. More specifically, JS wrote the paper, and with JM performed all statistical analysis and its discussion. JS and SP discussed cross-cultural topics, and JS and CQ discussed theoretical framework.
FUNDING
The authors would like to thank the Portuguese National Occupational Health Program of the Directorate-General of Health (DGS) for the sponsorship. And to the University of São Paulo (USP) International grant conceded to JS (Grant agreement number: 2014.1.3766.1.8). This work was funded by the Center for Psychology at the University of Porto, Portuguese Science Foundation (FCT UID/PSI/00050/2013) and EU FEDER through COMPETE 2020 program (POCI-01-0145-FEDER-007294).
REFERENCES
Agarwal, U. A. (2014). Linking justice, trust and innovative work behaviour to work engagement. Pers. Rev. 43, 41–73. doi: 10.1108/PR-02-2012-0019
Alfes, K., Truss, C., Soane, E. C., Rees, C., and Gatenby, M. (2013). The relationship between line manager behavior, perceived HRM practices, and individual performance: examining the mediating role of engagement. Hum. Resour. Manage. 52, 839–859. doi: 10.1002/hrm.21512
Alok, K. (2013). Work engagement in India: a factorial validation study of UWES-9 scale. Manag. Labour Stud. 38, 53–62. doi: 10.1177/0258042X134 91478
American Educational Research Association, American Psychological Association, and National Council on Measurement in Education (2014). Standards for Educational and Psychological Testing. Washington, DC: United States of America; American Psychological Association.
Arino de la Rubia, E., Zhu, H., Ellis, S., Waring, E., and Quinn, M. (2017). skimr: skimr (R Package Version 0.9100) [Computer software]. Available online at: https://github.com/ropenscilabs/skimr
Bakker, A. B., Rodríguez-Muñoz, A., and Derks, D. (2012). La emergencia de la psicología de la salud ocupacional positiva. Psicothema 24, 66–72.
Bakker, A. B., Schaufeli, W. B., Leiter, M. P., and Taris, T. W. (2008). Work engagement: an emerging concept in occupational health psychology. Work Stress 22, 187–200. doi: 10.1080/02678370802393649
Bal, P. M., and De Lange, A. H. (2015). From flexibility human resource management to employee engagement and perceived job performance across the lifespan: a multisample study. J. Occup. Organ. Psychol. 88, 126–154. doi: 10.1111/joop.12082
Balducci, C., Fraccaroli, F., and Schaufeli, W. B. (2010). Psychometric properties of the Italian version of the Utrecht Work Engagement Scale (UWES-9): a cross-cultural analysis. Eur. J. Psychol. Assess. 26, 143–149. doi: 10.1027/1015-5759/a000020
Boomsma, A. (2000). Reporting analyses of covariance structures. Struct. Equ. Model. A Multidiscip. J. 7, 461–483. doi: 10.1207/S15328007SEM0703_6 Breevaart, K., Bakker, A. B., Demerouti, E., and Hetland, J. (2012). The
measurement of state work engagement: a multilevel factor analytic study. Eur. J. Psychol. Assess. 28, 305–312. doi: 10.1027/1015-5759/a000111
Byrne, B. M. (2016). Structural Equation Modeling with AMOS: Basic Concepts, Applications, and Programming, 3rd Edn. New York, NY Routledge. Byrne, Z. S. (2014). Understanding Employee Engagement: Theory, Research, and
Practice. New York, NY Routledge.
Cadime, I., Lima, S., Marques-Pinto, A., and Ribeiro, I. (2016). Measurement invariance of the utrecht work engagement scale for students: a study across secondary school pupils and university students. Eur. J. Dev. Psychol. 13, 254–263. doi: 10.1080/17405629.2016.1148595
Çapri, B., Gündüz, B., and Akbay, S. E. (2017). Utrecht Work Engagement Scale-Student Forms’ (UWES-SF): adaptation to Turkish, validity and reliability studies, and the mediator role of work engagement between academic procrastination and academic responsibility. Educ. Sci. Theory Pract. 17, 411–435. doi: 10.12738/estp.2017.2.0518
Chambel, M. J. (2012). Explaining nurses’ engagement and performance with social exchange with hospital. Cienc. Trab. 14, 81–88.
Chambel, M. J. (ed.). (2016). Psicologia da Saúde Ocupacional. Lisboa: Pactor. Chaudhary, R., Rangnekar, S., and Barua, M. K. (2012). Psychometric evaluation of
utrecht work engagement scale in an Indian sample. Asia Pacific J. Manag. Res. Innov. 8, 343–350. doi: 10.1177/2319510X1200800314
Chaudhary, R., Rangnekar, S., Tanlamai, U., Rajkulchai, S., and Asawasakulsor, A. (2018). Work Engagement in India and Thailand: a comparative analysis. Glob. Bus. Rev. 19, 162–174. doi: 10.1177/0972150917713286
Chen, F. F., Sousa, K. H., and West, S. G. (2005). Teacher’s corner: testing measurement invariance of second-order factor models. Struct. Equ. Model. A Multidiscip. J. 12, 471–492. doi: 10.1207/s15328007sem1203_7
Cheung, G. W., and Rensvold, R. B. (2002). Evaluating goodness-of-fit indexes for testing measurement invariance. Struct. Equ. Model. A Multidiscip. J. 9, 233–255. doi: 10.1207/S15328007SEM0902_5
Christian, M. S., Garza, A. S., and Slaughter, J. E. (2011). Work engagement: a quantitative review and test of its relations with task and contextual performance. Pers. Psychol. 64, 89–136. doi: 10.1111/j.1744-6570.2010. 01203.x
Christian, M. S., and Slaughter, J. E. (2007). Work engagement: a meta-analytic review and directions for research in an emerging area. Acad. Manag. Proc. 2007, 1–6. doi: 10.5465/AMBPP.2007.26536346
Chughtai, A. A., and Buckley, F. (2013). Exploring the impact of trust on research scientists’ work engagement. Pers. Rev. 42, 396–421. doi: 10.1108/PR-06-2011-0097
Dana, R. H. (2000). “An assessment-intervention for research and practice with multicultural populations,” in Handbook of Cross-Cultural and Multicultural
Personality Assessment, ed R. H. Dana (Mahwah, NJ: Lawrence Erlbaum Associates), 5–16.
Davidov, E., Meuleman, B., Cieciuch, J., Schmidt, P., and Billiet, J. (2014). Measurement equivalence in cross-national research. Annu. Rev. Sociol. 40, 55–75. doi: 10.1146/annurev-soc-071913-043137
De Beer, L. T., Rothmann, S., and Mostert, K. (2016). The bidirectional relationship between person-job fit and work engagement: a three-wave study. J. Pers. Psychol. 15, 4–14. doi: 10.1027/1866-5888/a000143
de Bruin, G. P., and Henn, C. M. (2013). Dimensionality of the 9-item Utrecht Work Engagement Scale (UWES-9). Psychol. Rep. 112, 788–799. doi: 10.2466/01.03.PR0.112.3.788-799
de Camargo, J. A., Liboni, L. B., and de Oliveira, J. H. C. (2015). Gestão ambiental de recursos humanos e nível de envolvimento de colaboradores nas organizações. Rev. Adm. Mackenzie 16, 72–91. doi: 10.1590/1678-69712015/administracao.v16n2p72-91
Direção-Geral da saúde, I. (2013). Programa Nacional de Saúde Ocupacional: 2o ciclo - 2013/2017. Lisboa. Available online at: https://www.dgs.pt/saude-ocupacional/programa-nacional4.aspx
Dollard, M. F., Shimazu, A., Bin Nordin, R., Brough, P., and Tuckey, M. R. (eds.). (2014). Psychosocial Factors at Work in the Asia Pacific. Dordrecht: Springer.
Dunkerley, D. (2013). Occupations and Society. Abingdon, OX: Routledge. Eman-Nafa, A. (2016). Psychometrics of Arabic version of the UWES-9. Int. J.
Appl. Innov. Eng. Manag. 5, 191–196.
European Agency for Safety and Health at Work (2016). Safer and Healthier Work at Any Age: Review of Resources for Workplaces. Bilbao: European Agency for Safety and Health at Work.
Extremera, N., Sánchez-García, M., Durán, M. A., and Rey, L. (2012). Examining the psychometric properties of the utrecht work engagement scale in two Spanish multi-occupational samples. Int. J. Sel. Assess. 20, 105–110. doi: 10.1111/j.1468-2389.2012.00583.x
Federici, R. A., and Skaalvik, E. M. (2011). Principal self-efficacy and work engagement: assessing a Norwegian principal self-efficacy scale. Soc. Psychol. Educ. 14, 575–600. doi: 10.1007/s11218-011-9160-4
Finney, S. J., and DiStefano, C. (2013). “Non-normal and categorical data in structural equation modeling,” in Structural Equation Modeling: A Second Course, eds G. R. Hancock and R. O. Mueller (Charlotte, NC: Information Age Publishing), 439–492.
Flores Jiménez, C., Fernández Arata, M., Juárez García, A., Merino Soto, C., and Guimet Castro, M. (2015). Work engagement: a validity study in teaching professionals from Lima, Peru. Lib. Rev. Psicol. 21, 195–206.
Fong, T. C., and Ho, R. T. (2015). Dimensionality of the 9-item utrecht work engagement scale revisited: a Bayesian structural equation modeling approach. J. Occup. Health 57, 353–358. doi: 10.1539/joh.15-0057-OA
Fong, T. C., and Ng, S. (2012). Measuring engagement at work: validation of the Chinese version of the Utrecht Work Engagement Scale. Int. J. Behav. Med. 19, 391–397. doi: 10.1007/s12529-011-9173-6
Fornell, C., and Larcker, D. F. (1981). Evaluating structural equation models with unobservable variables and measurement error. J. Mark. Res. 18, 39–50. doi: 10.2307/3151312
Fuller, R., and Shikaloff, N. (2017). Being Engaged at Work is Not the Same as Being Productive. Harvard Business Review, 2–5. Available online at: https://hbr.org/ 2017/02/being-engaged-at-work-is-not-the-same-as-being-productive Gilchrist, R. M., Villalobos, C. E. P., and Fernández, L. R. (2013). Factorial structure
and internal consistency of the Utrecht Work Engagement Scale (Uwes) 17 among health workers of Chile. Liberabit 19, 163–171.
Graffigna, G. (2017). Is a transdisciplinary theory of engagement in organized settings possible? A concept analysis of the literature on employee engagement, consumer engagement and patient engagement. Front. Psychol. 8:872. doi: 10.3389/FPSYG.2017.00872
Hair, J. F., Black, W. C., Babin, B. J., and Anderson, R. E. (2009). Multivariate Data Analysis. 7th Edn. Upper Saddle River, NJ: Prentice Hall.
Hakanen, J. J., Schaufeli, W. B., and Ahola, K. (2008). The job demands-resources model: a three-year cross-lagged study of burnout, depression,
commitment, and work engagement. Work Stress 22, 224–241.
doi: 10.1080/02678370802379432
Hallberg, U. E., and Schaufeli, W. B. (2006). “Same same” but different? Eur. Psychol. 11, 119–127. doi: 10.1027/1016-9040.11.2.119