Research Article
Advanced Glycation End Products
Evolution after Pancreas-Kidney Transplantation:
Plasmatic and Cutaneous Assessments
La Salete Martins,
1,2,3José C. Oliveira,
4José Ramón Vizcaíno,
2,5Isabel Fonseca,
1,2Carlos Gouveia,
5Donzília Silva,
3,6António C. Henriques,
1,2,3Irene L. Noronha,
7and Anabela Rodrigues
1,21Nephrology Department, Hospital Santo Ant´onio, Centro Hospitalar do Porto, Porto, Portugal
2Unit for Multidisciplinary Research in Biomedicine, Institute of Biomedical Sciences Abel Salazar and
University Hospital de Santo Ant´onio, University of Porto, Porto, Portugal
3Transplantation Department, Hospital Santo Ant´onio, Centro Hospitalar do Porto, Porto, Portugal
4Clinical Pathology Department, Hospital Santo Ant´onio, Centro Hospitalar do Porto, Porto, Portugal
5Surgical Pathology Department, Hospital Santo Ant´onio, Centro Hospitalar do Porto, Porto, Portugal
6Surgery Department, Hospital Santo Ant´onio, Centro Hospitalar do Porto, Porto, Portugal
7Cellular and Molecular Nephrology Laboratory, Division of Nephrology, University of S˜ao Paulo, S˜ao Paulo, Brazil
Correspondence should be addressed to La Salete Martins; [email protected] Received 2 July 2015; Revised 11 October 2015; Accepted 10 November 2015 Academic Editor: Vincent Pialoux
Copyright © 2016 La Salete Martins et al. This is an open access article distributed under the Creative Commons Attribution License, which permits unrestricted use, distribution, and reproduction in any medium, provided the original work is properly cited.
Diabetes mellitus leads to increased Advanced Glycation End Products (AGE) production, which has been associated with secondary diabetic complications. Type 1 diabetic patients undergoing pancreas-kidney transplantation (SPKT) can restore normoglycemia and renal function, eventually decreasing AGE accumulation. We aimed to prospectively study AGE evolution after SPKT. Circulating AGE were assessed in 20 patients, at time 0 (T0), 3 months (T3), 6 months (T6), and 12 months (T12) after successful SPKT. Global AGE and carboxymethyllysine (CML) were analyzed, as well as advanced oxidation protein products (AOPP). Skin biopsies were obtained at T0 and T12. Immunohistochemistry with anti-AGE antibody evaluated skin AGE deposition. AGE mean values were16.8±6.4 𝜇g/mL at T0; 17.1±3.8 𝜇g/mL at T3; 17.5±5.6 𝜇g/mL at T6; and 16.0±5.2 𝜇g/mL at T12. CML mean values were0.94±0.36 ng/mL at T0; 1.11±0.48 ng/mL at T3; 0.99±0.42 ng/mL at T6; and 0.78±0.38 ng/mL at T12. AOPP mean values were130.1 ± 76.8 𝜇Mol/L at T0; 137.3 ± 110.6 𝜇Mol/L at T3; 116.4 ± 51.2 𝜇Mol/L at T6; and 106.4 ± 57.9 𝜇Mol/L at T12. CML variation was significant (𝑃 = 0.022); AOPP variation was nearly significant (𝑃 = 0.076). Skin biopsies evolved mostly from a cytoplasmic diffuse to a peripheral interkeratinocytic immunoreaction pattern; in 7 cases, a reduction in AGE immunoreaction intensity was evident at T12. In conclusion, glycoxidation markers decrease, plasmatic and on tissues, may start early after SPKT. Studies with prolonged follow-up may confirm these data.
1. Introduction
Patients with diabetes mellitus (DM) have increased produc-tion of AGE, the Advanced Glycaproduc-tion End Products [1, 2]. AGE accumulation is only one of the proposed mechanisms for cell and tissue injury in diabetes [3]. There are other possible described mechanisms, such as increased sorbitol
formation through the polyol pathway [2, 4], increased protein-kinase C activation [1, 2, 5], and the hexosamine pathway [2]. However, AGE have been the most investigated and may play a central role [1].
AGE are a group of heterogeneous compounds that rep-resent the ultimate product of multiple reactions occurring in several conditions, namely, in the chronic hyperglycemic
Volume 2016, Article ID 2189582, 11 pages http://dx.doi.org/10.1155/2016/2189582
state of DM. Nonenzymatic glycation begins with interaction and link between the carbonyl group of a reducing sugar and an aminoterminal group of a protein [1, 3]. Complex rear-rangements result in early AGE forms, called Amadori prod-ucts (HbA1c is one of such); progressively they result in more stable AGE precursors (like methylglyoxal) [6] and lately in irreversible long-lasting glycoxidation of the proteins, such as carboxymethyllysine (CML), carboxyethyllysine (CEL), and pentosidine (an AGE with autofluorescent properties) [1, 3, 6]. This process may affect not only proteins (plasma and tissue proteins, such as collagen), but also lipids and nucleic acids [1, 7], then being a measure of overall metabolic and oxidative stress [1, 3]. AGE formation, lipoxidation, and reac-tive oxygen species (ROS) generation can activate inflamma-tion with consequent tissue damage [3].
Studies did correlate plasmatic and tissue AGE levels to the main micro- and macrovascular complications of DM [1, 3]. AGE formation and deposition have been deeply searched in type 2 (DM2) and type 1 diabetes (DM1), with more recent focus directed to therapeutic possibilities. AGE receptors (RAGE) antagonists [8–11] and other potential targets, possi-bly preventing AGE formation [1, 2, 7, 9] or promoting AGE degradation and removal [3, 9, 10], are still under investiga-tion.
DM1 patients submitted to simultaneous pancreas-kidney transplantation (SPKT) can restore normoglycemia and renal function, which are two concurrent ways to decrease AGE deposition: reducing AGE formation and increasing their renal elimination. Data on AGE levels after successful SPKT are very scarce. One might aspire that AGE stabilization, or even removal, can be achieved once uremia and hyperglycemia are reverted. However, presuming that it is possible, still the dynamic back-process is not known.
With this study we aimed to collect data on AGE evolu-tion after SPKT. For this purpose, we prospectively measured AGE in the plasma and in skin biopsies, in a group of SPKT patients during the first year after the procedure. The overall protein oxidation has also been assessed, through a test measuring advanced oxidation protein products (AOPP) plasmatic levels.
2. Research Design and Methods
2.1. Patients. Consecutive patients undergoing SPKT at our
center between 23/January/2012 and 6/July/2013, with suc-cessful SPKT, who gave their informed consent were enrolled in this study (only one patient excluded, due to pancreas graft thrombosis). Twenty SPKT patients were included for mea-surement of plasmatic AGE levels; in 15 of these, skin biopsies were obtained to perform the histological and immunohisto-chemistry analysis of epidermal and dermal AGE deposition. SPKT was performed with systemic-enteric diversion. Immunosuppression comprised antithymocyte globulin, tacrolimus, mycophenolate, and steroids. Steroid withdrawal after the sixth month is a general practice in our unit, if immunological events are not observed. At last follow-up, steroids were totally withdrawn in 30% of the patients; all the others, except one, were taking≤5 mg/day of prednisone.
2.2. Sample Collection. AGE were prospectively analyzed in
skin deposits and in plasma in these SPKT, from time 0 (the day of the transplant, or T0) to 12 months (T12) after the pro-cedure. T0 values (date of transplantation) obtained for each studied marker were considered their basal (reference) levels. Blood samples were collected in evacuated tubes without additive at T0 and thereafter at 3 months (T3), 6 months (T6), and T12 after the transplant. The first skin biopsy was obtained at T0, during the kidney transplantation surgery; the second one was obtained through a 5 mm skin punch at T12, from the left abdominal wall, 2-3 cm below the scar of the surgical incision used to perform the kidney transplantation. The lower abdominal wall is a part of the body with low chronic UV-exposure and the local of the two biopsies was very close.
Samples (blood and tissue) collection was delayed at least one week for T3 samples; two weeks for T6 samples; or 2– 4 weeks for T12 samples, whenever there was an infection and/or transient mild graft dysfunction.
Besides AGE evaluation, in the 4 blood samples collected from each patient, we also analyzed fasting blood glucose, glycated hemoglobin (HbA1c), total cholesterol, triglycerides, low-density lipoprotein-cholesterol (LDL-c), high-density lipoprotein-cholesterol (HDL-c), and C-reactive protein (CRP). Additionally, 24-hour urinary protein excretion was measured on T12, and estimated-glomerular filtration rate (e-GFR) was calculated based on MDRD equation. Blood pressure was recorded in each visit. Hypertension (>130/85 mmHg), hypertriglyceridemia (>150 mg/dL), hyper-cholesterolemia (>200 mg/dL), high LDL-c (>130 mg/dL), and low HDL-c (<40 in men, <50 mg/dL in women) were defined according to the National Cholesterol Educational Program (NCEP/ATPIII) criteria for metabolic syndrome.
Skin samples from healthy subjects have been provided by the Pathology Department of Santo Antonio Hospital, Porto, from its archive. These were obtained from margins of biop-sies made to analyze skin lesions of the dorsal or abdominal wall, which were of benign origin (nevus). Healthy skin from 6 nondiabetic subjects aging between 30 and 45 years was then used as control samples, to assess AGE deposition in the absence of diabetes and within this age range.
2.3. Biochemical Studies. Blood samples were centrifuged
without delay and the serum was aliquoted and stored frozen at−80∘C, until analysis.
Global plasmatic Advanced Glycation End Products (AGE) were evaluated using a competitive ELISA-Kit, OxiS-elect AGE (STA-817, Cell Biolabs, Inc., San Diego, CA). NL–(Carboxymethyl) lysine (CML), a specific AGE, was evaluated using a competitive ELISA-Kit, OxiSelect CML (STA-816, Cell Biolabs, Inc., San Diego, CA). Oxidative state was evaluated with a colorimetric kit for the detection of Advanced Oxidation Protein Products, OxiSelect AOPP (STA-318, Cell Biolabs, Inc., San Diego, CA). Biochemical analyses were performed according to manufacturer’s indi-cations for each assay.
2.4. Skin Histological/Immunohistochemistry Studies. After
buffered formalin for 24 h and embedded in paraffin wax. Serial 3𝜇m cuts were obtained from each block. These sec-tions were stained with hematoxylin-eosin and others used to analyze AGE deposition, through immunohistochemistry assay. After deparaffinization and rehydration, these sections were incubated with the primary polyclonal IgG antibody anti-AGE (ab23722, Abcam, Cambridge, UK) diluted 1 : 5000, for 20 minutes at room temperature, according to the manu-facturer’s instructions. Immunohistochemistry protocol from Ventana Benchmark Ultra (Ventana Medical Systems, Inc., Roche) has been followed, using detection system Optiview DAB, IHC Detection Kit. Sections were counterstained with hematoxylin and then dehydrated and coverslipped under DPX mountant.
A semiquantitative AGE assessment was made based on its immunoreaction intensity and graded on a scale from 0 (absent) to 1+ (weakly positive), 2+ (moderately positive), or 3+ (strongly positive). All the samples were analyzed by the same pathologist, in two different occasions, and this was a blind analysis: characteristics of patients and the timing of biopsy were not known by the pathologist before observation.
2.5. Statistical Analysis. Variables distribution was studied by
Kolmogorov-Smirnov test. Results are presented as mean± standard deviation for continuous, normally distributed vari-ables, or as medians and 95% confidence interval for non-normal distribution variables (e.g., AOPP). Percentages were used for categorical data. A repeated measures ANOVA was used to compare AOPP, AGE, and CML between time points. Multiple comparisons were adjusted using Bonferroni’s test. The effect of potential confounding variables, such as age, gender, previous time on dialysis, diabetes time, dyslipidemia, HbA1c, and creatinine clearance, was then analyzed on longitudinal changes of the three markers also using repeated measures ANOVA.
Statistical analysis was performed using SPSS software version 22.0 (SPSS, Chicago, IL, USA) and𝑃 < 0.05 was considered statistically significant.
3. Results
3.1. Demographic and Clinical Patients’ Characteristics.
Base-line and post-SPKT patients’ characteristics are presented in Table 1. Their age at transplantation date ranged from 28 to 47 (mean 36.7) years; their time on dialysis from 2 to 40 (mean 18) months; and their diabetes evolution time from 17 to 33 (mean 26) years. Excessive weight was not observed in this sample of DM1 patients; 20% were active smokers before SPKT; very poor glycemic control was evident in 35%, who presented HbA1c≥9% (≥74.9 mmol/mol). Three patients needed reoperation (due to infection, bleeding, and partial pancreatic venous thrombosis, one each) and 3 had an early acute rejection, efficiently treated. All of these patients have kept both grafts functioning during the study follow-up. After SPKT, graft function remained stable. The rate of actively smoking patients has decreased (5%). Hyperlipi-demia and hypertension prevalence was low: the percentage of patients taking antihypertensive medication or statins was 15% and 5%, respectively. Mean BMI before and after SPKT
Table 1: Patients’ demographic and clinical characteristics. Total group (𝑛 = 20)
Before SPKT
Age (years) 36.7± 5.4
Female gender 11 (55%)
Time of diabetes (years) 26.0± 5.3
Time on dialysis (months) 18± 11
HbA1c (%) 8.29± 1.61
(HbA1c – mmol/mol) 67.1± 17.1
HbA1c≥9% (≥74.9 mmol/mol) 7 (35%)
Fasting glucose (mg/dL) 304± 129
Active smoking (𝑛/%) 4 (20%)
Body mass index (BMI) (kg/m2) 22.4± 2.6
BMI>25 kg/m2 (𝑛/%) 0 (0%) Hypertension (>130/85 mmHg) (𝑛/%) 13 (65%) After SPKT (12 months) HbA1c (%) 5.34± 0.31 (HbA1c – mmol/mol) 34.9± 3.4 HbA1c≥6% (≥42.1 mmol/mol) 0 (0%) Fasting glucose (mg/dL) 83± 9 e-GFR∗(mL/min/1.73 m2) 77.5± 15.5
Urinary protein excretion (g/24 h) 0.071± 0.093
Active smoking (𝑛/%) 1 (5%) BMI (kg/m2) 22.4± 2.5 BMI>25 kg/m2(𝑛/%) 2 (10%) Taking aspirin (𝑛/%) 19 (95%) Hypercholesterolemia (>200 mg/dL) (𝑛/%) 1 (5%) Hypertriglyceridemia (>150 mg/dL) (𝑛/%) 2 (10%) Low HDL-c∗∗(𝑛/%) 2 (10%) High LDL-c (𝑛/%) 0 (0%) Taking statins (𝑛/%) 1 (5%) Hypertension (𝑛/%) 6 (30%) Taking ACEI (𝑛/%) 3 (15%) C-reactive protein (CRP) (mg/L) 1.58± 1.05 CRP>5 (mg/L) 0 (0%)
∗e-GFR: estimated glomerular filtration rate (MDRD calculation).
∗∗Low HDL-cholesterol defined as<40 mg/dL in men and <50 mg/dL in
women.
ACEI: angiotensin converting enzyme inhibitors.
was similar, although we have noted weight gain in 9 and weight loss in other 8 patients. Two patients had a BMI >25 kg/m2 at T12. These patients had stable graft function
and favorable lipid profile evolutions after SPKT (shown in Table 2).
3.2. AGE, CML, and AOPP Plasmatic Levels after SPKT. AGE,
CML, and AOPP results during the first year, at different 4 time points, are represented in Figures 1(a), 1(b), and 1(c), respectively.
An increase in the mean values of AGE, CML, and AOPP was registered from T0 to T3. AGE levels have also increased from T3 to T6, a fact not observed for CML and AOPP, for which the decrease started after the 3rd month.
T a ble 2: P at ien ts ’gra ft fu nc ti o n an d li p id p ro file ev o lu tio n d ur in g the fir st ye ar . Pts Cr ea t T3 Cr ea t T6 Cr ea t T12 GFR T3 GFR T6 GFR T12 Gl uc T0 Gl uc T3 Gl uc T6 Gl uc T12 HbA1c T0 HbA1c T3 HbA1c T6 HbA1c T12 Ch o l T0 Ch o l T3 Ch o l T6 Ch o l T12 TG T0 TG T3 TG T6 TG T12 LD L -c T12 HD L -c T12 CRP T12 n =1 0.95 1.0 0 1.1 7 71 67 6 4 4 69 78 72 75 10/85.8 5.5/3 6 .6 5.3/3 4 .4 5.1/3 2.2 13 6 212 158 17 0 22 9 84 13 0 91 95 55 1.4 n =2 1.3 3 1.2 4 1.18 65 69 72 26 8 78 89 81 6 .8/5 0.8 5.6/3 7. 7 5.4/35.5 5.4/35.5 16 1 14 1 15 6 17 6 10 0 91 81 67 86 75 1.6 n =3 0.9 2 0.8 5 0.9 6 10 3 107 10 4 24 6 76 82 79 7. 4/57 .4 5.4/35.5 5.2/3 3.3 4 .9/3 0.1 186 110 112 14 7 20 3 78 82 59 84 61 1.2 n =4 1.4 0 1.35 1.45 59 61 58 16 9 87 85 85 6 .5/47 .5 5.3/3 4.4 5.2/3 3.3 5.1/3 2.2 97 126 151 122 77 108 83 98 58 57 2.6 n =5 1.05 1.0 2 0.9 3 88 91 95 31 5 91 9 0 88 8.5/6 9. 4 5.4/35.5 5.3/3 4.4 5.1/3 2.2 80 101 113 97 9 6 39 27 20 16 67 3.3 n =6 1.0 9 1.0 4 1.0 2 6 4 67 6 8 34 5 72 84 79 11/9 6 .7 5.3/3 4 .4 5.6/3 7.7 5.3/3 4 .4 23 0 226 212 207 15 5 9 9 76 84 115 58 2.1 n =7 0.7 5 0.81 0.8 5 88 85 83 21 7 69 71 6 4 9.8/8 3.6 6 .1/4 3.2 5.5/3 6.6 5.5/3 6.6 16 8 14 7 13 9 15 5 151 12 7 88 59 70 70 1 n =8 1.2 7 1.05 1.3 0 58 6 6 57 4 82 88 77 9 0 7.3/5 6.3 5.8/3 9. 9 6 .0/4 2.1 5.9/41.0 19 0 188 17 7 158 14 0 78 98 76 79 6 4 2.5 n =9 1.13 0.95 0.9 3 59 71 74 110 86 82 81 6 .7/4 9.7 5.4/35.5 5.2/3 3.3 5.2/3 3.3 19 2 213 27 1 19 2 26 3 25 5 245 158 12 0 4 0 1.2 n =1 0 0.8 4 1.01 0.9 0 89 76 87 16 2 79 81 73 10/8 5.8 4.9/3 0 .1 5.4/35.5 5.3/3 4.4 13 9 18 3 20 2 17 2 19 1 229 14 6 9 6 86 76 1.3 n =1 1 0.9 1 1.01 0.95 81 72 77 18 9 77 71 88 8.2/6 6.1 5.6/3 7. 7 5.1/3 2.2 5.2/3 3.3 17 1 17 6 18 3 181 141 10 6 89 65 111 65 0.7 n =1 2 0.7 5 0.80 0.6 5 91 88 110 27 7 9 0 86 84 6.1/4 3.2 6.0/4 2.1 5.7/3 8.8 5.4/35.5 14 6 215 19 3 188 10 4 118 97 72 9 9 6 7 1.5 n =1 3 1.9 0 1.80 1.3 6 36 39 51 52 3 10 0 10 4 9 6 7.2/5 5.2 6 .3/45.4 6 .2/4 4.3 5.9/41.0 19 0 188 18 5 18 9 32 2 26 5 13 1 13 6 94 57 0.9 n =1 4 1.3 7 1.3 9 1.29 6 6 65 70 116 83 80 69 8.0/6 3.9 5.4/35.5 5.2/3 3.3 5.0/3 1.1 195 18 6 179 16 0 10 6 107 9 9 69 71 79 0 .7 n =1 5 1.2 7 1.2 4 1.20 70 73 76 4 87 91 93 92 9.3/7 8.1 6 .2/4 4.3 5.9/41.0 5.7/3 8.8 17 1 11 7 122 14 8 10 0 9 6 92 87 76 55 0 .7 n =1 6 1.3 8 1.3 0 1.3 0 6 4 69 69 4 0 5 98 86 87 6 .7/4 9.7 6.4/4 6.4 6 .3/45.4 5.8/3 9. 9 15 2 14 9 14 4 13 7 113 10 6 95 91 59 6 0 1.1 n =1 7 0.85 0.88 1.0 9 87 85 82 27 9 84 75 101 9.7/8 2.5 6.1/4 3.2 5.5/3 6.6 5.6/3 7. 7 181 129 13 7 13 9 18 3 56 62 6 6 77 52 0.7 n =1 8 0.8 6 1.0 9 0.9 9 110 95 97 4 05 79 10 0 91 11/9 6 .7 6.4/4 6.4 6 .2/4 4.3 5.1/3 2.2 13 8 188 221 16 1 79 13 6 14 5 14 9 10 0 24 1.5 n =1 9 0.9 0 0.8 9 0.95 79 79 76 212 63 72 75 6 .6/4 8.6 5.2/3 3.3 5.3/3 4.4 5.0/3 1.1 151 22 5 17 5 19 3 107 111 115 74 12 3 55 0 .7 n =2 0 1.13 1.2 5 1.16 84 77 79 39 8 10 0 86 88 8.6/7 0 .5 5.7/3 8.8 5.4/35.5 5.3/3 4.4 13 4 20 2 19 6 188 13 4 17 2 16 8 15 6 113 52 4.8 Me an Me an Me an Me an Me an Me an Me an Me an Me an Me an Me an Me an Me an Me an Me an Me an Me an Me an Me an Me an Me an Me an Me an Me an Me an 1.10 1.10 1.08 76 75 78 30 4 83 83 83 8.3/67 .2 5.7/3 8.8 5.6/3 7.7 5.3/3 4 .4 16 0 17 1 17 1 16 4 15 0 12 3 107 89 87 59 1.6 SD SD SD SD SD SD SD SD SD SD SD SD SD SD SD SD SD SD SD SD SD SD SD SD SD 0.29 0.2 4 0.20 18 14 16 129 10 9 9 1.6/1 7. 5 0 .4 4/4.6 0 .3 8/4.2 0 .3 0/3.3 35 4 0 4 0 27 65 62 4 6 36 25 13 1.0 Cr ea t: se ru m cr ea tinine (m g/ d L); GFR: e-GFR (mL/min/1.7 3 m 2 ,M D R D ca lc u la tio n); Gl uc: fastin g gl ucos e (m g/ d L); HbA1c: gl yc at ed hemog lob in (% /mmo l/mo l); C h o lT :t o ta lc ho lest er o l(m g/ dL); T G :t ri gl yc er ides (m g/ dL); LD L -c: lo w-den si ty li p o p ro tein-cho lest er o l(m g/ dL); HD L -c: hig h -den si ty li p o p ro tein-cho lest er o l(m g/ dL); CRP: C -r ea ct iv e p ro tein (m g/L); Pts: pa tien ts; SD: st an da rd de via tio n; T0: time 0 ;T 3: 3 m o n th s; T6: 6 mo n th s; T 12: 12 m o n th s.
3 6 12 0 Time (months) 0 10 20 30 Error bars:±2 SD (P = 0.743) Me an AG E (𝜇 g/mL) (a) Time (months) Error bars:±2 SD (P = 0.022) 3 6 12 0 0.0 0.5 1.0 1.5 2.0 2.5 M ea n CML (n g/mL) (b) Error bars: 95% CI 0 50 100 150 200 3 6 12 0 Time (months) (P = 0.076) M edia n A O PP ( 𝜇 mo l/L) (c)
Figure 1: (a) AGE variation from time 0 (T0) to time 12 (T12). (b) CML variation from time 0 (T0) to time 12 (T12). (c) AOPP variation from time 0 (T0) to time 12 (T12).
From T6 to T12, all the 3 markers have decreased, reaching levels below those registered before transplantation. AGE mean values were16.8 ± 6.4 𝜇g/mL at T0; 17.1 ± 3.8 𝜇g/mL at T3; 17.5 ± 5.6 𝜇g/mL at T6; and 16.0 ± 5.2 𝜇g/mL at T12 measurements. These variations did not reach statistical significance. CML mean values were0.94 ± 0.36 ng/mL at T0; 1.11 ± 0.48 ng/mL at T3; 0.99 ± 0.42 ng/mL at T6; and0.78 ± 0.38 ng/mL at T12 measurements. The observed variation from T0 to T12 was statistically significant (𝑃 = 0.022). AOPP mean values were 130.1 ± 76.8 𝜇Mol/L at T0; 137.3 ± 110.6 𝜇Mol/L at T3; 116.4 ± 51.2 𝜇Mol/L at T6; and 106.4 ± 57.9 𝜇Mol/L at T12 measurements. AOPP variation was almost statistically significant (𝑃 = 0.076).
Diabetes duration and age at transplantation date did not significantly correlate with T0 and T12 AGE, CML, or AOPP levels. Time on dialysis was the single factor with nearly significant positive correlation with CML values (𝑃 = 0.071). Poor glycemic control before transplantation (fasting glucose and HbA1c), as well as hypertension, also did not influence
the values of these 3 markers. Additionally, we could not find any association between T12 HbA1c and T12 values of the 3 markers. The number of patients with active smoking (𝑛 = 1), not taking aspirin (𝑛 = 1), taking ACEI (𝑛 = 3), or with any marker of dyslipidemia (𝑛 = 4) on T12 was too small to study their correlation with AGE, CML, or AOPP at T12.
3.3. AGE Skin Deposits from T0 to T12 after SPKT. On
histological skin examination we verified that the AGE immunostaining was invariably negative in some specific cells/areas: the outer epidermal layer (stratum corneum), the erector pili muscle, and the eccrine sweat glands. In other cells/areas, immunoreaction for AGE was invariably positive, such as fat cells, vascular endothelial cells, dermal collagen fibers (on superficial dermis 2+/3+, on deeper dermis 3+), and perivascular collagen. The other layers of the epidermis (granular, spinous, and basal) and the hair follicle presented several distinct AGE immunostain patterns and intensity. Hair follicle layers, whenever hair follicle was present in
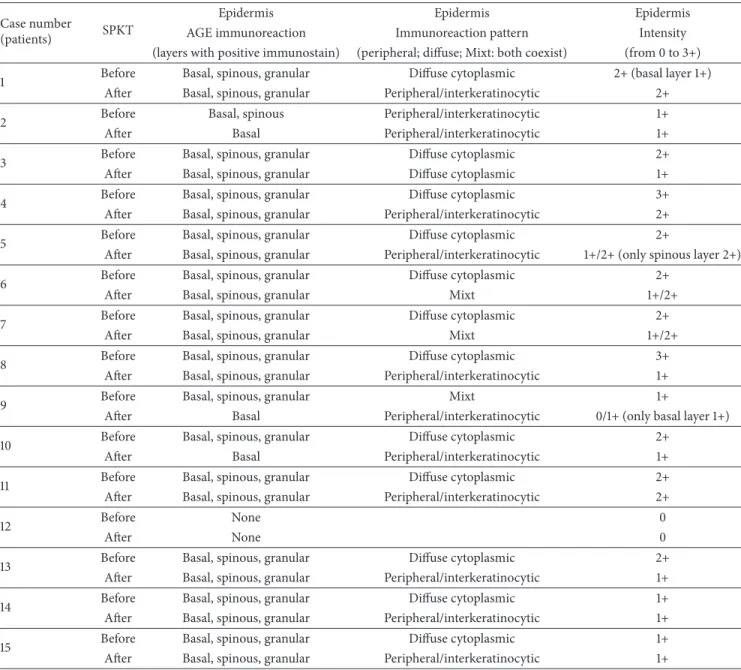
Table 3: Skin biopsies: AGE immunoreaction pattern and intensity before and after SPKT. Case number
(patients) SPKT
Epidermis Epidermis Epidermis
AGE immunoreaction Immunoreaction pattern Intensity
(layers with positive immunostain) (peripheral; diffuse; Mixt: both coexist) (from 0 to 3+)
1 Before Basal, spinous, granular Diffuse cytoplasmic 2+ (basal layer 1+)
After Basal, spinous, granular Peripheral/interkeratinocytic 2+
2 Before Basal, spinous Peripheral/interkeratinocytic 1+
After Basal Peripheral/interkeratinocytic 1+
3 Before Basal, spinous, granular Diffuse cytoplasmic 2+
After Basal, spinous, granular Diffuse cytoplasmic 1+
4 Before Basal, spinous, granular Diffuse cytoplasmic 3+
After Basal, spinous, granular Peripheral/interkeratinocytic 2+
5 Before Basal, spinous, granular Diffuse cytoplasmic 2+
After Basal, spinous, granular Peripheral/interkeratinocytic 1+/2+ (only spinous layer 2+)
6 Before Basal, spinous, granular Diffuse cytoplasmic 2+
After Basal, spinous, granular Mixt 1+/2+
7 Before Basal, spinous, granular Diffuse cytoplasmic 2+
After Basal, spinous, granular Mixt 1+/2+
8 Before Basal, spinous, granular Diffuse cytoplasmic 3+
After Basal, spinous, granular Peripheral/interkeratinocytic 1+
9 Before Basal, spinous, granular Mixt 1+
After Basal Peripheral/interkeratinocytic 0/1+ (only basal layer 1+)
10 Before Basal, spinous, granular Diffuse cytoplasmic 2+
After Basal Peripheral/interkeratinocytic 1+
11 Before Basal, spinous, granular Diffuse cytoplasmic 2+
After Basal, spinous, granular Peripheral/interkeratinocytic 2+
12 Before None 0
After None 0
13 Before Basal, spinous, granular Diffuse cytoplasmic 2+
After Basal, spinous, granular Peripheral/interkeratinocytic 1+
14 Before Basal, spinous, granular Diffuse cytoplasmic 1+
After Basal, spinous, granular Peripheral/interkeratinocytic 1+
15 Before Basal, spinous, granular Diffuse cytoplasmic 1+
After Basal, spinous, granular Peripheral/interkeratinocytic 1+
the section, normally follow the same pattern and the inten-sity of the epidermal layers immunoreaction.
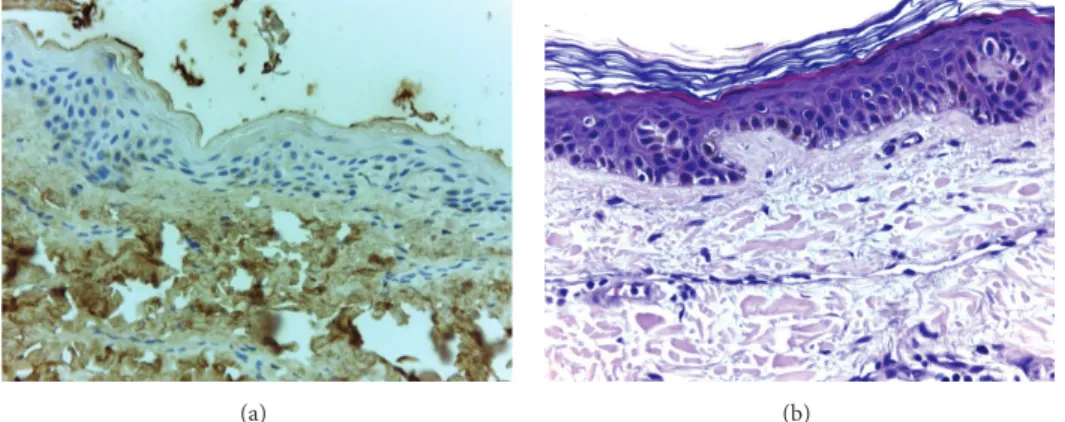
Table 3 explains the specific sites with positive immuno-reaction for AGE and the respective intensity. The most common finding, observed in 11 among the 15 cases, was a change from a cytoplasmic diffuse immunoreaction pattern on T0 to an interkeratinocytic pattern on T12, saving the central cytoplasmic area and only peripherally staining the cells, with an aspect usually described as “chicken wire” pattern. At least in 7 cases, we have also observed a decrease in the intensity of AGE immunoreaction one year after SPKT (from 3+ to 1+, or from 2+ to 1+). To illustrate these changes we present 4 cases in Figure 2, which exemplify the modifica-tions observed from pretransplant to one year later. On hematoxylin-eosin staining, no relevant changes were found in our study population; and, in young healthy controls,
epidermal AGE immunostaining was negative (as illustrated in Figure 3).
4. Discussion
Several studies did confirm the association between AGE accumulation and diabetic microvascular complications [1– 3, 6, 9], namely, retinopathy [12, 13], neuropathy [7, 14], and nephropathy [15, 16], and also macrovascular disease, such as cardiovascular (CV) [9, 17, 18] and peripheral artery disease [9, 19]. Additionally, it seems that AGE can be directly toxic to pancreatic beta-cells [6, 11]. Exogenous sources of AGE, from diet or smoking, are other contributors to their imbalance and accumulation [1, 3, 6]. AGE formation is not an exclusive mechanism of diabetes. Many other diseases may induce AGE overexpression, such as renal diseases evolving to renal
(a) (b)
(c) (d)
(e) (f)
(g) (h)
Figure 2: Epidermal immunostaining for AGE: patient 4 before (a) and after SKPT (b); patient 8 before (c) and after SKPT (d); patient 10 before (e) and after SKPT (f); patient 11 before (g) and after SKPT (h) (400x amplified, hematoxylin counterstained). Images showing the main immunostaining changes, from a diffuse cytoplasmic to an interkeratinocytic or peripheral pattern, often less intense, at time of 12 months.
(a) (b)
Figure 3: Image (a) represents a negative control for epidermal AGE immunostaining, from a young healthy individual. Irrelevant changes were found on hematoxylin-eosin staining in our patient population (exemplified on image (b)).
failure [1, 8], neoplasms [8], Alzheimer’s disease [1, 7, 8], arthritis [1, 8], and CV disease itself [1, 11]. Furthermore, even unspecific inflammation and aging promote AGE production [1, 7]. Since AGE depend on renal function for their excretion, chronic renal insufficiency also leads to AGE accumulation [1].
RAGE are activated by increased AGE exposure; they respond with overexpression and contribute to ROS for-mation and inflamfor-mation [1, 6, 8]. There are several AGE receptors, some of them with protective antioxidant effects, working to control excessive oxidative stress, whereas others, like RAGE, have prooxidant properties [6]. The search for efficient RAGE blockers is still ongoing.
SPKT treats two diseases, DM1 and end-stage renal disease, and is performed in young patients (most under 50 years of age). Therefore, this is certainly an interesting group of patients to study AGE evolution. Results from AGE levels are very difficult to interpret and there are not standardized methods of detection. Moreover, it remains unclear which AGE should be measured and where to obtain more reliable results, whether in plasma or in tissues [9, 20]. Plasma levels reflect AGE linked to proteins with higher turnover rate (circulating proteins); tissue levels probably reflect better those AGE linked to low turnover proteins such as collagen and, consequently, the tissue damage [20]. For this reason, stabilization or improvement of diabetic secondary compli-cations, thought to be associated with AGE formation and deposition, may eventually occur lately after SPKT [20]. This is the reversal face of the “metabolic memory” phenomenon observed in diabetic patients, a concept that came from the Diabetes Control and Complications Trial-Epidemiology of Diabetes Interventions and Complications (DCCT-EDIC) research: several studies demonstrated a slower progression of diabetic complications in the group of patients who have received intensive insulin treatment, a persistent benefit more than 10 years after the end of the treatment [21–23]. Established tissue lesions certainly are not easily and rapidly reverted, even under maintained normal glycemia and renal function, after successful SPKT [20].
The few studies in transplanted patients [24, 25], one of them comparing a small number of SPKT to kidney alone transplants, have not been able to demonstrate additional
benefits with the pancreas graft and euglycemia, besides the correction of renal failure with a kidney transplant. The authors could find a decrease in pentosidine plasma levels in kidney and pancreas-kidney transplants, but not in tissue pentosidine levels [25].
AGE measurement can in fact be made in plasma [26–30], in urine [26], or in tissues, skin being the most often used tissue [31, 32]. Among several compounds already studied, CML is the best characterized AGE [29] and the most consis-tently assessed one in plasma analysis [26–30]. Higher plas-matic CML levels correlated with higher thickening rate of the glomerular basement membrane [26], increased arterial stiffness [27], increased coronary artery calcification [28], and higher incidence of fatal and nonfatal CV events [30] in dia-betic patients; they even correlate with CV events in elderly nondiabetics subjects [33]. In studies performed in chronic kidney disease patients, AOPP plasmatic levels have also been associated with atherosclerotic events in the predialysis stage [34]. Additionally, it was demonstrated that these levels increase after dialysis [35] and AOPP have been proposed as a reliable marker of oxidant-mediated protein damage. AGE accumulation may be directly assessed in tissues, by immunohistochemistry methods [31, 32, 36], or extracted through acid hydrolysis and enzymatic digestion and then measured by biochemical assays [37]. High cutaneous AGE expression has been correlated with skin damage due to sun exposure [31] in nondiabetic patients. In diabetic patients, it has been correlated with dermal inflammation and denerva-tion [32] and with faster progression of microvascular [37] and macrovascular [36] disease.
These were the main reasons why, in our study, we decided to use the assays explained above. One assay was cho-sen to assess global plasma AGE levels, another one to specifi-cally assess CML levels, and AOPP assay to evaluate protein oxidation. With these 3 markers we can evaluate the overall oxidative status in these patients. Skin deposits were deter-mined by immunohistochemistry, a manner to evaluate tissue lesion and its progression after SPKT.
SPKT patients in our center are strongly encouraged to abolish smoking and to avoid nonhealthy food, exter-nal sources of AGE. Smoking habits in these transplanted patients were very rare: only 1 out of 20 remained as an active
smoker. Given that, the possible interference of smoking in AGE results in our study is very unlikely. The same assumption can be made regarding inflammation: CRP was almost always steadily low after the first months, data shown only for time of 12 months.
Our study group presented stable pancreas and kidney graft function. CV risk factors, such as hypertension and hyperlipidemia, were generally well controlled. Hypertension frequency decreased after SPKT, from 65% to 30%. Only 10% presented hypertriglyceridemia and 5% hypercholes-terolemia after SPKT. The rate of patients needing statins and ACEI was low. Statins [20] and ACEI have been proposed as potential preventers of AGE formation and accumulation [1, 9, 10], as well as aspirin [1, 7]. Per protocol, all of our SPKT are under aspirin after discharge. In this study group, all the patients but one were under aspirin. This homogeneity does not allow us to confirm or to exclude the contribution of these drugs (ACEI, statins, and aspirin) for the results. Still, based on all these facts, we have assumed that the changes observed in our study, regarding AGE, CML, and AOPP levels, may be attributed mainly to normoglycemia restoration and to renal function normalization.
What we observed was a transient increase in AGE, CML, and AOPP after SPKT, instead of an immediate decrease. However during this initial period after SPKT there are several well-known inflammatory/infectious insults, or even high-doses of new drugs, such as immunosuppressors, that may explain the initial increment of these markers. Major surgery, indwelled catheters, episodes of wound, and urinary, abdominal, or systemic infections, among other possible complications, all may contribute to an initial inflammatory state in SPKT patients. Inflammation usually leads to an increase in the oxidative processes. The decrease of the oxidative markers after the 3rd or after the 6th month, although statistically significant only for CML, has been an interesting finding. Once both the rapidity or the reversibility of glycoxidation and protein oxidation processes are not known in the short term after SPKT, we cannot say these were expected results; yet these were not totally surprising results. The limited sample size may also explain the lack of significance of markers’ variation.
The same interpretation can be made for skin results. Changes observed from T0 to T12 are in accordance with a reduction in epidermal AGE deposits. The dermal tissue lifetime is considerably longer than that of epidermal tissue. Our observation that the dermal fat cells and collagen fibers were invariably positive for AGE, irrespective of the timing of the biopsy, is consistent with this fact. For this reason our attention was focused on epidermal layers, with higher turnover. In the majority of patients we have observed a mod-ification from an initial diffuse cytoplasmic immunoreaction to an immunoreaction only at the periphery of the cells one year later. Besides this change in pattern, intensity has also decreased, clearly in 7 out of 15. Patient 12 did not present skin AGE deposition, as seen in Table 3. Immunochemistry was repeated and negativity confirmed. Among the other patients included, this patient had the second shortest time interval
between diabetes diagnosis and SPKT. Perhaps more impor-tantly, he had an insulin pump and a very good glycemic control: he presented the lowest HbA1c level (6.1%, as shown in Table 2) within our study population, at time of SPKT. It is certainly forced to make definitive conclusions based on data obtained from a single patient. However, the most reasonable explanation is that strict glycemic control protects diabetic patients from the accelerated glycosylation process. There are inherent limitations of this semiquantitative assessment from 0 to 3+; however, this is currently the most often used method to subjectively quantify the immunoreaction intensity in immunohistochemistry.
Certainly, it will be of interest to extend the follow-up of these patients and AGE measurements, in order to analyze their progressive evolution after SPKT, in those maintaining both grafts functioning. Reminding of the knowledge that emerged from several studies, which led to the “metabolic memory” concept, it is very unlikely that AGE reduction within a short time period after uremia and hyperglycemia reversion can produce significant and measurable cell injury improvements, such as relevant changes in neuropathy or vasculopathy parameters, traducing microvascular disease improvements. In the mid- and long-term we hope these improvements will be apparent and quantifiable.
C-reactive protein was the single inflammation marker analysed in this study, due to economic constraints. However, we are aware of other inflammatory factors potentially inter-fering with AGE production. Another future point of interest will be to find if AGE evolution will eventually correlate with other markers of inflammation. For instance, it is our aim to proceed to further studies, including markers such as inflammatory cytokines (IL-6, among others), as well as markers of vascular cell apoptosis and platelet activation.
Skin autofluorescence (SAF) measure is a promising non-invasive method to evaluate AGE deposition which correlated with AGE levels determined by biochemical analysis of skin biopsies [38]. In uremic patients under dialysis, data obtained on AGE levels through the AGE-Reader were associated with CV mortality [39]. Even in early stages of chronic renal disease, several studies could find a correlation between SAF and CV disease [20]. Additionally, in diabetic patients, data from SAF could be associated with vascular damage [40]. SAF reading needs, however, some adjustments that can affect the accuracy of the method. There are no standardized units; it has to be corrected to ethnic, age, and skin phototype characteristics, and it should be measured in the same part of the body in consecutive measurements, to avoid biases from different UV-exposure zones. Even so, when widely available and taking into account the necessary adjustments, this may be a practical method to measure AGE accumulation, also in SPKT patients.
We have not been able to find any factors clearly associ-ated with the variation of AGE, CML, and AOPP levels in our group of patients.
Based on our results, we can conclude that skin and plasmatic glycoxidation markers, in DM1 patients, may in fact start to decrease during the first year after SPKT. Further studies in a larger sample and with extended follow-up are needed to confirm these results.
Ethical Approval
This work was approved by the appropriate ethics committee. Therefore, it has been performed in accordance with the ethical standards laid down in the 1964 Declaration of Helsinki and its later amendments and in accordance with the Declaration of Istanbul.
Consent
Informed consent was obtained from all the participants.
Conflict of Interests
The authors of this paper have no conflict of interests to disclose regarding the publication of this paper. Informed consent was obtained from all the participants. This work was approved by the appropriate ethics committee. Therefore, it has been performed in accordance with the ethical standards laid down in the 1964 Declaration of Helsinki and its later amendments and in accordance with the Declaration of Istanbul.
Authors’ Contribution
La Salete Martins designed the study, performed research, analyzed data, contributed to discussion, and wrote the paper. Jos´e C. Oliveira and Jos´e Ram´on Vizca´ıno performed research, analyzed data, and contributed to discussion. Isabel Fonseca and Carlos Gouveia analyzed data and contributed to discussion. Ant´onio C. Henriques and Donz´ılia Silva contributed to discussion and interpretation of data. Anabela Rodrigues and Irene L. Noronha contributed to discussion and edited the paper. All the authors reviewed and approved the final version of the paper.
Acknowledgments
The authors thank all the patients who accepted to participate in the study. This could not have been done without their collaboration. They would like to thank their transplant team for the first skin biopsy collection and the nephrologists who helped in recruitment of patients; the required extra effort from laboratory technicians, especially Ana Catarina, who has immediately processed blood samples is acknowledged.
References
[1] A. Stirban, T. Gawlowski, and M. Roden, “Vascular effects of advanced glycation endproducts: clinical effects and molecular mechanisms,” Molecular Metabolism, vol. 3, no. 2, pp. 94–108, 2014.
[2] M. Brownlee, “The pathobiology of diabetic complications: a unifying mechanism,” Diabetes, vol. 54, no. 6, pp. 1615–1625, 2005.
[3] R. Meerwaldt, T. Links, C. Zeebregts, R. Tio, J.-L. Hillebrands, and A. Smit, “The clinical relevance of assessing advanced gly-cation endproducts accumulation in diabetes,” Cardiovascular
Diabetology, vol. 7, article 29, 2008.
[4] A. Del-Corso, F. Balestri, E. Di Bugno et al., “A new approach to control the enigmatic activity of aldose reductase,” PLoS ONE, vol. 8, no. 9, Article ID e74076, 2013.
[5] I. V. Kizub, K. I. Klymenko, and A. I. Soloviev, “Protein kinase C in enhanced vascular tone in diabetes mellitus,” International
Journal of Cardiology, vol. 174, no. 2, pp. 230–242, 2014.
[6] H. Vlassara and G. E. Striker, “Advanced glycation endproducts in diabetes and diabetic complications,” Endocrinology and
Metabolism Clinics of North America, vol. 42, no. 4, pp. 697–719,
2013.
[7] M. Jack and D. Wright, “Role of advanced glycation endprod-ucts and glyoxalase I in diabetic peripheral sensory neuropathy,”
Translational Research, vol. 159, no. 5, pp. 355–365, 2012.
[8] E. J. Lee and J. H. Park, “Receptor for Advanced Glycation Endproducts (RAGE), its ligands, and soluble RAGE: potential biomarkers for diagnosis and therapeutic targets for human renal diseases,” Genomics & Informatics, vol. 11, no. 4, pp. 224– 229, 2013.
[9] S.-Y. Goh and M. E. Cooper, “The role of advanced glycation end products in progression and complications of diabetes,” Journal
of Clinical Endocrinology and Metabolism, vol. 93, no. 4, pp.
1143–1152, 2008.
[10] C. G. Schalkwijk and T. Miyata, “Early- and advanced non-enzymatic glycation in diabetic vascular complications: the search for therapeutics,” Amino Acids, vol. 42, no. 4, pp. 1193– 1204, 2012.
[11] G. Daffu, C. H. del Pozo, K. M. O’Shea, R. Ananthakrishnan, R. Ramasamy, and A. M. Schmidt, “Radical roles for RAGE in the pathogenesis of oxidative stress in cardiovascular diseases and beyond,” International Journal of Molecular Sciences, vol. 14, no. 10, pp. 19891–19910, 2013.
[12] A. W. Stitt, “The role of advanced glycation in the pathogenesis of diabetic retinopathy,” Experimental and Molecular Pathology, vol. 75, no. 1, pp. 95–108, 2003.
[13] R. Chibber, P. A. Molinatti, N. Rosatto, B. Lambourne, and E. M. Kohner, “Toxic action of advanced glycation end products on cultured retinal capillary pericytes and endothelial cells: relevance to diabetic retinopathy,” Diabetologia, vol. 40, no. 2, pp. 156–164, 1997.
[14] R. Meerwaldt, T. P. Links, R. Graaff et al., “Increased accumu-lation of skin advanced glycation end-products precedes and correlates with clinical manifestation of diabetic neuropathy,”
Diabetologia, vol. 48, no. 8, pp. 1637–1644, 2005.
[15] V. M. Monnier, D. R. Sell, C. Strauch et al., “The association between skin collagen glucosepane and past progression of microvascular and neuropathic complications in type 1 dia-betes,” Journal of Diabetes and its Complications, vol. 27, no. 2, pp. 141–149, 2013.
[16] S. Genuth, W. Sun, P. Cleary et al., “Glycation and car-boxymethyllysine levels in skin collagen predict the risk of future 10-year progression of diabetic retinopathy and nephropathy in the diabetes control and complications trial and epidemiology of diabetes interventions and complications participants with type 1 diabetes,” Diabetes, vol. 54, no. 11, pp. 3103–3111, 2005.
[17] K. Kiuchi, J. Nejima, T. Takano, M. Ohta, and H. Hashimoto, “Increased serum concentrations of advanced glycation end products: a marker of coronary artery disease activity in type 2 diabetic patients,” Heart, vol. 85, no. 1, pp. 87–91, 2001. [18] N. Katakami, M. Matsuhisa, H. Kaneto et al., “Decreased
in type 1 diabetic patients: its possible association with diabetic vascular complications,” Diabetes Care, vol. 28, no. 11, pp. 2716– 2721, 2005.
[19] A. Lapolla, F. Piarulli, G. Sartore et al., “Advanced glycation end products and antioxidant status in type 2 diabetic patients with and without peripheral artery disease,” Diabetes Care, vol. 30, no. 3, pp. 670–676, 2007.
[20] S. Arsov, R. Graaff, W. van Oeveren et al., “Advanced glycation end-products and skin autofluorescence in end-stage renal disease: a review,” Clinical Chemistry and Laboratory Medicine, vol. 52, no. 1, pp. 11–20, 2014.
[21] S. Genuth, W. Sun, P. Cleary et al., “Skin advanced glycation end products glucosepane and methylglyoxal hydroimidazolone are independently associated with long-term microvascular complication progression of type 1 diabetes,” Diabetes, vol. 64, no. 1, pp. 266–278, 2015.
[22] N. H. White, W. Sun, P. A. Cleary et al., “Prolonged effect of intensive therapy on the risk of retinopathy complications in patients with type 1 diabetes mellitus: 10 years after the Diabetes Control and Complications Trial,” Archives of Ophthalmology, vol. 126, no. 2, pp. 1707–1715, 2008.
[23] Writing Team for the Diabetes Control and Complications Trial/Epidemiology of Diabetes Interventions and Complica-tions Research Group, “Sustained effect of intensive treatment of type 1 diabetes mellitus on development and progression of diabetic nephropathy: the Epidemiology of Diabetes Inter-ventions and Complications (EDIC) study,” The Journal of the
American Medical Association, vol. 290, pp. 2159–2167, 2003.
[24] D. E. Hricik, J. A. Schulak, D. R. Sell, J. F. Fogarty, and V. M. Monnier, “Effects of kidney or kidney-pancreas transplantation on plasma pentosidine,” Kidney International, vol. 43, no. 2, pp. 398–403, 1993.
[25] D. E. Hricik, Y. C. Wu, J. A. Schulak, and M. A. Friedlander, “Disparate changes in plasma and tissue pentosidine levels after kidney and kidney-pancreas transplantation,” Clinical
Transplantation, vol. 10, no. 6, part 1, pp. 568–573, 1996.
[26] P. J. Beisswenger, S. K. Howell, G. Russell, M. E. Miller, S. S. Rich, and M. Mauer, “Detection of diabetic nephropathy from advanced glycation endproducts (AGEs) differs in plasma and urine, and is dependent on the method of preparation,” Amino
Acids, vol. 46, no. 2, pp. 311–319, 2014.
[27] G. Llaurad´o, V. Ceperuelo-Mallafr´e, C. Vilardell et al., “Advanced glycation end products are associated with arterial stiffness in type 1 diabetes,” Journal of Endocrinology, vol. 221, no. 3, pp. 405–413, 2014.
[28] M. G. A. van Eupen, M. T. Schram, H. M. Colhoun, J. L. J. M. Scheijen, C. D. A. Stehouwer, and C. G. Schalkwijk, “Plasma levels of advanced glycation endproducts are associated with type 1 diabetes and coronary artery calcification,”
Cardiovascu-lar Diabetology, vol. 12, no. 1, article 149, 2013.
[29] G. L. J. Hull, J. V. Woodside, J. M. Ames, and G. J. Cuskelly, “Validation study to compare effects of processing protocols on measured𝑁𝜀-(carboxymethyl)lysine and𝑁𝜀-(carboxyethyl) lysine in blood,” Journal of Clinical Biochemistry and Nutrition, vol. 53, no. 3, pp. 129–133, 2013.
[30] J. W. Nin, A. Jorsal, I. Ferreira et al., “Higher plasma levels of advanced glycation end products are associated with incident cardiovascular disease and all-cause mortality in type 1 diabetes: a 12-year follow-up study,” Diabetes Care, vol. 34, no. 2, pp. 442– 447, 2011.
[31] M. Crisan, M. Taulescu, D. Crisan et al., “Expression of advanced glycation end-products on sun-exposed and non-exposed cutaneous sites during the ageing process in humans,”
PLoS ONE, vol. 8, no. 10, Article ID e75003, 2013.
[32] C. E. Bekircan-Kurt, N. ¨Uc¸eyler, and C. Sommer, “Cutaneous activation of rage in nonsystemic vasculitic and diabetic neu-ropathy,” Muscle & Nerve, vol. 50, no. 3, pp. 377–383, 2014. [33] J. R. Kizer, D. Benkeser, A. M. Arnold et al., “Advanced
glycation/glycoxidation endproduct carboxymethyl-lysine and incidence of coronary heart disease and stroke in older adults,”
Atherosclerosis, vol. 235, no. 1, pp. 116–121, 2014.
[34] B. Descamps-Latscha, V. Witko-Sarsat, T. Nguyen-Khoa et al., “Advanced oxidation protein products as risk factors for atherosclerotic cardiovascular events in nondiabetic predialysis patients,” American Journal of Kidney Diseases, vol. 45, no. 1, pp. 39–47, 2005.
[35] V. Witko-Sarsat, M. Friedlander, C. Capeill`ere-Blandin et al., “Advanced oxidation protein products as a novel marker of oxidative stress in uremia,” Kidney International, vol. 49, no. 5, pp. 1304–1313, 1996.
[36] M. K. Halushka, E. Selvin, J. Lu, A. M. Macgregor, and T. C. Cornish, “Use of human vascular tissue microarrays for measurement of advanced glycation endproducts,” Journal of
Histochemistry & Cytochemistry, vol. 57, no. 6, pp. 559–566,
2009.
[37] S. Genuth, W. Sun, P. Cleary et al., “Skin advanced glycation endproducts (AGEs) glucosepane and methylglyoxal hydroim-idazolone are independently associated with long-term micro-vascular complication progression of type i diabetes,” Diabetes, 2014.
[38] R. Meerwaldt, R. Graaf, P. H. N. Oomen et al., “Simple non-invasive assessment of advanced glycation endproduct accumu-lation,” Diabetologia, vol. 47, no. 7, pp. 1324–1330, 2004. [39] R. Meerwaldt, J. W. L. Hartog, R. Graaff et al., “Skin
autofluores-cence, a measure of cumulative metabolic stress and advanced glycation end products, predicts mortality in hemodialysis patients,” Journal of the American Society of Nephrology, vol. 16, no. 12, pp. 3687–3693, 2005.
[40] H. L. Lutgers, R. Graaff, T. P. Links et al., “Skin autofluorescence as a noninvasive marker of vascular damage in patients with type 2 diabetes,” Diabetes Care, vol. 29, no. 12, pp. 2654–2659, 2006.
Submit your manuscripts at
http://www.hindawi.com
Stem Cells
International
Hindawi Publishing Corporation
http://www.hindawi.com Volume 2014
Hindawi Publishing Corporation
http://www.hindawi.com Volume 2014
INFLAMMATION
Hindawi Publishing Corporation
http://www.hindawi.com Volume 2014
Behavioural
Neurology
Endocrinology
International Journal ofHindawi Publishing Corporation
http://www.hindawi.com Volume 2014
Hindawi Publishing Corporation
http://www.hindawi.com Volume 2014
Disease Markers
Hindawi Publishing Corporation
http://www.hindawi.com Volume 2014 BioMed
Research International
Oncology
Journal ofHindawi Publishing Corporation
http://www.hindawi.com Volume 2014
Hindawi Publishing Corporation
http://www.hindawi.com Volume 2014 Oxidative Medicine and Cellular Longevity Hindawi Publishing Corporation
http://www.hindawi.com Volume 2014
PPAR Research
The Scientific
World Journal
Hindawi Publishing Corporation
http://www.hindawi.com Volume 2014
Immunology Research Hindawi Publishing Corporation
http://www.hindawi.com Volume 2014
Journal of
Obesity
Journal ofHindawi Publishing Corporation
http://www.hindawi.com Volume 2014
Hindawi Publishing Corporation
http://www.hindawi.com Volume 2014 Computational and Mathematical Methods in Medicine
Ophthalmology
Journal of Hindawi Publishing Corporationhttp://www.hindawi.com Volume 2014
Diabetes Research
Journal ofHindawi Publishing Corporation
http://www.hindawi.com Volume 2014
Hindawi Publishing Corporation
http://www.hindawi.com Volume 2014
Research and Treatment
AIDS
Hindawi Publishing Corporation
http://www.hindawi.com Volume 2014
Gastroenterology Research and Practice
Hindawi Publishing Corporation
http://www.hindawi.com Volume 2014