This is a pre-print version of the following article: Azevedo, A. B., López-Colás, J., & Módenes, J. A. (2016). Home ownership in Southern European countries: Similarities and differences. Portuguese Journal of Social Science, 15(2), 275-298. DOI: 10.1386/pjss.15.2.275_1
http://www.ingentaconnect.com/content/intellect/pjss/2016/00000015/00000 002/art00007
Home ownership in southern European countries: similarities and differences
Alda Botelho Azevedo
Centre d'Estudis Demogràfics, Universitat Autònoma de Barcelona Instituto de Ciências Sociais, Universidade de Lisboa
Julián López-Colás
Centre d'Estudis Demogràfics, Universitat Autònoma de Barcelona Juan A. Módenes
Centre d'Estudis Demogràfics, Universitat Autònoma de Barcelona
Abstract
Southern European countries (SEC) are often considered as a homogenous group, distinct from the rest of Europe, in the literature of housing studies. This article explores the idea that despite sharing cohesion factors, Cyprus, Greece, Italy, Malta, Portugal and Spain also displayed a significant degree of heterogeneity in their housing patterns at the outset of the current economic crisis.
The study analyses 2005 and 2009 micro-data from the European Union Statistics on Income and Living Conditions at two levels. At the macro level, a cluster analysis was used to define four homogeneous groups in the European context. At the micro level, both homogeneous and heterogeneous features of home ownership in the SEC were identified using logistic modelling.
The results of the macro analysis highlight the structural proximity between the southern and the post-socialist countries in terms of housing characteristics. With regard to predictors of home ownership, the micro analysis confirms that SEC form a distinctive group when compared with the European Union at large, while displaying significant internal heterogeneity in predictors such as age, citizenship, dwelling type and social environment.
Keywords: EU-SILC; home ownership; housing system in southern
European countries; housing typologies; welfare state regimes.
Introduction
Population and housing are closely intertwined because ‘people live in households and households need housing’ (Mulder 2006: 403). This is a two-way interrelationship (Myers 1990): housing stocks and markets impinge
upon population distribution and mobility at local or regional scales, whereas population structure and growth determine total demand for housing at higher scales. At national and international scales, political and economic structures, which can be summarized under the concept of welfare regimes, influence the set of preferences and restrictions that shape housing behaviours. At the same time, welfare regimes essentially determine the type of housing supply that is available to the population. Within this framework, home ownership is a key factor. Even though it is not necessarily the best tenure option (Kemeny 1981), home ownership has usually been considered an important indicator of good living conditions. It has even become a final aim of most households’ housing careers. National home ownership rates have been increasing in recent decades in almost all western and high-income countries due to the availability and accessibility of mortgages, the support of the welfare state and the construction boom (Ronald, Elsinga 2012).
Micro-data from the European Union Statistics on Income and Living Conditions (EU-SILC), 2005 and 2009, are analysed in order to identify the common features and distinguishing elements of the housing patterns in the southern European countries (SEC) of Cyprus, Greece, Italy, Malta, Portugal and Spain. This period corresponds to the end of the recent financial and housing bubble, which was followed by the beginning of the economic crisis and the onset of austerity measures. Consequently, mortgage over-indebtedness and growing unemployment levels began to seriously affect countries such as Greece, Portugal and Spain (Módenes, López-Colás 2014), completely challenging the traditional, family-based relationship between housing and population in SEC (Allen et al. 2004).
Within this recent context, the present research addresses two questions: Have these new contextual developments modified the factors that, according to the literature, explain high home ownership in SEC? Can one distinguish heterogeneous patterns in SEC during this period?
A somewhat hybrid methodology is required to articulate a macro analysis at the country level on the one hand, and individual logistic models using micro-data on the other. In this sense, the study follows a divergence approach (Kemeny, Lowe 1998), guided by a three-dimensional analysis: (1) to reassess the general European features; (2) to identify the factors that distinguish the SEC from the aggregate European pattern; and (3) to recognize the particularities of each country within the SEC.
According to the theoretical framework, certain results are anticipated. Cohesive structural and traditional factors are expected to define the SEC as distinct from the European context. Home ownership and the corollary lack of efficient rental and social rental housing markets are to be the key common features of SEC. As elements of heterogeneity, specific behavioural differences are expected between individual SEC countries. These may occur in response to particular housing and financial markets trends at the country level. Should this behavioural heterogeneity have cohort effects, then further fundamental changes may be expected in SEC housing systems, opening up a path for gradual divergence (Malpass 2011).
Tenure status in southern Europe
After some early proposals in the 1990s (Bonoli 1997; Ferrera 1996), and the contributions of Allen et al. (2004), Leal (2004) and Hoekstra (2005), among others, there has been a recognition of Greece, Italy, Portugal and Spain as a homogeneous group with strong differences from all the other European countries. Bridging the gap with Esping-Andersen regimes (1990; 1999), these countries are characterized by a low level of decommodification, a relatively high level of stratification and the dominant position held by the family (Hoekstra 2005; 2010).
The southern model of housing is distinct from the European context in five indicators: the high rates of home ownership across all social strata, high rates of second homes, deficient rental markets and social rental housing stock, important role of the family in providing housing and self-provision in housing access (Leal 2004; Allen 2006; Ronald 2007; Poggio 2008; 2012). Nevertheless, these characteristics should be interpreted as the result of a particular form of social production of ownership - where family, market and state interact - rather than as a strictly geographical construct. In this respect, Poggio’s ‘familialistic welfare regime’ seems to be an accurate portrayal (Poggio 2008).
The decisive family role in housing provision arises from the social value of home and property in southern Europe: house and land are assets passed on from generation to generation. As such, these assets are typically preserved and expanded through family support (Allen et al. 2004), which in turn results in high rates of home ownership. Additionally, in a time of economic crisis, the role of the family can mitigate the impact of restrictions on access to credit, especially within families with medium-high or high income (Baldini, Poggio 2013).
Effectively, given that the same residential system may be found in more than one welfare state regime (Kemeny 2006), the analysis of housing systems benefits from assigning a more central role to the tenure status (Kemeny 2001). In southern Europe this is a particularly promising approach, as tenure status plays a central factor in these countries’ socioeconomic makeup.
In fact, outright home ownership was the most frequent tenure in SEC in 2009 (Figure 1). The combined ratio of outright home ownership and home ownership with a mortgage or loan puts Spain at the top (82.8%), followed by Italy (76.1%) and Portugal (75.8%). This is the result of housing policies encouraging home ownership, flexibility in credit availability and, more recently, the construction boom that emerged in the post-dictatorship states.
Other tenure categories are more present in Greece, Malta and Cyprus. In Greece, a sizeable rental market (17.3%), compared with the other SEC, is the result of the almost complete lack of a social housing supply. Cyprus also has a very small social rental market; however, the role of the family in the direct provision of housing, which is stronger than anywhere else (Minas
et al. 2013), explains why they have the highest rate of free tenancy
(22.5%). In comparison, and mostly due to the political legacy of British colonialism (Vakili-Zad, Hoekstra 2011), Malta is - by far - the country with the largest social rental market (17.1%).
EU Italy Greece Malta Cyprus Spain Portugal 0 10 20 30 40 50 60 70 80 90 100
Outright owner Owner with mortage Tenant (market price) Tenant (below market price) Free
%
(*) As can be seen in Figure 1, Italy’s micro-data for 2009 merges the categories ‘owner’ and ‘owner with mortgage’ into a single category; this raises some methodological restrictions in this study, which will be discussed ahead.
Source: EU-SILC micro-data, 2009, own calculations.
Figure 1: Tenure status rates by households (%), European Union and southern European countries (*).
When considering home ownership supported by a mortgage, heterogeneity emerges. In Spain and Portugal, this tenure status is more frequent than in the other SEC, a continuing divergent trend since the 1990s (Trilla 2001). The EU-SILC 2009 data on population by tenure status published by Eurostat clearly confirm this pattern. 1 Furthermore, the residential mortgage
debt-to-GDP ratio has been rising at a constant pace and at a higher rate in the SEC than in the European Union (EU). The sharpest increase was in Cyprus, from 5.8% in 2000 to 71.3% in 2011, surpassing Portugal and Spain (66.6% and 62.1%, respectively) (European Mortgage Federation 2012) and highlighting social changes in the intergenerational transfer of housing.
High rates of ownership are mainly the consequence of small rental markets (Allen et al. 2004; Módenes, López-Colás 2012), not so much of large ownership markets, as we will see later. There are two main reasons for the lack of interest from SEC governments in developing an efficient social and private rental sector. Successive public policies promoted home ownership as a means to ensure social stability, and more prosaically, managing a public rental stock has been a challenge for public institutions (Allen et al. 2004). In fact, both reasons are closely related to the promotion of unbalanced economic production systems based, in the end, on housing construction (Bielsa, Duarte 2011). Therefore, ownership is also indirectly encouraged by the lack of real investment alternatives for households (Castles, Ferrera 1996). The goal of social stability aligns with the active involvement of family and the expansion across all social strata to shape a housing system based absolutely in home ownership (Cabré, Módenes 2004; Poggio 2012).
The Spanish rental market is particularly small. In addition to the above-mentioned reasons, this is also the peculiar result of a long history of protectionist policy measures for the benefit of existing tenants (Cabré, Módenes 2004). In this framework, over time, family ties have been decisive
in providing housing through various means, such as financial support (Allen 2006; Mandic 2012; Mulder, Billari 2010; Poggio 2008), intergenerational transfer (Leal 2004; Poggio 2008) and extended co-residence (Iacovou, Skew 2010; Mandic 2012; Módenes, López-Colás 2012). The closer the residential location of family members, the stronger these intergenerational relations and ties are, which in turn influences the level and types of support available (Poggio 2008).
Home ownership can have a palliative effect on public expenditure for older people, which might be one of the reasons why governments have encouraged this tenure status (Doling 2012). Initially described by Kemeny (1981, 2005), the ‘big trade-off’ is the inverse relationship between the amount of public expenditure in pensions for older people and the level of the rate of home ownership. However, Greece, Italy, Portugal and Spain follow a different pattern, with relatively high pensions and high home ownership rates. Assets, housing resources and welfare pensions are concentrated in favour of the elderly (Castles, Ferrera 1996). Intergenerational family financial transfers to young people are essential for social cohesion, replacing almost absent public policies (Stamsø 2010) and supporting the problematic access to housing experienced by young adults in southern Europe (Castles, Ferrera 1996). A strategic delay in family formation and a low fertility rate complete the picture of ways to adapt to their housing reality (Poggio 2008; Mulder, Billari 2010).
In times of great change - such as the present - it is worthwhile to look at the changes underway in the SEC, which are particularly affected by the current economic crisis. Have these new contextual developments modified the factors that, according to the literature, explain high home ownership in SEC? Secondly, can one distinguish divergent patterns in SEC during this period?
To address these questions, 2 we formulated two hypotheses:
1. The SEC continue to share a number of common factors that mostly explain housing patterns and, specifically, home ownership. If this hypothesis is validated, a joint analysis of SEC would still be justified. 2. Individual analysis of each SEC reveals that the sociodemographic
patterns of the current access to home ownership differ to some extent.
Data and methods
Data source and sample
Bearing in mind the former underlying hypotheses, this study was based on the household heads information offered by the cross-sectional EU-SILC micro-data. Two survey rounds have been selected: 2005 and 2009. Although more recent rounds are available, given that the annual survey follows a four-year rotational design sampling method with 25 per cent of replacement each year, the data in these two rounds come from two completely different populations. 3 Despite a four-year interval, it is too short
to expect substantive changes in residential patterns. Our goals at this time are a more moderate, cross-cutting approach, prioritising the strengthening
of our data sample, and thus improving the analysis of the housing behaviours in SEC at the edge of the financial crisis.
The data source has two main limitations for 2005. Despite EU-SILC implementation in Malta in that year, only the 2009 data is available. Italian data for that year make no distinction between outright home ownership and home ownership with a mortgage or loan. 4 Considering Italy’s weight in
the data and its importance to SEC behaviour, the present analysis merged these two categories of home ownership for all countries. Nonetheless, EU-SILC is a harmonized and representative dataset, making it the most appropriate data source for the purposes of our study.
In 2005, 26 countries participated in EU-SILC and a total of 197,657 households were interviewed. In 2009 the survey was applied to 223,428 households in 29 countries. The SEC represent 24.77% (48,957 households) and 23.14% (51,710 households) of the sample in 2005 and 2009, respectively.
Empirical analysis planning
To carry out the empirical work, EU-SILC variables were selected to cover the three dimensions that, according to the literature, best explain home ownership at the individual level: demographic, socioeconomic and residential features.
For the demographic dimension, the ‘age group, head-of-household’ variable reflects the main stages of the life cycle. ‘Citizenship’ (recoded as native or foreign) is related to availability of family networks and personal resources and to institutional preferences.
For the socioeconomic dimension, comparative ‘educational attainment’ and ‘household income’ variables were developed. The income variable was further coded as a dichotomous indicator of ‘poverty’ according to the national standard. State involvement in housing markets is represented by the proportion of social rental dwellings. 5
The residential dimension is based on conventional ‘tenure status’ rates (calculated in relation to total households). These rates were complemented by the headship rates by tenure suggested by Yu and Myers (2010), which add household formation to an updated concept of access to home ownership. Closely connected with the tenure status, ‘dwelling type’ was also used as an explanatory variable. To understand the relation between ownership and housing quality, the dichotomous variables ‘dwelling quality’ and ‘social environment’ were created. 6
First, to confirm that a coherent group is formed by the countries of southern Europe, multivariate clustering was used to detect homogeneous groups of European countries (cases) with respect to housing patterns in the EU-SILC 2009 round. The small sample size (N=29) undermines an exploratory factor analysis or principal component analysis to reduce and classify the relationship between variables (Osborne, Costello 2004). This provides an additional reason for choosing variables from the literature that emphasize the residential and socioeconomic dimensions, taking into account the population structure (see Table 1 for the complete list of variables). Ward’s hierarchical method was articulated with the non-hierarchical K-Means
method. Ward’s method determines the optimal number of groups. The K-Means method was used to assign each case to the most suitable group. Second, using the 2005 and 2009 EU-SILC rounds, we ran logistic regressions for eight models (EU, southern Europe, Cyprus, Greece, Italy, Malta, Portugal and Spain) to understand the effect of demographic, socioeconomic, contextual and residential variables in tenure status (see Table 4 for the complete list of variables). The logistic model was stated in terms of Y=1 (be owner). Table A1 (Appendix) summarizes the absolute frequencies of the independent variables.
Three variables were included as control rather than independent variables because they were redundant, as follows: household composition and degree of urbanization (both connected with dwelling type) and year of contract (connected with quality dwelling). 7
Noncollinearity between the independent variables was tested and covariates were excluded from the models. 8 Two complementary methods
were used. First, in an exploratory phase, a forward stepwise conditional regression was applied to test for relationships between the variables. Independent predictive variables with log-likelihood values below 0.1 per cent of relative gain were excluded as not significantly explanatory (Menard 1995; Jovell 1995).
Secondly, the Enter method was used to test the statistical significance of each Exp(β) in the model. The final set of variables was tested for non-iteration, ensuring independence of the variables selected. To correct the discrepancy of the sample relative to the population, the analysis was conducted with the weighted sample. The asterisks indicate the unweighted results that achieved significance.
The data analysis was performed using the IBM SPSS Statistics 20 software.
Clustering European housing patterns at macro level
In 2005 and 2009, Spain presented the highest rates of home ownership (83.29% and 82.75%, respectively) of the SEC and Cyprus the lowest (70.98% and 69.73%, respectively) (Figure 2 below and Table A2 in Appendix). In Cyprus, in comparison, the rent market decreased sharply, mainly due to the increased free tenancy, which was already the highest in the SEC group in 2005 due to the aforementioned reasons. These two countries have the smallest rental and social housing markets. However, while in Spain the absence of any alternative tenure reinforces the weight of ownership, in Cyprus the proxy is free tenancy.
0 10 20 30 40 50 60 70 80 90 100
EU Spain Greece Portugal Italy Cyprus Malta %
Source: EU-SILC micro-data, 2005 and 2009, own calculations.
Figure 2: Tenure status rates (%), European Union and southern European countries.
Aiming to disentangle the homogeneous housing patterns that can be found in Europe, four clusters were defined in 2009 data (Figure 3). The results emphasize the effect of the residential variables, the keystone of this study. These variables are the source of the main differences between this present classification and previous findings (Esping-Andersen 1990; Hoekstra 2005; 2010; Fenger 2007).
Figure 3: Distance of case from the centre of its classification cluster, K-Means method, European countries.
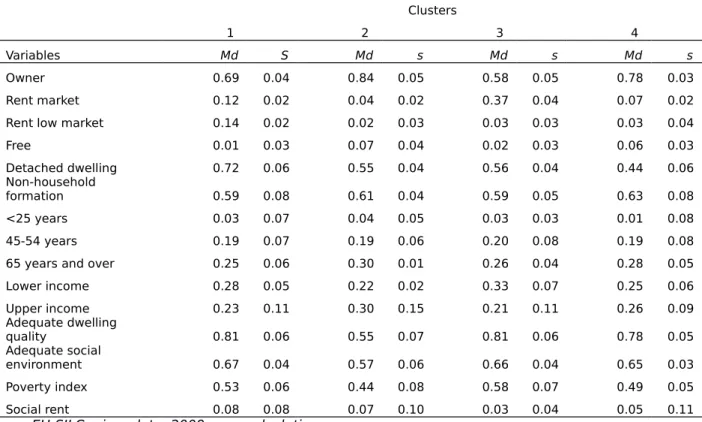
Table 1 systematizes the characteristics of each cluster according to the median and the standard deviation.
Clusters
1 2 3 4
Variables Md S Md s Md s Md s
Owner 0.69 0.04 0.84 0.05 0.58 0.05 0.78 0.03
Rent market 0.12 0.02 0.04 0.02 0.37 0.04 0.07 0.02
Rent low market 0.14 0.02 0.02 0.03 0.03 0.03 0.03 0.04
Free 0.01 0.03 0.07 0.04 0.02 0.03 0.06 0.03 Detached dwelling 0.72 0.06 0.55 0.04 0.56 0.04 0.44 0.06 Non-household formation 0.59 0.08 0.61 0.04 0.59 0.05 0.63 0.08 <25 years 0.03 0.07 0.04 0.05 0.03 0.03 0.01 0.08 45-54 years 0.19 0.07 0.19 0.06 0.20 0.08 0.19 0.08
65 years and over 0.25 0.06 0.30 0.01 0.26 0.04 0.28 0.05
Lower income 0.28 0.05 0.22 0.02 0.33 0.07 0.25 0.06 Upper income 0.23 0.11 0.30 0.15 0.21 0.11 0.26 0.09 Adequate dwelling quality 0.81 0.06 0.55 0.07 0.81 0.06 0.78 0.05 Adequate social environment 0.67 0.04 0.57 0.06 0.66 0.04 0.65 0.03 Poverty index 0.53 0.06 0.44 0.08 0.58 0.07 0.49 0.05 Social rent 0.08 0.08 0.07 0.10 0.03 0.04 0.05 0.11
Source: EU-SILC micro-data, 2009, own calculations.
Table 1: Median (Md) and standard deviation (s), cluster analysis variables.
Cluster 4 is the largest cluster (12 countries) containing the SEC (Cyprus excluded) and most post-socialist countries. Note that Hoekstra’s analysis focused on the relationship between tenure, dwelling type and quality (Hoekstra 2005, 2010). However, he did not have access to the appropriate data for the post-socialist countries. Therefore, Hoekstra’s Mediterranean welfare regime cluster (Italy, Spain, Portugal and Greece) appears grouped with other countries in the present clustering (Hoekstra 2005). Iceland falls in the same cluster, most likely due to the effects of the economic crisis that erupted in 2008.
Countries in Cluster 4 have a medium-high rate of home ownership in common with the corresponding medium-small rental market and a small social rental housing market. There, non-detached dwellings (mostly apartments) are more common. The quality terms stand for a medium-low quality, both for dwelling quality and social environment. After crossing the results for non-household formation and age group under 25 years, it is clear that household formation is more severely restricted at younger ages in these countries.
These outcomes highlight that the SEC still share common features, although in 2009 these were also shared with other countries. In fact, to explain why homeownership is so widespread in these countries, a lot of factors are required, which are difficult to measure, such as the effect of public policies (in post-socialist countries) or the effect of family support in
the provision of housing (in SEC). Since these features play an important role in the access to housing, they dilute the importance of other variables, making countries with very diverse backgrounds structurally close in terms of housing characteristics. Thus, due to the geographical, historical, political, social and cultural ties, the first hypothesis is confirmed: it remains justified to study the SEC as a separate block. 9
In order to better understand the true weight of home ownership in the SEC, it is worthwhile to bring in the fresh perspective of Yu and Myers (2010). Conventionally, the ownership rate is defined by the ratio of owner-occupied households to the sum of the owner and renter-occupied households. Therefore, an eventual increase of home ownership, as in most countries recently, does not necessarily mean that renters changed to owners, nor does it mean better access to household formation in home ownership (Yu, Myers 2010; Módenes 2012). If economic difficulties make household postponement more likely and this is more frequent among those persons more inclined to rent their home (due to some degree of social stratification by tenure, for instance), the conventional ownership rate may increase, but obviously the context may be worse, not better.
Yu and Myers (2010) suggest an alternative measurement of the tenure rate, dividing house owners by the population universe rather than the household universe to obtain what they call ‘owner headship rate’. 10
Consequently, it is possible to measure access to household formation and how this interacts with tenure options. In its more elementary alternative, three complementary rates can be calculated: owner headship rate, rent headship rate and non-headship rate (Table 2).
Headship rates (%) Owner headship rates (%) Renter headship rates (%) Non-headship rates (%) Home ownership rates (%) EU 38.91 29.43 9.48 61.09 75.58 Cluster 1 40.50 29.42 11.08 59.50 72.43 Cluster 2 36.58 32.30 4.28 63.42 88.30 Cluster 3 41.89 26.20 15.69 58.11 62.51 Cluster 4 37.64 29.94 7.70 62.36 79.55 SEC 37.85 29.26 8.59 62.15 77.30 Cyprus 33.88 23.62 10.26 66.12 69.73 Greece 39.01 29.62 9.39 60.99 75.92 Italy 39.76 30.26 9.50 60.24 76.11 Malta 35.72 26.76 8.96 64.28 74.92 Portugal 38.12 28.91 9.21 61.88 75.83 Spain 36.21 29.96 6.25 63.79 82.75
Source: EU-SILC micro-data, 2009, own calculations.
Table 2: Different perspectives of tenure rates (%), European Union, southern European countries and clustering results, 2009.
A comparison between the rates for cluster 4 and the SEC show close values. SEC have a slightly higher renter headship rate and the corresponding lower home ownership rate than cluster 4. SEC have a problematic household formation (low headship rates) and similar owner headship rates to the rest of Europe. The main difference is in the renter
headship rates, showing the deficit of this housing option to young households in SEC.
Regarding the owner headship and non-headship rates, the SEC are quite homogeneous; however, this is not entirely clear from the home ownership rates (Table 2 above and Table A3 in Appendix). Nevertheless, the analysis shows that the origin of these internal discrepancies has to be identified in the relative differences in renter headship rates among SEC, not in access to ownership. Wherever there are more opportunities to access rental housing, household formation is higher and, paradoxically, traditional home ownership rate is lower (as in Greece, but headship in ownership is here actually as high as in the rest of SEC). Particularly homogeneous are the owner headship rates of Greece, Italy, Portugal and Spain. In this group, Spain stands out from the rest due to the small rental market. The SEC are not distinguished by a particularly high home ownership with this approach. In the next section, the consistency of this SEC block will be tested at the micro level.
Comparing factors explaining home ownership at household level: homogeneity and heterogeneity in SEC
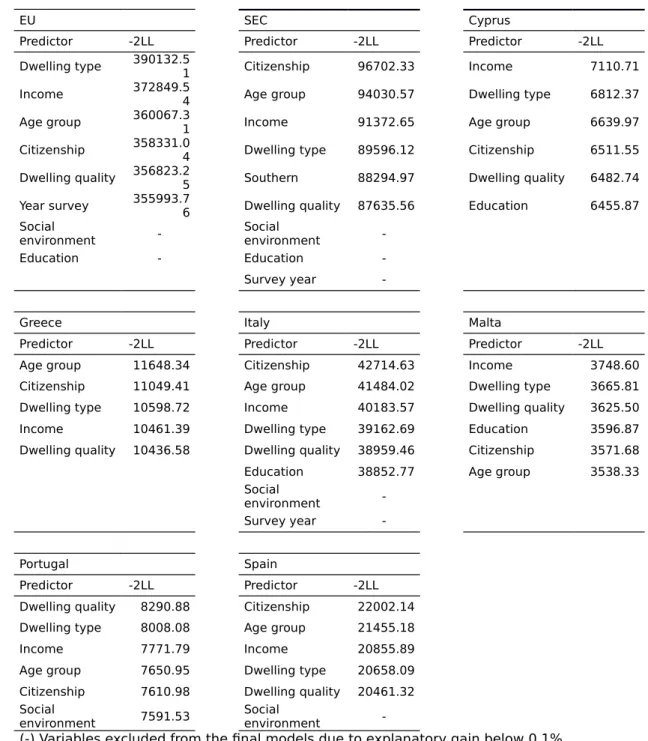
Although SEC home ownership is not particularly high when all individuals are considered, there is a widespread tenure status if only actual households are taken into account. Once the household is created, the predictors show that ownership in SEC can be explained by a number of common factors; on the other hand, within this apparent homogeneity the explanation of ownership makes the case for heterogeneity (Table 3). As the log-likelihood values decrease (Table A4), the strongest predictors, and those that improve the accuracy of the model, can be identified. Ownership is so widespread among SEC households that diversity is explained by several variables, any of them totally decisive. This analysis highlights a difference from the European model, as some of the most explanatory variables in the SEC model (e.g., age group) make a weaker contribution to explaining ownership than in the rest of Europe. To sum up, individual opportunity to access home ownership is not very important in the SEC because of the highly widespread propensity to own a home once a household is formed.
Comparing the ranking of variables in the EU and SEC models, the singularity of the latter is striking (Table 3). While the most explanatory predictors in the EU are residential (dwelling type) and socioeconomic (income), demographic predictors take the lead in the SEC, especially migration and stage of life (citizenship and age group). Accordingly, those are the two main predictors in the Italian, Greek and Spanish models, followed by the socioeconomic and residential variables (income and dwelling type). In Cyprus and Malta, the order is the inverse. Their diversity in home ownership can be explained by socioeconomic and residential predictors, followed by the demographic ones.
Portugal, in comparison, has its own distinct pattern, where the residential variables (dwelling quality and dwelling type) are the most explanatory predictors, followed by income.
Thus, the SEC can be subdivided in two groups: Italy and Spain with identical patterns and Greece with a very similar one vs Cyprus and Malta with almost identical features and Portugal with some similarities.
EU Southern Cyprus Greece Italy Malta Portugal Spain Dwelling
type Citizenship Income Age group Citizenship Income Dwelling quality Citizenship Income Age group Dwelling
type Citizenship Age group Dwelling type Dwelling type Age group Age group Income Age group Dwelling
type Income Dwelling quality Income Income Citizenship Dwelling
type Citizenship Income Dwelling type Education Age group Dwelling type Dwelling
quality Southern Dwelling quality Dwelling quality Dwelling quality Citizenship Citizenship Dwelling quality Year Dwelling
quality Education - Education Age group Social environment
-Note: Significant variables are listed in descending order based on the -2LL likelihood values shown in Table A4 (Appendix).
Source: EU-SILC micro-data, 2005 and 2009, own calculations.
Table 3: Characteristics of the regression models of home ownership by sociodemographic and residential characteristics using likelihood values (-2LL), European Union and southern European countries, 2005/2009.
Once the significance of predictors was determined for each model, the Enter method was used to understand the relationship between sociodemographic variables and tenure patterns. Following the stepwise method, the year of survey is explanatory only in the European model (higher risk of ownership in 2009 than in 2005 by 0.858). Thus, the two periods were combined in the regression analysis.
The results for the SEC model, where countries are treated as independent variables, show that the risk of ownership in southern Europe is not evenly distributed across these six countries; the difference is significant at p=0.01 for all countries except Malta (Figure 4). Taking Italy as baseline, the Spanish are 2.082 times and Maltese are 1.124 times (n/s) as likely as Italians to experience ownership, while the relative risk is below 1.0 in Greece (OR=0.937), Portugal (OR=0.791) and Cyprus (OR=0.746).
Spain*** Malta Italy (Reference category) Greece*** Portugal*** Cyprus***
0 0.5 1 1.5 2 2.5
Source: EU-SILC micro-data, 2005 and 2009, own calculations.
Figure 4: Odds ratios of home ownership by country (logistic regression model), southern European countries, 2005/2009.
Table 4 highlights three levels of analysis: general European trend, SEC specificities and elements of heterogeneity in the SEC.
At the first level of analysis, with regard the general European trend, there are two straightforward relationships. The first is between high income and home ownership; the second is between living in a dwelling with adequate quality and home ownership. Additionally, there are noticeable restrictions to home ownership access at younger ages (under 34 years). Taking into account the differences in the methodology used, these results are aligned with previous findings (Kurtz, Blossfeld 2004; Nico, 2010; Andrews, Sánchez 2011).
In the SEC, the sociodemographic variables play a more important role in explaining the rate of home ownership compared to Europe as a whole, mainly due to the reduced socioeconomic heterogeneity influence. Additionally, a larger set of variables is required, partly due to ownership being widespread in households of all social strata. Moreover, there is a wider native-foreign gap than in the European overall and decreased propensity for home ownership in the oldest cohort due to the timing of the housing market expansion.
In the SEC overall, the forthright European relationship between dwelling type, age and home ownership is recognizable, but less intense because apartments are frequently owner-occupied in this region. Thus, with a renewed methodology based on individualized approaches for each country, some of the main conclusions about SEC housing proposed by Hoekstra (2005) are confirmed.
As to elements of heterogeneity in the SEC, differences arise in access to ownership due to the multiple possible interactions between family, market and state. Despite previous evidence that the Portuguese residential system is restrictive regarding access to home ownership by immigrants (Malheiros, Fonseca 2011), our results indicate (OR=0.279) that other SEC may be even more restrictive. However, at least in Spain and Greece, when this access is granted there are no observed differences in housing values between foreigners and the overall population of home owners (Kolb et al. 2013). Since the expansion of ownership did not happen simultaneously across the SEC and housing policies differ between these countries, two features are recognisable in the odds ratios for age (measuring the relationship between ownership and life course). First, the odds ratios in the Greek, Italian and Spanish models show that housing resources favour the older cohorts, a conclusion previously reported by Castles and Ferrera (1996). Additionally, the Greek pattern reflects fluctuations both in housing policy, with regard to the access to credit and in the construction, with the boom after the Second World War (Anastassiadis, Tsoukala 2006).
Secondly, in Cyprus, and to some extent in Malta, the results show the middle-aged groups have greater tendency for home ownership. The older cohorts still retain the behaviour of a restrictive housing market, while the younger cohorts display a behaviour similar to the other SEC.
Due to collinearity and stepwise regression results, the odds for educational attainment are available only for three countries: Cyprus, Italy and Malta. In Italy and Malta, education increases the odds of being a home owner, as expected. Nevertheless, it is worth noting that in Cyprus, although having a secondary education increases the likelihood of being a home owner (OR=1.415), there is practically no difference between having a level of education higher than secondary and the reference category (OR=0.997). Haliassos et al. (2008) found a negative relationship between higher levels of education and home ownership. The authors related this finding to five factors: social customs, late establishment of accredited universities in Cyprus (1992), and individuals with a university education have a shorter working life, may not accept or request housing as a gift and education funding from parents and other family members may serve as an alternative to housing provision (Haliassos et al. 2008).
Unlike previous researchers who found that income is not a statistically significant variable in explaining home ownership in Cyprus (Haliassos et al. 2008; Minas et al. 2013), in our results, Cyprus stands out with respect to income, being closer to the European trend than to the SEC trend.
With regard to the residential variables, home ownership in Spain, and to some extent in Portugal, is almost as highly associated with apartment buildings with ten or more units as it is with detached houses. On one hand, this highlights the importance of home ownership in these countries; on the other, it results from their construction boom of the recent decades. Additionally, this result may be associated with better conditions in the apartments compared to detached houses in the housing stock, a conclusion previously obtained by Hoekstra (2005).
In Portugal, the existence of problems in the quality of the dwelling (OR=0.381) and in the surrounding social environment (OR=0.725) decreases the likelihood of home ownership. Although the odds for the social environment are not statistically significant for Portugal, in the other country models this variable was not even sufficiently explanatory to be included in the final set of variables. Previously, Hoekstra’s (2005) findings positioned Portugal as the country with the highest average number of problems in dwelling. This may be an outcome of the expansion of the housing market in Portugal in recent decades, which has been characterized by an increase in new construction at the expense of the rehabilitation of existing housing stock and by the predominance of new housing designated for home owner occupation (Guerra 2011).
Odds (Exp(β))
Predictor Label EU SEC Cyprus Greece Italy Malta Portugal Spain Citizenship Native 1 1 1 1 1 1 1 1 Foreign 0.378*** 0.149*** 0.226*** *0.083** 0.158*** 0.198*** 0.279*** 0.137*** Age 35-44 1 1 1 1 1 1 1 1 <25 0.250*** 0.320*** 0.225*** 0.096*** 0.501*** 0.305** 0.196*** 0.269*** 25-34 0.602*** 0.655*** 0.683*** 0.430*** 0.682*** 0.656* 0.513*** 0.661*** 45-54 1.241*** 1.261*** 1.047* 1.773*** 1.270*** 0.763 1.129 1.247*** 55-64 1.752*** 1.895*** 1.191** 2.591*** 2.088*** 0.504*** 1.319* 1.932***
65-74 2.050*** 2.307*** 0.725* 3.253*** 2.757*** 0.512** 1.265** 2.487*** >75 2.115*** 2.306*** 0.354*** 2.988*** 2.988*** 0.417*** 1.162* 2.100*** Educational
attainment Lower than secondary 1 1 1
Secondary 1.415**
* 1.361*** 1.505*** Higher than secondary
0.997* 1.411*** 1.996*** Income Lower 1 1 1 1 1 1 1 1 Lower-middle 1.806*** 1.491*** 1.554*** 1.188 1.521*** 1.324*** 1.087 1.576*** Upper-middle 3.176*** 2.217*** 2.899*** *1.558** 2.312*** 1.827*** 1.555*** 2.258*** Upper 5.839*** 3.520*** 5.330*** *2.451** 3.380*** 2.602*** 3.135*** 3.424***
Dwelling type Detached 1 1 1 1 1 1 1 1
Semi-detached 0.345*** 0.584*** 0.425*** 0.428*** 0.578*** 1.07 0.502*** 0.971 Apt. building < 10
dwellings 0.092*** 0.347*** 0.235*** 0.243*** 0.362*** 0.501** 0.350*** 0.472*** Apt. building 10 >
dwellings 0.123*** 0.446*** 0.274*** 0.249*** 0.373*** 0.297** 0.702*** 0.822*** Dwelling Quality Adequate
1 1 1 1 1 1 1 1
At least one problem 0.687*** 0.618*** 0.727*** *0.767** 0.693*** 0.517*** 0.381*** 0.573*** Constant 3.347*** 2.642*** 2.908*** *3.734** 2.118*** 4.939*** 4.567*** 3.558*** Nagelkerke R Square 0.194 0.291 0.269 0.334 0.191 0.155 0.174 0.172
N 391375 93726 6610 12447 39711 3524 9520 25748
Significance level: *<0.10; **<0.05; ***<0.01.
Source: EU-SILC micro-data, 2005 and 2009, own calculations.
Table 4: Odds ratios of home ownership by sociodemographic and residential characteristics (logistic regression models), European Union and southern European countries, 2005/2009. The logistic regressions results confirm that demographic features play an important role in home ownership. Their interaction with residential and economic variables in individual models allows better comprehension of those similarities and dissimilarities that are present under the apparent SEC homogeneity compared to the rest of Europe.
Conclusions
The study results confirm the hypotheses put forward: at the outset of the current economic downturn, the SEC can be simultaneously considered homogeneous when compared with the European context and heterogeneous as a group. The macro patterns in housing at the European level identified the emergence of a structural proximity between the southern and post-socialist European countries. These countries share medium-high (classical) rates of home ownership, medium-small rental and small social housing markets, medium-low dwelling quality and strong restrictions on household formation at younger ages. In this sense, the approach taken by Yu and Myers (2010) makes clear that home ownership may have been overestimated in these countries, as more traditional measures of tenure do not take into account their low and late household formation (which can be revealed by calculating headship by tenure rates instead of household tenure rates). It is not so much that SEC and
post-socialist countries have a high level of ownership, but rather that they have, in fact, a very low household formation.
Although SEC and post-socialist housing patterns are relatively close, these countries are heterogeneous in relation to other features. This justifies a separate analysis of the SEC group at the individual level. Confirming our first hypothesis, the SEC display their own patterns of individual predictors of home ownership, despite sharing some important trends with the rest of Europe. In the EU, home ownership is explained mostly through residential and economic predictors (dwelling type and income); in the SEC, demographic predictors (age and citizenship) are the most explanatory, and both are likely related to family ties.
Even though age is the most explanatory predictor in the SEC, its relative contribution is even higher in the general European model. In SEC, the family support in housing provision dilutes the importance of the life cycle in access to ownership. In the rest of Europe, access to home ownership is a matter of the biographical demographics and the economic evolution of the household. To most SEC households, home ownership is an initial requirement for household formation and the need to adapt to later changes in life cycle is relatively unimportant. In this context of delayed household formation and simultaneous access to home ownership, availability of family resources is a key factor. This is a topic to explore further at the micro level. Family ties can also lift the veil on the explanation for the native-foreign gap. Immigrants are usually detached from their family networks and expected to provide financial support for family members in their home country, not the reverse. In a housing system where family networks are one of the main agents of housing provision and access to home ownership, the lack of such resources very negatively affects their chances to reproduce the general behaviour of the overall society. As a result, they are induced to develop their own housing strategies, very often at the very edges of marginality. Thus, the native-foreign gap is wider in the SEC than in the rest of Europe. Even when the residential predictors have a similarly broad response in the EU and the SEC, some differences exist. This might be the case for the relationship between home ownership and dwelling type. In the European model, home ownership is highly associated with detached dwellings, reflecting the weight of northern European countries in the sample. In the SEC, home ownership is diluted throughout all dwelling types, suggesting that being an owner is more important than the dwelling type.
With respect to the second hypothesis of this study, the use of individual models produced evidences of heterogeneity within the SEC. Due to historical differences in housing markets, cohort effects placed age, at the top and bottom of the population pyramid, as the major element explaining heterogeneity. Other predictors include citizenship, dwelling type and social environment.
In summary, Italy and Spain share several features and Greece has a similar pattern with regard to age distribution of housing resources. Consequently, in these countries the older generations are favoured and the strongest predictors of home ownership are citizenship and age group. In comparison, Cyprus and Malta show strong similarities in income and dwelling type as predictors of home ownership. In turn, Portugal shares some of their
similarities but has an almost unique pattern, in which residential variables contribute most to the explanation of home ownership patterns.
Finally, future research is needed to explore in depth, through longitudinal analysis of the available sources on converging or diverging patterns, the relationship between life course and home ownership. These patterns reflect the age distribution of home ownership, which concentrates age-period-cohort effects, bringing together the influence of the economic context, housing policies, housing supply, credit availability and the resulting family response that is particularly important in the SEC.
References
Allen, Judith (2006), ‘Welfare Regimes, Welfare Systems and Housing in Southern Europe’, International Journal of Housing Policy, 6: 3, pp. 251-277.
Allen, J., Barlow, J., Leal, J., Maloutas, T. and Padovani, L. (2004), Housing and Welfare in Southern Europe, Wiley-Blackwell.
Anastassiadis, A. and Tsoukala, K. (2006), 'Évolution de la population et de l’habitat en Grèce', in C. Bonvalet and D. Arbonville (eds.), Quelles
familles? Quels logements? La France et l'Europe du Sud, Paris:
Institut National d'Études Démographiques, pp. 177-207.
Andrews, D. and Sánchez, A. (2011), 'The Evolution of Homeownership Rates in Selected OECD Countries: Demographic and Public Policy Influences', OECD Journal: Economic Studies, 2011/1, pp. 1-37.
Baldini, Massimo and Poggio, Teresio (2013), 'The Italian housing system and the global financial crisis', Journal of Housing and the Built
Environment, pp. 1-18.
Bielsa, Jorge and Duarte, Rosa (2011), ‘Size and linkages of the Spanish construction industry: key sector or deformation of the economy?’,
Cambridge Journal of Economics, 35: 2, pp. 317-334.
Bonoli, Giuliano (1997), 'Classifying Welfare States: a Two-dimension Approach', Journal of Social Policy, 26: 03, pp. 351-72.
Cabré, A. and Módenes, J. A. (2004), 'Home-Ownership and Social Inequality in Spain', in K. Kurz and H-P. Blossfeld (eds.), Home Ownership and
Social Inequality in a Comparative Perspective, Stanford: Stanford
University Press, pp. 233-54.
Castles, Francis G. and Ferrera, Maurizio (1996), 'Home Ownership and the Welfare State: Is Southern Europe Different?', South European Society
and Politics, 1: 2, pp. 163-85.
Doling, J (2012), 'Housing and demographic change', in R. Ronald and M. Elsinga (eds.), Beyond home ownership. Housing, welfare and society, London: Routledge, pp. 31-50.
Esping-Andersen, G. (1990), The Three Worlds of Welfare Capitalism, Princeton University Press.
--- (1999), Social Foundations of Postindustrial Economies, Oxford University Press.
European Mortgage Federation (2012), ‘Hypostat 2011, A Review of Europe's
Mortgage and Housing Markets’,
http://www.hypo.org/content/default.asp?PageID=524. Accessed 28 January 2013.
European Statistical System, ‘Statistics on Income and Living Conditions, Table “ilc_lvho02”’, http://appsso.eurostat.ec.europa.eu/nui/show.do? dataset=ilc_lvho02&lang=en. Accessed 15 February 2013.
Fenger, H. J. M. (2007), 'Welfare regimes in Central and Eastern Europe: Incorporating post-communist countries in a welfare regime typology',
Contemporary Issues and Ideas in Social Sciences, 3: 2, pp. 1-30.
Ferrera, Maurizio (1996), 'The “Southern Model” of Welfare in Social Europe',
Journal of European Social Policy, 6: 1, pp. 17-37.
Guerra, Isabel (2011), 'As políticas de habitação em Portugal: à procura de novos caminhos / Housing policies in Portugal: searching for new paths’, Cidades, Comunidades e Territórios, 22, pp. 17-37.
Haliassos, M., Karamanou, P., Ktoris, C. and Syrichas, G. (2008), 'Mortgage Debt, Social Customs and Financial Innovation', Working Paper Series,
Central Bank of Cyprus, 2008-2, pp. 1-47.
Hoekstra, Joris (2005), 'Is there a Connection between Welfare State Regime and Dwelling Type? An Exploratory Statistical Analysis', Housing
Studies, 20: 3, pp. 475-95.
--- (2010), Divergence in European Welfare and Housing Systems, Amsterdam: IOS Press.
Iacovou, M. and Skew, A. (2010), 'Household Structure in the EU', in A.B. Atkison and E. Marlier (eds.), Income and living conditions in Europe, Luxembourg: Publications Office of the European Union, pp. 79-100. Jovell, Albert J. (1995), Análisis de regresión logística, Madrid: Centro de
Investigaciones Sociológicas.
Kemeny, Jim (1981), The Myth of Home-ownership: Private Versus Public
Choices in Housing Tenure, London: Routledge & Kegan Paul.
--- (2001), 'Comparative housing and welfare: Theorising the relationship',
Journal of Housing and the Built Environment, 16: 1, pp. 53-70.
--- (2005), '"The Really Big Trade-Off" between Home Ownership and Welfare: Castles' Evaluation of the 1980 Thesis, and a Reformulation 25 Years on', Housing, Theory and Society, 22: 2, pp. 59-75.
--- (2006), 'Corporatism and Housing Regimes', Housing, Theory and Society, 23: 1, pp. 1-18.
Kemeny, Jim and Lowe, Stuart (1998), 'Schools of Comparative Housing Research: From Convergence to Divergence', Housing Studies, 13: 2, pp. 161-76.
Kolb, K., Skopek, N. and Blossfeld, H-P. (2013), ‘The Two Dimensions of Housing Inequality in Europe. Are High Home Ownership Rates an Indicator of Low Housing Values?’, Comparative Population Studies, 38: 4, pp. 1009-1040.
Leal, J. (2004), 'El diferente modelo residencial de los países del sur de Europa: el mercado de viviendas, la familia y el Estado / The different residential model of countries from southern Europe: the housing market, the family and the state', Arxius de Sociologia, 10, pp. 11-37. Malheiros, J and Fonseca, L. (Coord.) (2011), Acesso à habitação e
problemas residenciais dos imigrantes em Portugal / Access to housing and residential problems of immigrants in Portugal, Lisboa:
ACIDI.
Malpass, Peter (2011), ‘Path Dependence and the Measurement of Change in Housing Policy’, Housing, Theory and Society, 28: 4, pp. 305-319. Mandic, S. (2012), 'Home ownership in post-socialist countries: between
macro economy and micro structures of welfare provision', in R. Ronald and M. Elsinga (eds.), Beyond home ownership. Housing,
welfare and society, London: Routledge.
Menard, S. (1995), Applied Logistic Regression Analysis, California: SAGE Publications.
Minas, Christos, Mavrikiou, Petroula M. and Jacobson, David (2013), 'Homeownership, family and the gift effect: the case of Cyprus',
Journal of Housing and the Built Environment, 28: 1, pp. 1-15.
Módenes, J. A. (2012), 'Household Formation and Housing Tenure: a New Look to European Housing Systems', in ENHR (European Network on Housing Research), 24th Congress, Housing: Local Welfare and Local
Markets in a Globalised World, Lillehammer, Norway, 24-27 June,
ENHR: Delft.
Módenes, J. A. and López-Colás, J. (2012), 'El sistema residencial: un esquema conceptual para entender la relación dinámica entre población y vivienda en España / The residential system: a conceptual framework for understanding the dynamic relationship between population and housing in Spain ', Papers de Demografia, 400, pp. 1-30.
Módenes, J. A. and López-Colás, J. (forthcoming in 2014), ‘Cambio demográfico reciente y vivienda en España: ¿hacia un nuevo sistema residencial? / Recent demographic change and housing in Spain: towards a new residential system?’, Revista Española de
Investigaciones Sociológicas.
Mulder, Clara (2006), 'Population and housing: A two-sided relationship',
Demographic Research, 15: 13, pp. 401-12.
Mulder, Clara and Billari, Francesco (2010), 'Homeownership Regimes and Low Fertility', Housing Studies, 25: 4, pp. 527-41.
Myers, D. (1990), 'Introduction: The Emerging Concept of Housing Demography', in D. Myers (ed.), Housing demography: linking
demographic structure and housing markets, Wisconsin: University of
Wisconsin Press, pp. 3-34.
Nico, Magda (2010), 'Individualized Housing Careers in Early Adulthood: Conditions and Constraints in a Familistic Society', Sociological
Research Online, 15: 1, http://www.socresonline.org.uk/15/1/6.html. Accessed 10 February 2014.
Osborne, J. W. and Costello, A. B. (2004), 'Sample size and subject to item ratio in principal components analysis', Practical Assessment,
Research & Evaluation, 11: 9, http://pareonline.net/getvn.asp? v=9&n=11. Accessed 13 June 2013.
Poggio, T. (2008), 'The Housing Pillar of the Mediterranean Welfare Regime: Family, State and Market in the Social Production of Home Ownership in Italy', in OTB Research Institute for the Built Environment: Building
on Home Ownership: Housing Policies and Social Strategies, 13-14
November, OTB: Delft.
--- (2008), ‘The intergenerational transmission of home ownership and the reproduction of the familialistic welfare regime’, in Chiara Saraceno (ed.) Families, Ageing and Social Policy. Generational Solidarity in
European Welfare States, Cheltenham (UK) and Northampton (MA,
USA): Edward Elgar, pp. 59-87.
--- (2012), 'The housing pillar of the Mediterranean welfare regime: relations between home ownership and other dimensions of welfare in Italy', in R. Ronald and M. Elsinga (eds.), Beyond home ownership. Housing,
welfare and society, London: Routledge, pp. 51-67.
Ronald, Richard (2007), 'Comparing Homeowner Societies: Can we Construct an East-West Model?', Housing Studies, 22: 4, pp. 473-93.
Ronald, Richard and Elsinga, Marja (2012), ‘Beyond home ownership: an overview’, in R. Ronald and M. Elsinga (eds.), Beyond home
ownership. Housing, welfare and society, London: Routledge, pp.
1-28.
Stamsø, Mary‐Ann (2009), 'Housing and Welfare Policy – Changing Relations? A Cross‐National Comparison', Housing, Theory and Society, 27: 1, pp. 64-75.
Trilla, C. (2001), La política de vivienda en una perspectiva europea
comparada / Housing policy in a comparative European perspective,
Barcelona: Fundació “La Caixa”.
Vakili-Zad, Cyrus and Hoekstra, Joris (2011), 'High dwelling vacancy rate and high prices of housing in Malta a mediterranean phenomenon',
Journal of Housing and the Built Environment, 26: 4, pp. 441-55.
Yu, Zhou and Myers, Dowell (2010), ‘Misleading Comparisons of Homeownership Rates when the Variable Effect of Household Formation Is Ignored: Explaining Rising Homeownership and the Homeownership Gap between Blacks and Asians in the US’, Urban Studies, 47: 12, pp. 2615-2640.
Appendix
EU SEC Cyprus Greece Italy Malta Portugal Spain
Predictor Label n n n n n n n n Year 2005 197594 48957 3746 5568 22032 - 4615 12996 2009 223259 51710 3145 7036 19614 3641 4961 13313 Citizenship Native 38046 6 96554 6318 12037 40157 3558 9426 25058 Foreign 16602 3588 572 538 1216 82 139 1041 Age <25 12371 1337 34 338 681 20 48 216 25-34 44223 8339 619 975 3512 249 600 2384 35-44 75187 17836 1289 2029 7474 549 1433 5062 45-54 86342 19757 1547 2313 7739 752 1890 5516 55-64 80120 18828 1375 2221 7508 937 1897 4890 65-74 65231 17764 1125 2350 7341 606 1927 4415 >75 53730 16802 902 2378 7391 528 1777 3826 Educational attainment Lower than secondary 139488 56542 3043 6502 23768 2583 6269 14377 Secondary 161378 22181 2075 3089 11662 490 752 4113 Higher than secondary 105738 16880 1647 2567 5512 471 787 5896 Income Lower 104706 24980 1721 3121 10342 909 2393 6494 Lower-middle 104813 24980 1722 3117 10345 910 2394 6492 Upper-middle 104879 24987 1722 3120 10346 910 2395 6494 Upper 104854 24983 1722 3119 10344 910 2394 6494 Social environment Adequate 280789 64294 4153 8499 26814 1812 6265 16751 At least one problem 139851 36368 2738 4105 14832 1828 3311 9554
Dwelling type Detached 164705 27825 3403 4790 11143 219 4113 4157 Semi-detached 83574 22140 1939 1254 8763 1801 2595 5788 Apt. Build. < 10 dwellings 58152 23757 862 4021 10689 1517 1637 5031 Apt. Build. 10 > dwellings 110107 25631 518 2530 10039 83 1186 11275 Dwelling Quality Adequate 320293 74993 4397 9478 31248 3084 6701 20085 At least one problem 100536 25674 2494 3126 10398 557 2875 6224 Source: EU-SILC micro-data, 2005 and 2009, own calculations.
Table A1: Distribution of participant households in EU-SILC by predictors, European Union and southern European countries.
Owner (%) Rent market (%) Rent low market (%) Free (%) Missing (%) Total (%) n EU29 2005 72.29 14.39 5.95 7.34 0.03 100 197657 2009 75.58 13.02 5.46 5.87 0.08 100 223428 SEC 2005 76.74 10.23 4.12 8.91 0.00 100 48957 2009 77.30 10.23 4.59 7.89 0.00 100 51710 Cyprus 2005 70.98 9.58 0.75 18.69 0.00 100 3746 2009 69.73 7.12 0.64 22.51 0.00 100 3145 Greece 2005 77.08 14.40 1.67 6.84 0.00 100 5568 2009 75.92 17.27 0.61 6.20 0.00 100 7036 Italy 2005 74.22 11.30 5.21 9.28 0.00 100 22032 2009 76.11 11.45 4.86 7.57 0.00 100 19614 Malta 2009 74.92 1.70 17.11 6.26 0.00 100 3641 Portugal 2005 74.56 10.21 7.04 8.19 0.00 100 4615 2009 75.83 9.98 6.59 7.60 0.00 100 4961 Spain 2005 83.29 6.82 3.28 6.62 0.00 100 12996 2009 82.75 7.86 3.04 6.35 0.00 100 13313
Source: EU-SILC micro-data, 2005 and 2009, own calculations.
Table A2: Distribution of participant households in EU-SILC by tenure status (%), European Union and southern European countries, 2005/2009.
Country Headshiprates (%) headshipOwner rates (%) Renter headship rates (%) Non-headship rates (%) Home ownershi p rates (%) EU 38.91 29.43 9.48 61.09 75.58 SEC 37.85 29.26 8.59 62.15 77.30 Austria 43.19 23.35 19.84 56.81 54.07 Belgium 41.68 28.63 13.04 58.32 68.70 Bulgaria 37.27 32.32 4.95 62.73 86.72 Cyprus 33.88 23.62 10.26 66.12 69.73 Czech Republic 42.53 32.27 10.26 57.47 75.88 Denmark 39.04 28.29 10.75 60.96 72.47 Estonia 36.66 31.68 4.98 63.34 86.42 Finland 40.29 30.81 9.49 59.71 76.45 France 41.40 26.36 15.04 58.60 63.67 Germany 46.11 23.39 22.72 53.89 50.73 Greece 39.01 29.62 9.39 60.99 75.92 Hungary 39.56 34.98 4.59 60.44 88.41 Iceland 33.72 28.82 4.90 66.28 85.46 Ireland 41.00 32.01 8.99 59.00 78.06 Italy 39.76 30.26 9.50 60.24 76.11 Latvia 40.25 34.57 5.68 59.75 85.89 Lithuania 39.93 37.75 2.19 60.07 94.52 Luxembourg 37.25 24.52 12.73 62.75 65.83 Malta 35.72 26.76 8.96 64.28 74.92 Netherlands 41.07 29.17 11.89 58.93 71.02 Norway 39.23 32.88 5.37 60.77 83.83 Poland 34.31 23.51 10.8 65.69 68.52 Portugal 38.12 28.91 9.21 61.88 75.83 Romania 41.41 40.25 1.16 58.59 97.21 Slovak Republic 32.61 29.20 3.41 67.39 89.56 Slovenia 31.38 26.16 5.22 68.62 83.35 Spain 36.21 29.96 6.25 63.79 82.75 Sweden 40.91 28.13 12.64 59.09 68.76 United Kingdom 43.14 30.86 12.25 56.86 71.54 Source: EU-SILC micro-data, 2009, own calculations.
EU SEC Cyprus
Predictor -2LL Predictor -2LL Predictor -2LL
Dwelling type 390132.51 Citizenship 96702.33 Income 7110.71 Income 372849.54 Age group 94030.57 Dwelling type 6812.37 Age group 360067.31 Income 91372.65 Age group 6639.97 Citizenship 358331.04 Dwelling type 89596.12 Citizenship 6511.55 Dwelling quality 356823.25 Southern 88294.97 Dwelling quality 6482.74 Year survey 355993.76 Dwelling quality 87635.56 Education 6455.87 Social
environment - Social environment
-Education - Education
-Survey year
-Greece Italy Malta
Predictor -2LL Predictor -2LL Predictor -2LL
Age group 11648.34 Citizenship 42714.63 Income 3748.60 Citizenship 11049.41 Age group 41484.02 Dwelling type 3665.81 Dwelling type 10598.72 Income 40183.57 Dwelling quality 3625.50 Income 10461.39 Dwelling type 39162.69 Education 3596.87 Dwelling quality 10436.58 Dwelling quality 38959.46 Citizenship 3571.68 Education 38852.77 Age group 3538.33 Social
environment -Survey year
-Portugal Spain
Predictor -2LL Predictor -2LL Dwelling quality 8290.88 Citizenship 22002.14 Dwelling type 8008.08 Age group 21455.18
Income 7771.79 Income 20855.89
Age group 7650.95 Dwelling type 20658.09 Citizenship 7610.98 Dwelling quality 20461.32 Social
environment 7591.53 Social environment
(-) Variables excluded from the final models due to explanatory gain below 0.1%.
Source: EU-SILC micro-data, 2005 and 2009, own calculations.
Table A4: Likelihood values (-2LL) of the regression models of home ownership by
sociodemographic and residential characteristics, European Union and southern European countries, 2005/2009.
1 The proportions of population living in owned dwellings with a mortgage, ordered from higher to lower, are Spain (32.8%), Portugal (29.9%), Cyprus (16.8%), Italy (15.4%), Greece (15.4%) and Malta (15.2%) (Eurostat, SILC, table ‘ilc_lvho02’).
2 This article is focused on tenure status; in the near future, this will be complemented with an analysis of family roles in housing provision.
3 Additionally, once the EU-SILC 2013 data are available, it will be possible to compare under the same assumptions the home ownership patterns in three important periods: pre-crisis, starting of the crisis and deepest negative point of the crisis.
4 The variable Tenure status in EU-SILC (HH020) does not distinguish the owner's payment status. Another variable in the survey enables to identify the outright owners,
Arrears on mortgage or rent payments. Flag (HS010F). The label ‘-2’ explicitly refers to
‘outright owners or rent free during the last 12 months’ and combined with HH020 differentiates the two types of property. Variable HS010F has no data on Italian households.
5 Due to misreported values in EU-SILC, the ratios for Bulgaria and France are from Eurostat.
6The variable ‘dwelling quality’ was created from the original EU-SILC variables: leaking
roof, damp walls/floors/foundation, or rot in window frames or floor (HH040); bath or shower in dwelling (HH080) and problems with the dwelling: too dark, not enough light
(HS160). ‘Social environment’ was created from the original variables: noise from
neighbours or from the street (HS170); pollution, grime or other environmental problems
(HS180); and crime violence or vandalism in the area (HS190).
7 Some countries did not report or may have misinterpreted the questions: degree of urbanization, dwelling size and region. Therefore, degree of urbanization was used as control variable, dwelling size was replaced by household composition and also used as control variable and the region was excluded from this analysis.
8 Collinearity existed as follows: in Greece, covariates year, education and social
environment; in Spain, year and education; in Cyprus, year and social environment; and in Malta, social environment.
9 Despite agglomeration of Cyprus in cluster 1, the initial group of six countries was maintained in the exploration of housing features.