UNIVERSIDADE DE LISBOA FACULDADE DE CIÊNCIAS
DEPARTAMENTO DE BIOLOGIA ANIMAL
How different host genotypes alter the
virulence-transmission trade-off in Drosophila
melanogaster-Pseudomonas entomophila complex?
Nuno Filipe Gomes Martins
Mestrado em Biologia Evolutiva e do Desenvolvimento
Dissertação orientada por: Prof. Doutor Élio Sucena, FCUL, IGC Prof.ª Doutora Sara Magalhães, FCUL
i
AGRADECIMENTOS
Em primeiro lugar, gostaria de agradecer ao Professor Doutor Élio Sucena e à Professora Doutora Sara Magalhães por terem acreditado em mim e me terem dado a oportunidade inigualável de trabalhar neste projeto. Por tudo o que me ensinaram, por toda liberdade que ambos me deram para trabalhar, expor e discutir as minhas ideias e pelo interminável interesse que demonstraram no meu trabalho, ficará para sempre comigo e certamente que me será útil em muitos desafios. Os seus exemplos foram e são uma fonte de inspiração e motivação para mim. Espero ter estado à altura das suas exigências.
Aos meus colegas de laboratório por me ter recebido de uma forma tão calorosa, tenho, acima de tudo, que agradecer o companheirismo e a amizade que conto levar comigo. Em especial ao Gonçalo Matos e à Tânia Paulo, por terem sido os meus guias no laboratório, pelos conselhos e ajuda, que muito facilitaram a realização do meu trabalho. Ao Julien Marcetteau por ser uma das pessoas mais inteligentes e simpáticas que conheço, pela sua disponibilidade em me ajudar e discutir ideias e resultados comigo. À minha colega de mestrado e amiga Joana, que partilhou comigo os desafios de fazer uma tese de mestrado. Por todos os desabafos, conversas e discussões, obrigado.
Aos membros dos grupos Variation: Development and Selection e Development, Evolution and the Environment, pelas discussões, ajuda e tempos de pausa, que me deram ao longo de todo o trabalho. Às meninas da fly facitity por todas as vezes que me ajudaram.
Aos meus amigos, biólogos e não biólogos, muito obrigado por tudo! Espero que tenham aprendido que até as moscas são interessantes. A vossa amizade significa bastante para mim e trouxe-me força ao longo deste ano.
Por fim, por tudo o que são e significam, por terem feito a pessoa que sou hoje, um agradecimento ao meus pais e irmã e em especial à Catarina Rocha, que sem o apoio incondicional a realização desta tese provavelmente não teria sido possível. Foram vocês que me deram força para aguentar os feriados, fins-de-semana e longos dias no laboratório.
ii
ABSTRACT
Parasitism is seemingly the most common biological interaction that can be established between two organisms. Its importance and interest are not limited to the biological sciences field, but also to agriculture, livestock and human and veterinary medicine. Hence, the study of the interactions between parasites and host is necessary to comprehend and better fight infectious diseases. In these relations, a parasite takes advantage of the host by consuming its resources for its own benefit, such as reproduction and transmission to other hosts. By exploring host resources the parasite causes damage, which is usually called virulence.
The trade-off theory states that virulence is an unavoidable consequence of parasite transmission. Hence, a parasite cannot increase its transmission indefinitely because it causes increases damage to the host, which increases the probability of killing the host that compromises transmission. Studies that show this apparently simple constraint are scarce and few have explored the influence of the host genetic background in this model.
In this study, we make use of the pathosystem composed by Drosophila melanogaster and its natural pathogen Pseudomonas entomophila, through the natural oral route of infection, to test for a trade-off between these traits during infection. Moreover, we aimed to study how different host genetic backgrounds influence each trait and identify its putatively causative genes.
First, we established a protocol to accurately measure virulence and transmission in this system using an D. melanogaster outbred population. We verify a positive correlation between virulence and transmission. Second, we apply this protocol to different host genetic background. As in the outbred population, we find a positive correlation between traits. Moreover, we see that the host genetic background greatly influences the infection traits. However, our data do not fully corroborate the occurrence of a trade-off.
Additionally, we study the genetic bases that underlie the different susceptibilities to infection. Surprisingly, our results do not evidence any candidate gene related with immunity or gut development. Our results are still inconclusive and a complete dataset is required to fully address the questions we started off with. However, with this work, we have established an experimental system for the study of the correlation between virulence and transmission between D. melanogaster and P. entomophila. Moreover, our preliminary data showed that even in laboratory established systems there is still much to discover. Expectantly, future studies will address and answer questions that are in the basis of this project and that emerged from obtained results.
Key words: Parasitism; Trade-off virulence-transmission; Drosophila melanogaster; Pseudomonas
iii
RESUMO
Parasitismo é uma interação que envolve dois organismos, um parasita, que retira vantagens da interação às custas do hospedeiro. Mais precisamente, o parasita utiliza os recursos do hospedeiro para seu proveito, sobretudo para se reproduzir e ser transmitido. Nesta interação o parasita devido à exploração dos recursos causa dano ao hospedeiro, ao que habitualmente se chama virulência. A virulência de um hospedeiro pode ser considerada uma característica que comprometa a interação e, assim, desvantajosa para o parasita. Seria, então, de esperar que houvesse uma seleção de parasitas que não causassem dano no seu hospedeiro. No entanto, se esta característica desvantajosa estiver correlacionada com uma característica vantajosa para o parasita, melhor se explicaria a existência de virulência em relações parasíticas. É a partir desta hipótese que surge a teoria do trade-off.
A teoria do trade-off entre virulência e transmissão foi desenvolvido por Anderson e May, que no seu estudo correlacionam pela primeira vez o efeito do parasita no tempo de recuperação do hospedeiro. Esta hipótese defende a existência de uma relação de constrangimento entre as características de virulência e transmissão. Mais precisamente, que a virulência não pode aumentar indefinidamente sem comprometer a transmissão. O início da curva de trade-off é caracterizada por uma correlação positiva entre as duas características, em que o custo de aumentar a exploração dos recursos do hospedeiro, logo, a virulência, é acompanhado pelo aumento de transmissão. No entanto, esta curva satura, atingindo o valor ótimo, em que a transmissão é maximizada. A partir deste ponto o aumento da exploração de recursos leva a um aumento de virulência e a uma redução da transmissão, devido ao excesso de dano no hospedeiro pelo parasita, levando a que os hospedeiros morram antes do parasita ter oportunidade de se transmitir.
Apesar da simplicidade da hipótese de trade-off, estudos que demonstrem esta correlação são escassos. O primeiro caso de estudo foi desenvolvido nas décadas de 50 e 60 por Fenner e colegas. Os resultados destes estudos sobre o vírus de mixomatose em populações naturais de coelhos europeus (Oryctolagus
cuniculus), foram utilizados para fundamentar a hipótese do trade-off. Atualmente, novos estudos têm
caracterizado a correlação entre virulência e transmissão em diversos sistemas, estudando a influência de diferentes estirpes de vírus e da interação com organismos vetores na infeção de hospedeiros. No presente trabalho, de modo a testar a teoria do trade-off entre transmissão e virulência, caracterizámos esta correlação numa população geneticamente variável de Drosophila melanogaster. Como patogénico, recorremos a uma estirpe de bactéria que infecta populações naturais do nosso organismo, Pseudomonas entomophila. Os principais objetivos da tese são:
i. Desenvolver um novo protocolo que permita a medição de virulência e transmissão de um patogénio numa população outbred (com variabilidade genética) de D. melanogaster. E deste modo, caracterizar a relação entre as duas características no nosso complexo modelo.
ii. Estudar o efeito de diferentes backgrounds genéticos do hospedeiro nas medições de virulência e transmissão.
iii. Investigar as bases genéticas subjacentes aos fenótipos observados.
Para o novo protocolo, adaptámos um protocolo estabelecido e anteriormente utilizado do laboratório, que apenas nos permitia medir virulência, de modo a medir as duas características na mesma população e geração. De modo a distinguir entre indivíduos utilizados para medir virulência e indivíduos para medir transmissão, recorremos a uma segunda população com um fenótipo facilmente distinguível da primeira.
iv Estudámos a quantidade de bactéria presente em indivíduos infetados e caracterizámos a dinâmica da bactéria nas primeiras 72 horas após infeção. Observámos um decaimento constante da quantidade na população e o declínio do número de indivíduos infetados. Estes resultados vão de encontro a resultados anteriores que afirmam que a rápida eliminação da bactéria do sistema digestivo do hospedeiro contribui para a diminuição da mortalidade na população. Apesar da tendência de redução em toda a população, observamos a persistência de valores intermédios da quantidade de bactéria numa porção da população infetada (10%) nas últimas horas analisadas. Estes resultados parecem indicar a existência de tolerância no nosso sistema, visto que neste período a taxa de mortalidade é bastante reduzida.
Devido a constrangimentos temporais, ao medir virulência e transmissão na população outbred, apenas medimos valores de virulência na parte inicial do espectro (Virulência: 0.5-38%; Transmissão: 3.125-66.67%). Observamos no nosso sistema uma correlação positiva entre as duas características, o que vai de encontro ao que é proposto na hipótese de trade-off, referente à parte inicial da curva, e a resultados de estudos anteriores. No entanto, os nossos resultados não demonstram uma saturação da curva, igualmente teorizado. Isto deve-se, provavelmente, á falta de mais informação, nomeadamente níveis de virulência mais elevados que, teoricamente, comecem a comprometer a transmissão. Uma outra hipótese é que a correlação entre virulência e transmissão no nosso sistema não revele um trade-off. De modo a testar o efeito de diferentes backgrounds genéticos do hospedeiro nas características de uma infeção, recorremos às linhas DGRP (Drosophila Genetic Reference Panel). A população DGRP consiste em mais de 200 linhas inbred (com reduzida diversidade genética) derivadas de uma população natural (Raleigh, USA). Este painel permite o estudo do background genético para determinado fenótipo. Devido a todas as linhas estarem sequenciadas, este painel consiste numa livraria viva de polimorfismos, o que permite a realização de Genome Wide Association Studies (GWAS), de modo a identificar as bases genéticas de fenótipos observados.
Utilizando as populações DGRP como dadores de bactéria para uma segunda população, medimos virulência em 92 linhas do painel. Obtivemos percentagens de mortalidade ao longo de todo o espectro (2,1-98%). Confirmámos, que há influência da genética do hospedeiro na suscetibilidade a infeção. Para o fenótipo de transmissão, devido a constrangimentos temporais, apenas 7 linhas foram medidas em. Obtivemos medições de virulência e transmissão ao longo de ambos os espectros (2,1-87% e 3-87,5%). Apesar do reduzido número de pontos, observa-se uma correlação positiva entre as duas características. No entanto, este resultado tem de ser visto com cuidado devido ao reduzido número de pontos obtidos para caracterizar a correlação entre as características.
Utilizando os dados fenotípicos, realizámos o GWAS para o fenótipo de virulência. Obtiveram-se cerca de 26 SNPs significativos. No entanto, a maioria dos resultados centra-se em genes com função desconhecida e os restantes, não aparentam qualquer relação com imunologia ou alterações no sistema digestivo. A única exceção é o gene hs6t que está relacionado com o desenvolvimento da traqueia. Os principais resultados deste estudo têm de ser vistos com cuidado devido ao reduzido número de pontos utilizados para construir as duas correlações entre características. No que refere às curvas de correlação entre características, observa-se uma correlação positiva em ambas populações testadas. A falta de mais dados, quer de maior virulência, na população outbred, quer de um maior número de linhas testadas, no estudo usando DGRPs, pode ser apontada como a principal causa de ausência de curva de saturação. Uma outra causa para a ausência de uma curva no nosso sistema, pode dever-se a que o nosso sistema parasita-hospedeiro, seja caracterizado por um outro modelo que não uma curva trade-off. No que se refere aos estudos de bases genéticas, não se observaram resultados expectáveis. A ausência de resultados concludentes pode dever-se ao novo protocolo ou ao reduzido número de linhas testado. No
v entanto, este projeto permitiu o estabelecimento de um novo protocolo que permite a medição de transmissão utilizando o organismo modelo D. melanogaster, embora ainda precise de ser otimizado, constituindo uma ótima ferramenta para ajudar a compreender melhor a relação complexa que se estabelece entre hospedeiro e parasita num sistema controlado.
Palavras chave: Parasitismo; Trade-off virulência-transmissão; Drosophila melanogaster;
vi
INDEX
AGRADECIMENTOS ... i ABSTRACT ... ii RESUMO ... iii INDEX ... viLIST OF FIGURES ... viii
LIST OF ABBREVIATIONS ... ix
1. INTRODUCTION ... 1
1.1. Parasitism: virulence, transmission and the trade-off ... 1
1.2. Study System... 4
1.2.1. The host: Drosophila melanogaster ... 4
1.2.2. The pathogen: Pseudomonas entomophila ... 4
1.2.3. The model complex: Drosophila melanogaster - Pseudomonas entomophila ... 4
1.3. Objectives... 5
2. MATERIAL AND METHODS ... 6
2.1. The biological system ... 6
2.1.1. Drosophila melanogaster: Wild-type outbred population ... 6
2.1.2. Drosophila melanogaster: white outbred population ... 6
2.1.3. Drosophila melanogaster: DGRP lines ... 6
2.1.4. Pseudomonas entomophila ... 6
2.2. Oral infection ... 7
2.2.1. Previous protocol to measure virulence ... 7
2.2.2. New protocol to measure virulence ... 7
2.2.3. Protocol to measure virulence and transmission ... 8
2.2.3.1. Drosophila melanogaster: outbred population ... 8
2.2.3.2. Drosophila melanogaster: DGRP lines ... 8
2.3. Genome Wide Association Study ... 9
2.4. Statistical analysis ... 9
2.4.1. Survival curves and hazard ratios ... 9
2.4.2. Genome Wide Association Study ... 9
vii
3. RESULTS ... 10
3.1. Previous protocol ... 10
3.2. New protocol to measure virulence and transmission ... 10
3.2.1. Measurement of virulence: creating the 50% mortality baseline ... 10
3.2.2. The pathogen: dynamics and effect of Pseudomonas entomophila in infected flies ... 11
3.2.3. Dynamics of Pseudomonas entomophila in infected flies ... 14
3.2.4. Transmission ... 14
3.2.4.1. Testing virulence in the receptor population ... 14
3.2.4.2. Measuring transmission ... 15
3.3. The impact of host genetic background on virulence and transmission of Pseudomonas entomophila ... 16
3.3.1. Virulence ... 17
3.3.2. Transmission ... 18
3.3.3. Genetic basis of susceptibility to infection ... 18
4. DISCUSSION ... 21
4.1. Correlation between virulence and transmission - Outbred population ... 21
4.2. The dynamic of bacteria in infected flies ... 22
4.3. How different host genetic backgrounds influence the trade-off? ... 22
4.4. The genetic bases of virulence in Drosophila melanogaster ... 23
4.5. Conclusion and future perspective ... 23
REFERENCES ... 25
ANNEX ... 30
Protocols ... 30
Supplementary Figures ... 33
viii
LIST OF FIGURES
Figure 1.1. Trade-off curve. ... 2
Figure 1.2. Trade-off virulence-transmission. ... 3
Figure 1.3. Variability of susceptibility to oral infection with P. entomophila. ... 5
Figure 3.1. Survival Curve, Previous (P) vs Adapt (A) protocol. ... 10
Figure 3.2. Survival curves under different feeding conditions. ... 11
Figure 3.3. Quantity of bacteria in the filter paper discs through 24 hours. ... 12
Figure 3.4. Food dye in the gut is a poor indicator of feeding. ... 12
Figure 3.5. Bacteria load of infected flies. ... 13
Figure 3.6. Amount of bacteria outside infected flies. ... 13
Figure 3.7. Time-course of the bacterial load inside flies over 72 hours and survival curve over 5 days. ... 14
Figure 3.8. White outbred population survival upon P.entomophila oral infection. ... 15
Figure 3.9. Horizontal transmission of P. entomophila. ... 15
Figure 3.10. Trade-off hypothesis theoretical and experimental data. ... 16
Figure 3.11. Survival curves of DGRPs lines upon oral infection. ... 17
Figure 3.12. Contrasting survival analyses... 17
Figure 3.13. Measurements of virulence and transmission in DGRP lines. ... 18
ix
LIST OF ABBREVIATIONS
CFU Colony forming unit
DEL Deletion
DGRP Drosophila genetic reference panel
dpi Days post infection
GWAS Genome wide association study
INS Insertion
OD Optical density
1 1. INTRODUCTION
1.1. Parasitism: virulence, transmission and the trade-off
All organisms are in constant contact with other organisms whether they are from the same or from another species. Among these biotic interactions there is a specific set that is characterize by being long-term interactions between two organisms. These interactions are called symbiotic interactions1. There is
a spectrum of classifications that can be attributed to a symbiotic association2, but the vast majority
seems to fall into one of the following categories: mutualism, commensalism and parasitism3. Parasitism
is seemingly the most common biological interaction in the animal kingdom4,5 and describes associations
between organisms where one benefits at the expense of the other.
Some authors have argued that parasitism is the selective force behind some of the most important theories explaining the genetic diversity found in natural populations6–10 and the evolution and
maintenance of sexual reproduction7,11,12. Because of its biological, medical and economic importance,
parasitism is one of the most studied interactions13,14. The connection between parasite and host is
beneficial to the first but adverse to the second. The pathogen uses host resources for its own advantage, to reproduce and transmit. The harm that is done to the host is defined as parasite virulence, which ultimately can lead to the death of the host15–17.
From the parasite perspective the most favourable outcome is high reproduction rate and consequently increase the probability of transmission6. To this objective, the parasite increases exploitation of host
resources18, which leads to an rise in the parasite fitness. However, the increase exploitation of resources
has as consequence an increase in harm to the host. This harm can be so severe as to cause the death of the host. In most cases, this leads to the compromise of parasite transmission, hence, to a decrease in host fitness since the number of new infections will be reduced due to the host dying too quickly19.
There is thus a constraint between virulence and transmission during a parasitic interaction. This constraint is at the core of the Virulence-Transmission Trade-off hypothesis (Figure 1.1), a hypothesis first developed by Anderson and May (1982)6 and complemented by Ewald (1983)18. This hypothesis
was mostly based on the results from studies developed by Fenner6,18,20,21. They studied, through several
years, the evolution of the myxoma virus in natural populations of European rabbits (Oryctolagus
cuniculus) and in different regions of the world. In these studies, they observed that a single extremely
virulent strain (mortality>99%) when released into rabbit populations in Australia and Britain in the early 1950s, but over the next decade evolved to several different strains that have dissimilar stable levels of virulence20–22. At a later stage, they observed that this affects the number of vectors, mosquitos
and flies, which become infected and transmit the pathogen to susceptible hosts23. This system still
represents the most complete study that correlates virulence and transmission during infection, as they observe a correlation between the harm done to the host, the time it takes to recover from infection and the number of infected vectors (i.e. transmission)24.
2 This theoretical hypothesis postulates that there is an intermediate optimum point until which the transmission rate increases more rapidly than the cost. At the intermediate optimum value, the transmission is maximized and the parasite attain the most profitable deal. After that optimal point, increasing transmission is exceeded by the rise in the cost, meaning that the parasite is causing increased damage but less transmission. Indeed, since the harm is so great, it kills the host before the pathogen has the opportunity to infect other hosts, resulting in the decrease of transmission probability (Figure1.1)6,24– 26.
Despite the simplicity of this hypothesis, empirical data to support it is actually scarce. Recent studies have obtained data that corroborate this hypothesis24, others not24. These studies use different hosts and
vectors to analyse how virulence and transmission are correlated. Here we analyse the advantages and disadvantages of the main studies with empirical data that supports the trade-off hypothesis.
In the study made by Jensen and colleagues (2006)27, they used a less complex system where a bacterium
(Pasteuria ramose) is use to infect Daphnia magna. They study the correlation between the longevity of the host and the number of spores produced by the parasite. They observe a high variation in the time the bacteria takes to kill the host. Moreover, bacteria that kill hosts early or later, produce less spores when compared with intermediate level of virulence. These results suggest an optimum intermediate level of virulence for this system, when the transmission is maximized, which is postulated by the trade-off27. Hence, this study shows a positive correlation between traits in the initial part of the model,
followed by a saturation of the curve at intermedium levels of virulence and then a negative correlation in the final portion of the curve. However, in this system the spores are not release until after host death, which means that contrary to what is postulated by the trade-off hypothesis, host death do not compromise transmission.
An empirical test of the virulence-transmission trade-off was performed by de Roode (2008), in which they use several protozoan virus strains, Ophryocystis elektroscirrha, to infect monarch butterflies (Danaus plexippus)28. They demonstrated the existence of a trade-off which is caused in part by the fact
that transmission increases slower than linearly with the number of spores emitted from an infected insect (Figure 1.2). However, they measure transmission by quantifying the number of spores in eggs laid by infected mated females. Hence, this tests measured predominately the importance of vertical transmission instead of horizontal transmission like is postulate by the trade-off.
Figure 1.1. Trade-off curve. Taken from Anderson and May (1982)6. Relation between intrinsic reproductive rate, Ro, and
virulence, α. The Ro reaches a maximum value for an intermediate grade of virulence. The Ro can be seen has a proxy to transmission rate. Too high α kills off hosts too fast, diminishing the capacity to transmit the infection; but too low α corresponds again to weak transmission. Both lines correspond to empirical data.
3 More recently, Doumayrou and colleagues (2013)29 tested for the first time the existence of trade-off on
a plant pathogen. They infected Brassica rapa plants with nine natural isolates of Cauliflower mosaic virus. They estimated virulence on the individual host plants and for transmission they used the aphid vector Myzus persicae. As predicted by the trade-off hypothesis, they observed a positive correlation between traits at low virulence levels until an intermediate level of virulence where they observe the highest level of transmission. Although the data indicates a saturating of the curve, there is not a complete reversal in the correlation between the traits. This may be due to higher virulence levels, that would possibly compromise transmission, not being represented in this study.
Even though some studies have used systems that diverged from that used to established the trade-off hypothesis (see more in24), they still obtained similar correlation between traits, which may show some
flexibility of this model. Still, due to the difficulty to measure complex traits like virulence and transmission, empirical data that clearly demonstrate the trade-off are scarce25. Due to these factors there
have been an increase challenge to this hypothesis25,30.
One factor that may affect infection is the host genotype31. Indeed, for the pathogen’s not all hosts are
equal, hence including the genetic variability in studies will greatly increase the relevance of results obtained32. It has been demonstrated that host heterogeneity influences infections traits such as
virulence9,33, reservoir potential (i.e. specie that is infected and serves as a source of infection for another
specie)34 or transmission35,36. Particularly, the studies of Magwire (2012)9 and Bou Sleiman (2015)33 that
tested the outcome of infection with single strains of pathogen, virus and bacteria respectively, in different host genetic backgrounds, demonstrates the importance that host heterogeneity has to infection. They observed a strong influence of the host genotype in the susceptibilities to infection with either parasite. These results support the idea that the pathogen virulence is the admixture of several susceptibilities of the host.
Here, we aim to test the correlation between virulence and transmission in a Drosophila melanogaster pathogen, for the first time. Furthermore, instead of virus, that is the most commonly used in studies addressing the trade-off hypothesis20,21,28,29,37, we used a strain of a non-vector dependent bacterium, Pseudomonas entomophila. Therefore, we aim to characterize the interaction between virulence and
transmission in our less complex system (without a vector organism), like in the study of Jensen (2006)27, and, this way open the path for more complex studies. Thus, we hope to use the tools available
for our model system to shed some light on this specific system and more fundamentally, to better understand parasite biology.
Figure 1.2. Trade-off virulence-transmission. Taken from Alizon and Michalakis25. Graphical representation of the
4 1.2. Study System
1.2.1. The host: Drosophila melanogaster
Drosophila melanogaster, commonly known as fruit fly or vinegar fly, is a model system widely used
in biological research, including evolutionary and developmental biology. Because of its widespread use across many research areas, the model system D. melanogaster is ideal to address questions related to parasite infection. Specifically, because it is a model system for invertebrate immunity38 and given
the vast genetic tools available39, D. melanogaster stands out as a powerful model for the study of
host-pathogen interactions13,38,40,41.
Recently there have been studies that unravel the evolution of D. melanogaster responses to pathogens13
and how different infection routes impact on host evolution13. Despite the greater amount of systemic
infection studies (see more in13), injuries are probably not the most frequent source of pathogen entry
D. melanogaster, the lead role being played by ingestion13,38,42.
The Drosophila melanogaster Genetic Reference Panel (DGRP)39,43 lines are an excellent tool that
allows to decompose and analyse the genetic variability of a natural population. It consists of around 200 fully sequenced lines in which all individuals in each line are genetically equal and genetically different from all other lines. The combination of all lines is thought to represent the genetic variability of the original natural population from which they were derived.
The capacity to decompose the natural variation of a population and the possibility of study its different constituents individually, has constituted a major step in understanding the genetic bases of phenotypic variation. The DGRPs allows that complex and time consuming Genome Wide Association Studies (GWAS) to be done in a less time-consuming way. Recently, several studies have made use of this tool unravelling the genetic bases of phenotypes like sleep44, longevity45, growth46 and more recently, viral
and bacterial infection resistance9,33.
Conclusively, the specifics characteristics of these inbred fly lines allows assessment of the impact of infection on distinct but constant genetic backgrounds, in order to tease out the effect of the genotype from that of environmental factors39.
1.2.2. The pathogen: Pseudomonas entomophila
Pseudomonas entomophila is a Gram negative bacterium first collected from a fly in Guadeloupe47, that
is highly pathogenic for D. melanogaster, as well as for other insect species48,49. It has been shown that
P. entomophila infection causes severe irreversible intestinal epithelial damage50–54. Also, it is the only
Pseudomonas species capable of activating a systemic immune response, mainly through the Imd
pathway38,40, in both adult and larvae of D. melanogaster49. The complete sequencing of this bacterium
showed a metabolically versatility which allows the colonization of a large range of habitats, including soil, rhizosphere and aquatic systems48. Moreover, the analysed of the genome revealed the existence of
large sets of genes encoding putative virulence factors along with regulators that control their expression48.
1.2.3. The model complex: Drosophila melanogaster - Pseudomonas entomophila
As discussed above, it appears likely that the diversity in natural populations affects the infection dynamic between host and parasite. But studies that address the influence of host genetics the host-parasite relation are scarce. One study has associated the susceptibility to viral infection with genetic markers using the DGRP lines9. Moreover, recently Bou Sleiman and colleagues33 looked for differences
5 In this study, 140 DGRP lines were subjected to oral infection with P. entomophila (Figure 1.3)47. They
found a striking variation in survival, hence concluding for considerable genetic variation in susceptibility to enteric infection. From the GWAS results they conclude that differences in susceptibility to infection are probably due to multiple loci with relatively small effects. Further studies trying to characterize this associations might help us to understand better this complex interaction between pathogen and host.
1.3. Objectives
Theory predicts a transmission-virulence trade-off in a host-parasite interaction. Despite the rich body of literature (see above), studies that aim to correlate the traits of a host-parasite relation, and, in this way, address the trade-off hypothesis, are scarce. Moreover no study that addressed this hypothesis has resorted to the model organism D. melanogaster despite its intensive use in immunity studies55.
In this project, we aim to address this topic using a model system we have well established in the lab, composed of D. melanogaster and its parasite, the bacterium Pseudomonas entomophila.
In a first stage, we will expose an outbred population, by a natural route (ingestion), and measure virulence and transmission. We aim to establish a protocol that allows to measure virulence and transmission in the same population and generation.
In a second stage, we will use the optimized protocol and test different host genetic backgrounds. To this objective, we will infect the D. melanogaster Genetic Reference Panel (DGRP) lines with P.
entomophila and measure the same traits as before. Taking advantage of the knowledge we have about
the DGRP fly lines we will perform a subsequent genome-wide association study (GWAS) between the established phenotypes and underlying genetic variants (SNPs).
With this study, we aim to:
1) Produce a robust test to the trade-off hypothesis using the power of our
Drosophila-Pseudomonas model, and
2) Establish the first association between host genetic architecture and transmission and virulence of its pathogen.
Figure 1.3. Variability of susceptibility to oral infection with P. entomophila. Taken from Bou Sleiman (2015)33.
6 2. MATERIAL AND METHODS
2.1. The biological system
2.1.1. Drosophila melanogaster: Wild-type outbred population
An outbred population of Drosophila melanogaster was established in the laboratory in 2007, from 160
Wolbachia-infected fertilized females, collected in Azeitão, Portugal. Variability in this base population
was assessed using multiple methods, based on 103 SNPs located in the left arm of the 3rd chromosome13. It contains high and relatively constant levels of polymorphism. The population was
kept in laboratory cages for over 50 non-overlapping generations (generation time: three weeks) with high census (over 1500 individuals). Flies were maintained under constant temperature (25ºC), humidity (60–70%) and light-darkness cycle (12:12), and fed with standard cornmeal-agar medium.
2.1.2. Drosophila melanogaster: white outbred population
An outbred white population of Drosophila melanogaster was established through introgression of the
white gene into a wild-type outbred population during 12 generations using high census, in order to
conserve the genetic variability of the population56. The population was kept using the same procedure
as described in 2.1.1.
Because we are using two different groups of individuals with two dissimilar purposes we need to be able to easily distinguish them. We tested different methods to distinguish them, like clipping wings57,
sterile pricking or painting the wings57, but none was effective. Additionally, the first two approaches
may involve the activation of the immune system, since there is damage to the body. Consequently, we used a receptor population with a distinct phenotype against which both control and infected groups can be tested. Therefore we used white outbred population. This population allows us to maintain the genetic variability of the donor outbred population and to distingue the individuals for the two measurements.
2.1.3. Drosophila melanogaster: DGRP lines
The Drosophila Genetic Reference Panel (DGRP) lines were established from a natural population collected from Raleigh, North Carolina, USA, and inbred for 20 generations of full-sib mating, followed by random mating39. Most lines have been completed sequenced39,43. The DGRP is composed for more
than two hundred isogenic, all these lines have their genome sequenced and publically available so that Genome Wide Association Studies (GWAS) can be readily performed as to map phenotype to genotype. The population of each DGRP line was kept in laboratory vials with small census (between 10 and 30 flies). The small census does not present a problem since these lines are inbred, hence almost do not have genetic variability. Consequently, there is no risk of inbreeding depression. Flies were maintained under constant temperature (18ºC), humidity (60–70%) and light-darkness cycle (12:12), and feed with standard cornmeal-agar medium. The flies were flipped to new vials once every 21 days.
To select a subset of the DGRP, we used data from a study by Bou Sleiman (2015)33 in which a collection
of DGRP lines was orally infected with P. entomophila (Figure 1.3). From this data we selected lines that showed high, intermediate and low percentages of mortality upon infection. This way we expected to obtain information through the all spectrum of phenotypes.
2.1.4. Pseudomonas entomophila
P. entomophila was used to infect D. melanogaster populations. For each round of infection, bacterial
pathogens were grown in Luria Broth medium (LB) inoculated with a single bacterial colony, taken from solid medium cultures grown from glycerol stocks kept at -80ºC and streaked in fresh (1 week) Petri dishes supplement with rifampicin (0.5 mg/ml). P. entomophila was prepared from an overnight
7 culture grown exponentially at 28ºC, centrifuged and adjusted to OD600=110. The P. entomophila strain
existing in the lab was a generous gift from Bruno Lemaitre.
Moreover, the strain used is resistance to Rifampicin, which constitutes a major advantage to the project. Rifampicin is a potent and broad spectrum antibiotic used against bacteria. Is inhibits the bacterial RNA polymerase by blocking the elongation during transcription58. First, this resistance greatly reduces the
risk of contamination because we can use the antibiotic to prevent it; second, it allows for the plating of the entire fly and we may have confidence that the only bacteria growing from a plated homogenate is the bacteria of interest.
2.2. Oral infection
2.2.1. Previous protocol to measure virulence
Adult mated females’ flies with 4 to 6 days old were collected to vials containing clean food covered by a filter paper disc embedded in bacteria solution. The bacteria solution was prepared by mixing P.
entomophila solution (OD600=100) diluted 1:1 with sterile 5% sucrose solution13.
The control treatment, followed the same procedure except that the filter paper discs were soaked in a solution of sterile LB diluted 1:1 with sterile 5% sucrose and food colouring (Supplementary Figure 1). Mortality of these flies was followed for 5 days and virulence measured as the number of flies that died after exposed to the pathogen.
2.2.2. New protocol to measure virulence
Previous protocols were developed to obtain a control mortality of ca.70%, 5 days post infection (dpi) in the control population. As one of the main objectives of our study, we wanted to decrease this control mortality. In order increase the throughput of the procedure instead of using small vials (Supplementary figure 2A), we used bottles (Supplementary figure 2B). This alteration allowed us to increase the number of flies exposed to the pathogen by one order of magnitude. Moreover, we added a blue food dye (10 µl/ml) to the bacteria solution. This gives us a better control of ingestion at the individual and population levels.
Adult mated females’ flies with 4 to 6 days old were collected 24 hours later (in order not to recover from any influence of the CO2 used during collection), they were added to a bottle containing clean food
for the flies to have ample access to food.
To orally infect the flies, bottles were prepared with cotton with 3ml of sterile water and covered for 24 hours by filter papers soaked with a P. entomophila solution (OD600=110) diluted 1:1 with sterile 5%
sucrose solution (adapted from13). Also, a food colouring in a ratio of 10 µl of dye for 1 ml of bacteria
solution was added.
About 200 mated females were then added to the bottle containing the filter paper disc soaked with bacteria solution and transferred for 24 hours to a control environment of constant temperature (25ºC), humidity (60–70%) and light-darkness cycle (12:12). After this time interval, the infected flies were separated to vials containing normal clean food (Protocol 4).
The control treatment, followed the same procedure except that the filter paper discs were soaked in a solution of sterile LB diluted 1:1 with sterile 5% sucrose and food colouring.
Mortality of these flies was followed for 5 days and virulence measured as the number of flies that died after exposed to the pathogen.
8 2.2.3. Protocol to measure virulence and transmission
2.2.3.1. Drosophila melanogaster: outbred population Collection and infection was performed the same way as described in 2.2.2.
After 24 hours, 10 mated females flies of the outbred white population (receptor population) were transferred to each vials containing 10 infected flies of the outbred phenotype (donor population). The flies were transferred to the control environment for 24 hours. Afterwards, the flies were anaesthetized with CO2 and separated by phenotypes (wild-type/outbred and white) to different 1,5 ml eppendorfs and
kept on ice. Subsequently, the flies were sterilized following the protocol in Brummel59 and each fly
was individually homogenized in 100 ul of sterile LB. The homogenate was serially diluted and 4 or 5 ul droplets of homogenates were plated on LB agar plates, supplemented with 40 µg/ml Rifampicin and incubated at 30ºC overnight. The number of viable cells within an individual was estimated by counting the number of colony-forming units (CFUs) after incubation. The dilutions to be counted were chosen so that the colony counts ranged between 10 and 10013.
This procedure allowed us to measure virulence, as the number of flies from the donor population that die after exposed to the pathogen for 5 days, and transmission, as the number of receptor flies that have bacteria after 24 hours in the same vial as donor flies.
2.2.3.2. Drosophila melanogaster: DGRP lines
The lines were prepared 30 days before infection. Adults from DGRP line stock were transferred to vials with fresh food and yeast and flipped to new ones every 24 hours for 5 days. To maximize the number of eggs laid, the flies were kept at 25ºC. Afterwards, the adults were discarded. Once 10 days had elapsed, of the adults that ecloded, 30 females and 15 males were distributed over 3 bottles containing fresh food and yeast, on the ratio of 2 females per male. The bottles were transferred to 25ºC for 4 days. After which the adults were discarded.
Collection and infection was performed the same way as described in 2.2.2. After 24 hours, 10 mated females flies of the outbred white population (receptor population) were transferred to each vials containing 10 infected flies of the outbred phenotype (donor population). The flies were transferred to the control environment for 24 hours. Afterwards, the flies were anaesthetized with CO2 and separated
by phenotypes (wild-type/outbred and white) to different 1,5 ml eppendorfs and kept on ice. Subsequently, the flies were sterilized following the protocol in Brummel59. To quantify the number of
receptor flies with bacteria, we adapted a commonly used bacterial growth protocol60–62, and combined
it with the protocol to plate flies13.
The new protocol uses 96-well microtiters and resots to a smashes the flies. To quantify the number of receptor flies with bacteria we measured the Optical Densisty of each well. We measured immediately after smashing and at different time points. Any increase in the OD value is due to the presence of P.
entomophila, owing to the resistance marker. As confirmation of this hypothesis, we plated, on agar
plated supplemented with rifampicin, the solutions from wells in which the value was stable and others in which it increased. The results confirm that wells with stable values did not display any bacterial growth whereas wells with increase values exhibited CFUs (Supplementary Figure 11).
Consequently, flies were placed in a 2 ml 96-well plate with a metal orb and 50 µl of LB. The plate was then placed in the tessiulizer and the flies were smashed automatically. Afterwards, instead of serially diluting and plating the homogenates, we transferred 10-15 µl of the solution to 40-35 µl of LB-rifampicin to each well in a microtiter 96-well plate. Subsequently we measured the Optical Density (OD) at 600 nm. Afterwards, we transferred the microtiter plates to a growth environment at 30ºC.
9 Afterwards, at different time points, we measured the OD of each well on a microplate reader (Perkin Elmer Victor 3 Multilabel Plate Reader) (Supplementary Figure 10).
This procedure allowed us to measure virulence, as the number of flies from the DGRP population that die after exposed to the pathogen for 5 days, and transmission, as the number of receptor flies that have bacteria after 24 hours in the same vial as donor flies.
2.3. Genome Wide Association Study
The GWAS was performed after the measurement of the phenotypic traits in the DGRP lines. We used the phenotypic measures obtained from the virulence measurements and used the DGRPs database site to perform the GWAS39,43.
2.4. Statistical analysis
All statistical analyses were performed using the software R v3.2.5 (2016)63.
2.4.1. Survival curves and hazard ratios
The proportion of individuals surviving at day 5 after infection in each vial will be first estimate using the Kaplan-Meier method. Individuals alive at the end of the experiment, stuck in the food or escaped from vials during the period of observation were counted as censored observations13.
Due to differences in the positive controls in different tests with the DGRPs we used the Cox’s proportional hazard model in order to compare the survival of each line with its own control, with the positive control of each test as baseline and replicate vial nested within line as a random variable13. The
hazard ratio test calculates the probability of dying relative to the control64,65. This test permits us to
normalized and compared survival trajectories despite the differences in the positive controls13,14,66
(Supplementary figure 6-7).
These tests were done using the R libraries lme4 (v0.999999, generalized and linear mixed models), coxme (v2.2, mixed effects Cox proportional hazards model) and glht (v1.2, multiple comparisons)13.
2.4.2. Genome Wide Association Study
The results of the statistical tests applied in the GWAS data was provided in the delivery of the results from the database site39,43. No further analyses were performed in the dataset. For the GWAS a
Manhattan plot of the P-values for the association between genomic variants in DGRP lines and phenotypic information was made using the R library qqman33.
2.4.3. Graphic representation
10 3. RESULTS
One of the main objectives of this project was to develop a protocol that allows measurement of virulence and transmission in the model organism Drosophila melanogaster. Thus we sought to adapt the established protocol in our laboratory13,47 with two main objectives in mind:
i. measure both virulence and transmission in the same population and generation;
ii. have 50% mortality in an outbred population, in order to obtain the best baseline for the ensuing study with the Drosophila Genetic Reference Panel (DRPG) lines;
3.1. Previous protocol
One of the most used protocols to study immunity in arthopodes, focuses on the natural route of oral infection that pathogen takes to infect the host through the gut. This protocol, has been used in different studies, which provided a broad range of knowledge about D. melanogaster immunity13,33,47,54
(Protocol 1). Since this protocol is stablished in our lab13, we adapted it in order to develop a new
protocol to measure virulence and transmission.
3.2. New protocol to measure virulence and transmission
3.2.1. Measurement of virulence: creating the 50% mortality baseline
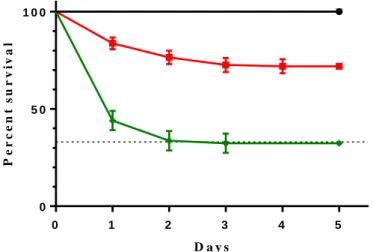
In a first test, we performed the infection using both protocols, the established and our adapted (Figure 3.1). We were able to reproduce the control mortality levels described before using the old method at 66-70% mortality (dotted line). As for the control mortality in our new method, it reached about 30%, 5 dpi. Hence our alteration to the protocol decreases the mortality of the outbred control population as desired but to an excessive degree.
Figure 3.1. Survival Curve, Previous (P) vs Adapt (A) protocol. Trajectories of survival of outbred control population
infected with entomopathogenic bacterium Pseudomonas entomophila using two different protocols, 5 dpi. For the P protocol: Gray line (behind black line), control treatment (n=100); Green line, infection treatment (OD600=100) (5 replicates; n=100).
For the A protocol: Black line, control treatment (n=159); Red line, infection treatment (OD600=100) (n=153). Vertical bars
correspond to standard error; the straight dotted line corresponds to the control percent survival of the previous protocol. For more information regarding statistical analysis see Supplementary table 1.
Subsequently, in order to increase the mortality as we wanted, we decided to change some steps of the protocol to try to raise mortality:
i. separated the flies 24 hours before infection;
D a y s P e r c e n t s u r v iv a l 0 1 2 3 4 5 0 5 0 1 0 0
11 ii. increased the concentration of bacteria solution to OD600=110 instead of OD600=100;
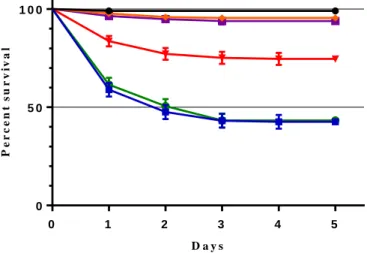
We tested these changes under different conditions inside the infection bottles. The simplest was adding cotton to the bottle with 3ml of sterile miliQ water, to keep the air moist for 24 hours. Other treatments consisted of i) a small portion of melted food, ii) the same melted food with dry yeast, iii) standard food and iv) standard food with dry yeast (Figure 3.2).
Figure 3.2. Survival curves under different feeding conditions. Trajectories of survival of outbred control population
infected with P. entomophila, 5 dpi. Black line, control treatment (n=196); the other treatments were all infections: Blue line, cotton condition (n=202); Red line, melted food (n=201); Orange line, melted food plus yeast (n=219); Green line, standard food (n=194); Purple line, standard food plus yeast (n=194). Vertical bars correspond to standard error. For more information regarding statistical analysis see Supplementary table 2.
As can be seen in Figure 3.2, the conditions greatly influence mortality. In all cases, there is a significant increase in mortality compared to the control (Supplementary table 4). Additionally, according to these results, yeast appears to mitigate the effect of infection (Orange and Purple lines). The most important result is that the changes could increase the mortality to the desired baseline, around 50%. The conditions of cotton and standard food (Green and Blue lines) present a mortality close to the intended. Moreover, we found no significant difference between placing the filter paper disc on top of standard food or wet cotton (p=0.8124). These results suggests that there is no real influence of food on fly mortality besides the maintenance of moisture inside the bottle. Subsequently, we adopted the simplest protocol (Supplementary Figure 3).
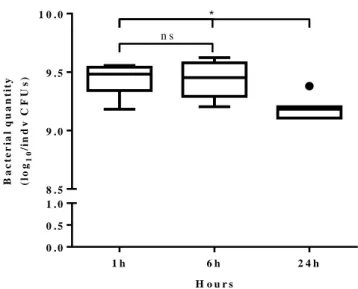
3.2.2. The pathogen: dynamics and effect of Pseudomonas entomophila in infected flies The main difference of our protocol to previous methods is the way by which the host is exposed to the pathogen. Importantly, we had to ensure the stability of the bacteria available in the medium over the course of the 24 hours (Protocol 2). Our results show, a significant decrease of quantity in the last hours (6 h vs 24 h, p=0.0226). However, we consider there is more than enough quantity of bacteria over the 24 hours of infection to expose all the individuals as their absolute numbers remain extremely high over the entire period (Figure 3.3).
D a y s P e r c e n t s u r v iv a l 0 1 2 3 4 5 0 5 0 1 0 0
12
Figure 3.3. Quantity of bacteria in the filter paper discs through 24 hours. Bacterial quantities in individual filter paper
discs (n=7 per time point) after dipping them in bacteria solution. The value of log10 was calculated after counting the number
of CFUs in a rifampicin agar plate, incubated at 30ºC overnight. Boxplots include median, 25-75% percentile and whiskers represent 95% confidence interval. The black dot represents an outlier value. Note that the Y axis has a gap. nsp-value>0.05; *p-value<0.05. For more statistic information, see Supplementary table 3.
Next we measured bacteria inside infected flies. One new component of the new protocol was the addition of a blue food dye, to obtain a visible evidence that the flies ate the bacteria solution. To test if the presence of dye in the gut correlates with the presence of bacteria we separated flies according to the presence or absence of dye in the gut and afterward plated them (Figure 3.4).
Figure 3.4. Food dye in the gut is a poor indicator of feeding. Bacterial loads in individual flies (n=20 per treatment) at 0h.
Flies were separated by the presence (black box) or absence (grey box) of food dye in the gut. The value of log10 was calculated
after counting the number of CFUs on rifampicin agar plate, incubated at 30ºC overnight. Boxplots include median, 25-75% percentile and whiskers represent 95% confidence interval. ns p-value > 0.05. For more statistic information, see Supplementary table 4.
We found no significant difference between dyed and non-dyed flies (p=0.9028) in the amount of bacteria they harbor. This shows that the blue food dye is not a good proxy for the infection status. Flies are able to clean P. entomophila from the gut after ca.16 h33. Moreover, food intake is blocked by P.
entomophila33,49. These two factors may explain the absence of dye in infected flies.
Given that the presence of blue dye is not a good indicator of infection status, we wondered what proportion of the 200 flies was infected. To determine this, we plated individually 50 flies per bottle, the maximum number of flies technically achievable. Moreover this test allowed us to assess the extent
H o u r s B a c te r ia l q u a n ti ty ( lo g1 0 /i n d v C F U s ) 1 h 6 h 2 4 h 0 . 0 0 . 5 1 . 0 8 . 5 9 . 0 9 . 5 1 0 . 0 n s * B a c t e r ia l q u a n t i t y ( l o g1 0 / i n d v C F U s ) D y e d N o n - d y e d 0 2 4 6 8 n s
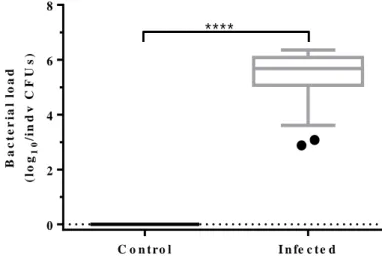
13 of variation of bacterial load in infected flies (Figure 3.5). Although the maximum number of flies tested is only a portion of the infected population, the fact that all tested flies had bacteria gives us some confidence to consider that, if not all, almost all infected flies have bacteria.
Figure 3.5. Bacteria load of infected flies. Bacterial loads in individual flies at 0 hours after infection. Control treatment
(black box, n=10); Infection treatment (grey box, n=40). The value of log10 was calculated after counting the number of CFUs
on rifampicin agar plate, incubated at 30ºC overnight. Boxplots include median, 25-75% percentile and whiskers represent 95% confidence interval. The black dot represents an outlier value. ****p-value < 0.0001. For more statistic information, see Supplementary table 5.
Above, we have determined the bacteria presence in the gut using a protocol (see M&M and Protocol 3), which removes bacteria associated to the surface of the flies. Our interest in bacteria that infect flies through the natural oral route has guided this choice. However bacteria on the outside the host may have some influence on transmission as they constitute a pool of available bacteria for cross-transmission68.
Therefore, to test for the presence of bacteria in the fly cuticula, we repeated the protocol but without sterilizing the flies.
Figure 3.6. Amount of bacteria outside infected flies. Bacterial loads in individual flies at 0 hours after infection. Control
treatment (n=10); Infection treatment: Clean, standard sterile flies (n=20); Non clean, non-sterile flies (n=20). The value of log10 was calculated after counting the number of CFUs on rifampicin agar plate, incubated at 30ºC overnight. Boxplots include median, 25-75% percentile and whiskers represent 95% confidence interval. ns p-value > 0.05; ****p-value < 0.0001. For more statistic information, see Supplementary table 6.
As before we found a significant difference between both treatments and the control (Figure 3.6;
p<0.0001). However, we could not detect significant difference between treatments (p=0.7853). Even
though there’s a slight increase in the non-sterile flies (Mean: Clean: 5.35 and Non Clean: 5.42), the
B a c t e r ia l lo a d ( lo g1 0 /i n d v C F U s ) C o n t ro l I n fe c t e d 0 2 4 6 8 **** B a c t e r ia l lo a d ( lo g1 0 /i n d v C F U s ) C o n t ro l S t e rilize d N o n S t e rilize d 0 2 4 6 8 * * * * n s
14 quantity of bacteria that is transported on top of flies is not significant and should have no impact on transmission in the following steps of our experimental procedures.
3.2.3. Dynamics of Pseudomonas entomophila in infected flies
To understanding how the bacteria load changes through time, we plated infected flies in intervals of 24 hours for three days. Since almost all mortality occurs within the first 3 days, we should expect the relevant alterations in bacterial load to take place within this period.
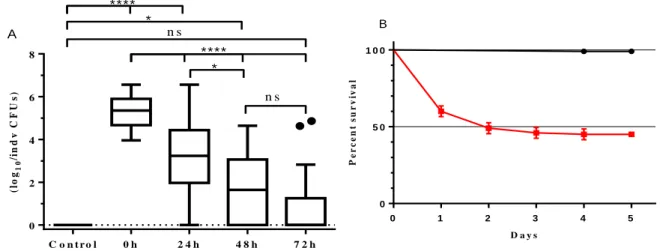
Figure 3.7. Time-course of the bacterial load inside flies over 72 hours and survival curve over 5 days. (A) Bacterial loads
of individual live flies in the course of 72h after infection. Control treatment (n=10); for the infection treatment: 20 flies were plated individually at 4 time points. The value of log10 was calculated after counting the number of CFUs on rifampicin agar plate, incubated at 30ºC overnight. Boxplots include median, 25-75% percentile and whiskers represent 95% confidence interval. The black dots represent outlier values. (B) Trajectories of survival of outbred control population infected with P. entomophila, 5 dpi. Black line, control treatment (n=203); Red line, infection treatment (n=200). Vertical bars correspond to standard error. ns p-value >0.05; *p-value<0.05; ****p-value<0.0001. For more statistic information, see Supplementary table 7.
The first 24 hours corresponds to the period with the highest decrease in mean bacterial load (Mean (0 h)=5.356 log10; (24 h)=3.018 log10; 40% decrease). After 24 hours, some flies successfully eliminated
the bacteria inside them (4 in 20). Despite the overall decrease in bacterial quantity, some individuals still present the highest amount of bacteria (more than 6 log10) observed at time point 0 h. This is not the
case at the 48 hours time point, when both the maximum quantity of bacteria per fly an the mean bacterial load decrease even further (Mean (48 h)=1.641 log10). Moreover, the number of bacteria free flies
increased (9 in 20). At the last time point both these trends continued with the mean bacterial load almost reaching 0 because 14 out of 20 flies have 0 CFUs and the bacterial load of the remaining flies is quite low (<10 on average). However, there are two outliers that present a bacterial load comparable with the prior time point (Figure 3.7.A).
Fly mortality takes place mostly in the first 24 hours after infection (Days 0-1, 40% decrease in live flies). After the first 24 hours the mortality rate decreased, up to 48 hours that represents just 11% decrease in survival, 3% until 72 hours, and 1% till the fifth day post-infection (Figure 3.7.B).
3.2.4. Transmission
3.2.4.1. Testing virulence in the receptor population
To measure transmission, we used a receptor population (white) that could be distinguised from the donor population
We then tested if the white mutation affected the phenotypes observed. We found a significant difference between the survival trajectories of the two populations (p=0.0002) when using our new adapt protocol
D a y s P e r c e n t s u r v iv a l 0 1 2 3 4 5 0 5 0 1 0 0 B B a c te r ia l lo a d (l o g1 0 /i n d v C F U s ) C o n t r o l 0 h 2 4 h 4 8 h 7 2 h 0 2 4 6 8 A n s * **** n s * ****
15 (Figure 3.8.A). Since this new protocol uses a food dye and the main difference between the populations are the eyes, we hypothesize that this might have some influence. For that reason we tested the populations using the previous protocol that does not use the food dye (Figure 3.11.B). The difference between the survival trajectories of the two populations was maintained (p=0.003).
Figure 3.8. White outbred population survival upon P.entomophila oral infection. Trajectories of survival of outbred
populations infected with P. entomophila. (A) Using the new protocol: Black line, wild-type outbred population, control treatment (n=196); Red line, wild-type outbred population, infection treatment (n=202). Grey line, white outbred population, control treatment (n=202); Green line, white outbred population, infection treatment (n=200). (B) Using the previous protocol: Black line, wild-type outbred population, control treatment (n=100); Red line, wild-type outbred population, infection treatment (n=120). Grey line, white outbred population, control treatment (n=100); Green line, white outbred population, infection treatment (n=80). Vertical bars correspond to standard error. For more information regarding statistical analysis see Supplementary table 8.
Regardless of the protocol we tested, there was a difference in the two populations regarding how they respond to infection. However, without other viable option, we used the white outbred population has the receptor population to measure transmission of the pathogen. Future studies to find other available options will be needed to optimize the protocol.
3.2.4.2. Measuring transmission
We tested transmission by mixing the infected D. melanogaster outbred control population with the uninfected white outbred population (Protocol 4). We determined survival and bacterial loads, as described before, in the receptor population 24 hours after joining the two populations (Figure 3.9).
Figure 3.9. Horizontal transmission of P. entomophila. (A) Trajectory of survival of outbred population infected with P.
entomophila, 5 dpi. Outbred control population: Black line, control treatment (n=201); Red line, infection treatment (n=201). Vertical bars correspond to standard error. (B) Bacterial load in individual flies at 24 hours post infection. Wild-type/donor population (n=15); White/receptor population (n=30). The value of log10 was calculated after counting the number of CFUs on rifampicin agar plate, incubated at 30ºC overnight. Scatterplots include median and whiskers represent 95% confidence interval. For more information regarding statistical analysis see Supplementary table 9.
D a y s P e r c e n t s u r v iv a l 0 1 2 3 4 5 0 5 0 1 0 0 A D a y s 0 1 2 3 4 5 B B a c t e r ia l lo a d ( lo g1 0 /i n d v C F U s ) W ild - t y p e /d o n o r W h it e /re c e p t o r 0 1 2 3 4 5 B D a y s P e r c e n t s u r v iv a l 0 1 2 3 4 5 0 5 0 1 0 0 A
16 Overall mortality in this test was relatively low. Regarding bacterial load in the receptor population (Figure 3.9.B), of the 30 flies from the receptor population tested for the presence of bacteria, 14 (47%) contained bacteria. In the donor population, of 14 tested flies, 3 were clean of bacteria after 24 hours and the mean and maximum values of bacterial load were around one order of magnitude below what we found in previous tests (see Figure 3.7.A). This result might be explained by some natural fluctuation of the infection protocol (Supplementary figure 1).
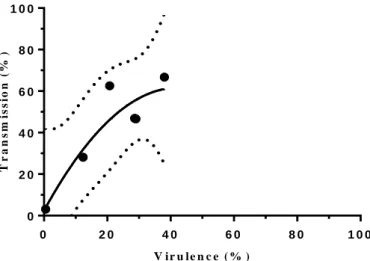
To correlate the two traits, we wanted to have measurements across the all spectrum of mortality. Because of the absence of available P. entomophila strains with different effects that we could use to measure various virulence percentages, we tested different quantities of bacteria to obtain different mortalities (Supplementary Figure 4).
Figure 3.10. Trade-off hypothesis theoretical and experimental data. Plot of transmission and virulence percentage of the
wild-type outbred population. Measurement of virulence of an infected population with P. entomophila and percentage of individual flies of the receptor population that tested positive for the presence of bacteria. For more information regarding statistical analysis see Supplementary table 10.
Due to lack of time we were unable to measure more than 6 points. Moreover, we were only able to measure transmission in cases with low mortality (Figure 3.10). As a result of this lack of data we can only do a comparison with the initial segment of the theoretical trade-off curve (Figure 1.1). Thus, to perform a stronger comparison between our system and the trade-off hypothesis, we require more data through the all spectrum of mortality.
3.3. The impact of host genetic background on virulence and transmission of Pseudomonas
entomophila
The protocol we stablished was then applied to test how different host genetic backgrounds affected the measurement of virulence and transmission. To this aim, we infected several lines of the Drosophila Genetics Reference Panel (DGRP).
Previous studies tested the lines for the effect of harboring the natural endosymbiotic Wolbachia in survival to infection and they did not detect any influence in susceptibility33,69. Likewise, the feeding
behavior and the endogenous microbiota of the DGRP lines were evaluated for biasing the results and for none was found an impact in the observed differences33.
We tested for differences in the initial pathogen load of infected DGRP flies. Overall, we did not see any differences in the initial pathogen load (Supplementary Figure 6). However, due to the small number
V i r u l e n c e ( % ) T r a n s m is s io n ( % ) 0 2 0 4 0 6 0 8 0 1 0 0 0 2 0 4 0 6 0 8 0 1 0 0