1
How phenotypic convergence arises in experimental evolution
12
Authors: Pedro Simões1#* & Inês Fragata1#*, Josiane Santos1, Marta A. Santos1, Mauro 3
Santos3, Michael R. Rose2 & Margarida Matos1 4
Affiliations: 1 cE3c – Centre for Ecology, Evolution and Environmental Changes, Faculdade de Ciências, Universidade de Lisboa, Campo Grande, 1749-016 Lisboa, Portugal, Tel: +351 21 75 000 00; 2 Department of Ecology and Evolutionary Biology, University of California, Irvine, CA, USA.; 3 Departament de Genètica i de
Microbiologia, Grup de Genòmica, Bioinformàtica i Biologia Evolutiva (GGBE), Universitat Autonòma de Barcelona, Spain.
*Corresponding authors: PS: [email protected], IF: [email protected] # both authors contributed equally to this work.
5
Data Accessibility Statement: Raw data is available at the Dryad Digital Repository 6
https://doi.org/10.5061/dryad.k69gf52. 7
8
Keywords: Convergent Evolution; Experimental Evolution; Drosophila subobscura; 9
Life-History traits; Long-term Evolution; Adaptation. 10
Accepted for publication in the journal Evolution. The final authenticated version is
11
available online at: https://doi.org/10.1111/evo.13806
12
Citation: Simões, P. & Fragata, I., Santos, J., Santos, M. A., Santos, M., Rose, M. R. & 13
Matos, M. 2019. How phenotypic convergence arises in experimental evolution. 14 Evolution 73-9: 1839–1849 https://doi.org/10.1111/evo.13806. 15 16 17 18
2
Abstract
19
Evolutionary convergence is a core issue in the study of adaptive evolution, as well as a 20
highly debated topic at present. Few studies have analyzed this issue using a “real-time” 21
or evolutionary trajectory approach. Do populations that are initially differentiated 22
converge to a similar adaptive state when experiencing a common novel environment? 23
Drosophila subobscura populations founded from different locations and years showed
24
initial differences and variation in evolutionary rates in several traits during short-term 25
(~20 generations) laboratory adaptation. Here we extend that analysis to 40 more 26
generations to analyze (1) how differences in evolutionary dynamics between 27
populations change between shorter and longer time spans, and (2) whether 28
evolutionary convergence occurs after sixty generations of evolution in a common 29
environment. We found substantial variation in longer-term evolutionary trajectories 30
and differences between short and longer-term evolutionary dynamics. Though we 31
observed pervasive patterns of convergence towards the character values of long-32
established populations, populations still remain differentiated for several traits at the 33
final generations analyzed. This pattern might involve transient divergence, as we report 34
in some cases, indicating that more generations should lead to final convergence. These 35
findings highlight the importance of longer-term studies for understanding convergent 36
evolution. 37
38
3 40
Introduction
41Understanding how populations adapt to environmental challenges is becoming 42
increasingly important in both evolutionary biology and conservation (Botero et al. 43
2015; Franks and Hoffmann 2012). However, we are still unsure how predictable 44
adaptation to novel environments is (Lachapelle et al. 2015; Lässig et al. 2017; Lenski 45
et al. 2015; Orgogozo 2015; Wiser et al. 2013). Unpredictability in evolution can be 46
caused by different genetic backgrounds due to prior evolutionary history (see Barton 47
and Keightley 2002; Barrett and Schluter 2008; Hansen 2013), and stochastic events 48
such as founder events, genetic drift, bottlenecks, etc. (see Lenormand et al. 2009). 49
Furthermore, interactions between selection and genetic drift may also increase 50
variation in evolutionary responses (e.g. Cohan 1984; Cohan and Hoffmann 1986; 51
Santos et al. 2012). 52
An important question when different populations adapt to new environmental 53
challenges is whether they will diverge or converge through time. Convergent evolution 54
is expected to arise through the action of natural selection, erasing differences between 55
populations (Endler 1986; Losos 2011; Stern 2013). Alternatively, differentiated 56
populations could conceivably evolve increased differentiation when placed under 57
similar selective regimes (Wright 1931; Cohan 1984; Whitlock et al. 1995). Discovering 58
the constraints that produce either evolutionary convergence or evolutionary divergence 59
is fundamental to ultimately understanding the foundations of adaptive evolution. 60
Experimental evolution is a powerful tool with which to address this problem, 61
especially by studying the real-time evolutionary trajectories of different populations 62
subjected to the same selective challenge. Several studies have observed convergent 63
4 evolutionary responses in a new common environment (e.g. Travisano et al. 1995; 64
Teotónio and Rose 2000; 2002; Joshi et al. 2003; Simões et al. 2007, 2008; Teotónio et 65
al. 2009; Santos et al. 2012; Fragata et al. 2014; Burke et al. 2016; Rebolleda-Gómez 66
and Travisano 2019). Nevertheless, divergent evolutionary responses have also been 67
observed (e.g. Cohan 1984; Cohan and Hoffmann 1986; Melnyk and Kassen 2011). 68
Furthermore, several studies support the notion that the impact of evolutionary 69
contingencies varies between traits closely or loosely related to fitness (Travisano et al. 70
1995; Teotónio et al. 2002; Joshi et al. 2003; Simões et al. 2008, 2017). It is thus clear 71
from experimental evidence that evolutionary contingencies have a role in shaping 72
evolutionary responses. 73
An important question, seldom addressed in the literature (but see Burke et al. 74
2016), is the effect of initial differentiation between populations on their long-term 75
evolution. In particular, it is expected that different initial genetic backgrounds will have 76
a higher impact during short-term evolution in a constant environment (Joshi et al. 77
2003; Fragata et al. 2014; Burke et al. 2016). On the other hand, at longer evolutionary 78
scales, the cumulative effects of genetic drift and other stochastic events acting on the 79
evolving populations will likely have a higher impact on the evolutionary trajectories 80
observed (e.g. see Brito et al. 2005; Lenormand et al. 2009). Furthermore, different 81
levels of standing genetic variation and/or epistatic interactions can have an important 82
impact on long-term evolution (Barrett and Schluter 2008; Goodnight 2015; Paixão and 83
Barton 2016; see empirical examples in Barton and Keightley 2002; Hansen 2013; 84
Wiser et al. 2013; Good and Desai 2015). This might produce differences between 85
populations, even in populations subject to similar selective pressures, possibly through 86
different timings in the deceleration of the evolutionary response over time, for example 87
5 (Teotónio and Rose 2000; Gilligan and Frankham 2003; Simões et al. 2007; Khan et al. 88
2011; Schoustra et al. 2012). 89
Long-term evolutionary dynamics have been mostly studied in microbial 90
experimental evolution systems rather than in sexual organisms, due to the shorter 91
generation time of the former. In the E. coli long-term evolution experiment performed 92
in Lenski’s lab, recent evidence indicates a deceleration of the evolutionary rate over 93
50000 generations (Wiser et al. 2013; Lenski et al. 2015). Furthermore, and perhaps 94
surprisingly, heterogeneity in evolutionary trajectories is still present after so many 95
generations, in part due to differences in mutation rates (Lenski et al. 2015). Several 96
studies with sexual organisms, though involving fewer generations, have also observed 97
the slowing down of evolutionary responses to newly imposed selection regimes (e.g. 98
Gilligan and Frankham 2003; Rose et al. 2004; Simões et al. 2007, see below). The 99
expectation of a deceleration of laboratory evolutionary trajectories in sexual organisms 100
is sometimes justified in terms of temporal exhaustion of additive genetic variance, 101
although genomic scans in experimentally evolved Drosophila populations have found 102
only limited evidence of fixed alleles following selection (Burke et al. 2010; Burke and 103
Long 2012; Orozco-Terwengel et al. 2012; Long et al. 2015; Phillips et al. 2016; Seabra 104
et al. 2018). In a previous study by our team, we found evidence for a deceleration in 105
the evolutionary trajectory of fecundity in populations of Drosophila subobscura 106
evolving for more than 80 generations in the lab environment (Simões et al. 2007). 107
Teotónio and Rose (2000) also found this pattern of response in several D. 108
melanogaster lines undergoing reverse selection in their ancestral environment. Gilligan
109
and Frankham (2003) also reported a slowing down of the rate of adaptation to captivity 110
after 87 generations in the lab by comparing Drosophila populations in different stages 111
of adaptation. However, this pattern is not universal, as other experimental studies have 112
6 not found such deceleration of the evolutionary response, even after a higher number of 113
generations. One example of this is the work of Chippindale et al. (1997), who imposed 114
selection for accelerated development time in D. melanogaster. Nevertheless, studies of 115
long-term experimental evolution in sexual species are scarce and have not specifically 116
addressed the variation in evolutionary dynamics that might occur during evolution over 117
the short term, relative to longer evolutionary time periods. 118
We have previously shown variation in the evolutionary response of several 119
populations of D. subobscura during the first 20 generations of evolution in a new 120
environment, the lab (Simões et al. 2008). These populations were founded from 121
different nearby locations over several years. We observed higher variation in the 122
evolutionary response for female starvation resistance, a trait likely more loosely related 123
to fitness in our experimental setting. By contrast, patterns for fecundity traits, which 124
are expected to be closer to fitness, were more repeatable. Importantly, the different 125
starvation resistance patterns led in fact to convergence between populations. In this 126
study we extend the earlier analysis to cover around forty additional generations. We 127
address the following questions: (1) How much do evolutionary rates vary between 128
short-term and longer-term evolution? (2) Do differences in evolutionary dynamics 129
between populations change in the transition from earlier to later generations? (3) Is 130
convergence observed after sixty generations of evolution in a common environment? 131
132
We expect that, during short-term evolution, variation in the initial genetic 133
backgrounds will lead to disparate rates of adaptation to the new environment. Over the 134
longer term, as the evolutionary response decelerates, differences between populations 135
of contrasting initial genetic composition are likely to be reduced relative to those 136
observed during short-term evolution, particularly if populations are evolving towards 137
the same phenotypic optimum. 138
7 139
140 141
Materials and Methods
142143
Founding and Maintenance of the Laboratory populations
144 145
Five sets of wild-caught samples of Drosophila subobscura were analyzed in this 146
study. These populations were founded in 1998 (NW populations; see Matos et al. 147
2002), 2001 (AR and TW populations; see (Simões et al. 2007), and 2005 (FWA and 148
NARA; see (Simões et al. 2008). NW, TW and FWA populations were collected from a 149
pinewood near Sintra (Portugal), whereas AR and NARA populations were collected 150
from a pinewood in Arrábida (also from Portugal, some 50 Km from Sintra, on the other 151
margin of the Tagus river; see Simões et al. 2007, 2008). All populations were three-152
fold replicated two generations after founding (e.g., FWA1-3 designating the three 153
populations of FWA). A set of long-established laboratory populations (called “NB”, 154
founded in 1990 from Sintra) was used as a control for all the experimental populations. 155
NB populations were at their 90th, 136th and 181st laboratory generations at the time of 156
foundation of the 1998, 2001 and 2005 collections, respectively. 157
All populations were maintained under the same laboratory environment with 158
discrete generations of 28 days, reproduction close to peak fecundity, controlled 159
temperature of 18ºC, with a 12-h L: 12-h D photoperiod. Flies were kept in vials, with 160
controlled densities for both adult (around 50 individuals per vial) and larval stages 161
(around 80 per vial). At each generation, emergences from the several vials of each 162
replicate population were randomized using CO2 anesthesia. Census population sizes 163
ranged between 600 and 1200 adults. To study the evolutionary trajectories during 164
laboratory adaptation, all experimental populations and the controls were periodically 165
assayed for several phenotypic traits (see below). 166
8 167
168
Phenotypic Assays and Generations analyzed
169
For the phenotypic assays, mated pairs of flies were transferred daily to fresh 170
medium and the number of eggs laid per female was counted during the first 12 days 171
since emergence. After the fecundity assay, each pair of flies was transferred to a vial 172
containing plain agar medium to measure starvation resistance (with deaths checked 173
every 6 h). Five characters were analyzed: age of first reproduction (number of days 174
between emergence and the day of first egg laying), early fecundity (total number of 175
eggs laid during the first week), peak fecundity (total number of eggs laid between days 176
8 and 12), and female and male starvation resistance. Sample sizes ranged between 14 177
and 24 pairs per replicate population and assay. All assays involved synchronous 178
analyses with NB populations. 179
Periodical phenotypic assays were performed starting at generation 3 or 4 up to 180
generation 58-60. All generations assayed for the several populations are presented in 181
Table S1. We analyze here both short-term - ~20 generations - and a longer-term period 182
- between ~20 and ~60 generations, here designated “long-term” - of laboratory 183
evolution of these populations. We also analyzed the entire evolutionary trajectory, 184
spanning the complete data set. The short-term data was studied in Simões et al. (2008) 185
for a larger number of populations, the five sets of populations referred to above and an 186
extra set of populations in each of the 2005 locations (details in Simões et al. 2008). 187
Moreover, for NW there were five replicate populations with data on short term, but 188
here we only analyze three replicate populations, for both short and long-term, as only 189
these have data for more advanced generations. Finally, we expand our analyses to 190
include male starvation resistance data, which was not analyzed in Simões et al. (2008). 191
9 In order to calculate the initial or final state for each replicate population, we 192
calculated the mean value of the 2 (or 3) first (or last) generations by choosing 15 193
random individual data points (with replacement) of each generation involved. The 194
initial generations used were the following: 4, 6 and 7 for AR and TW; 4 and 8 for NW; 195
3, 6 and 10 for NARA and FWA. The final generations analyzed were: 48, 55 and 60 196
for AR and TW; 52, 53 and 58 for NW; 49 and 58 for NARA and FWA. 197
198
Statistical Methods
199
To estimate the evolutionary trajectories for each population, in each assayed 200
generation, we used the differences between individual data and the mean of the same-201
numbered NB replicate population (assayed synchronously with experimental 202
populations; e.g. AR1-average NB1), see (Simões et al. 2008). This was done to remove 203
the effect of possible temporal changes not related to laboratory adaptation such as 204
trends due to environmental variation or to inadvertent evolutionary changes not 205
intended in the study (e.g. due to slight changes of conditions in lab). This procedure 206
also minimizes the effects of environmental heterogeneity between non-synchronous 207
assays (see also Matos et al. 2002; Simões et al. 2007, 2008). Temporal performance of 208
the control populations was generally quite stable across traits, allowing us to rule out 209
undesirable sources of variation such as those due to further laboratory adaptation or 210
inbreeding (see Fig S1). 211
Linear and linear-log models were tested for both periods separately and over the 212
whole evolutionary trajectory of the populations (around 60 generations). Models were 213
chosen according to their fit to the data based on R2 values (see Table S2). For the 214
separate analyses of short-term and long-term periods, we chose the linear over the 215
linear-log model as a compromise across populations and periods, since the same model 216
10 had to be applied to allow for direct comparisons between periods (e.g. for the tests in 217
Table 1 and 2). For the analysis of overall trajectories, the linear-log model was chosen, 218
as it generally presented a better fit than the linear model (see Table S2). 219
220
Bootstrap Techniques
221
Variation in the slope of evolutionary response between sets of populations and periods 222
was studied using bootstrap techniques as in Simões et al. (2008). Briefly, for each 223
replicate population we estimated the intercept ( 0), evolutionary slope ( 1) and the 224
residuals of each point () using a simple linear regression. In each iteration of the 225
bootstrap, a new vector of phenotypic data was created by resampling the residuals, 226
with replacement (*) and employing the following formula to calculate a new 227
phenotypic value for each data point used: 228
1) y* = 0+ 1x Generation + * 229
After this, a new slope (1*) and intercept (0*) were estimated through a linear 230
regression. For the linear-log model the same analysis was applied using the natural 231
logarithm of the generation. A total of 10000 slopes were generated for each replicate 232
population. All analyses testing differences between slopes were done using these 233
values. 234
To compare two sets of populations from the same location in different years, we 235
calculated the mean of each set involved in the comparison (by randomly sampling one 236
slope from each replicate population) and the difference between them (e.g. comparison 237
Arrábida 2001 vs. Arrábida 2005: ((AR11* + AR21* + AR31*)/3) – 238
((NARA11*+NARA21*+NARA31*)/3). This process was repeated 10000 times. 239
Statistical significance was assessed by estimating the fraction of these 10000 240
differences that were greater than zero. Two times this fraction or 1 minus two times 241
11 this fraction (whichever is less) corresponds to the P-value. To compare differences 242
between the two locations we used all 2001 and 2005 replicate populations from each 243
location. NW data was not included as there were no corresponding populations 244
founded in Arrábida in 1998. We calculated the location means using data of six 245
replicate populations (e.g. FWA1-3 and TW1-3 for the Sintra slopes), again using random 246
samples of slopes from each replicate population, as above. Differences between the 247
short and long-term evolutionary response for each set of populations were also 248
assessed (e.g. comparison of TW1-3 short-term slopes vs TW1-3 long-term slopes). We 249
further analyzed whether differences between periods varied between populations 250
founded from distinct years or locations. These comparisons followed the same 251
rationale as above (e.g. comparison short vs long-term for Arrábida 2001 vs Arrábida 252
2005: ((AR11*S+ AR21*S+AR31*S)/3– (NARA11*S + NARA21*S +
253
NARA21*S)/3)- ((AR11*L+ AR21*L+AR31*L)/3– (NARA11*L + NARA21*L +
254
NARA21*L)/3). This analysis was performed with 10000 random samples and tested as
255
described above. 256
To test whether populations differed in the initial or final performance, 10000 257
comparisons between years and locations were assessed using the same rationale as 258
above. 259
When testing for differences between populations statistical significance is presented 260
both with and without False Discovery Rate (FDR) correction for five tests (theorem 1.3 261
Benjamini and Yekutieli 2001). Marginally significant results after FDR correction will 262
also be considered when the general reading justifies, i.e. if there are consistent patterns 263
across populations. This is a compromise, as being too conservative also has drawbacks, 264
given that the focus of this study is not on single tests but rather to analyze patterns 265
across comparisons. 266
12 All analyses were performed using R version 3.3.1 (R Core Team 2018), package 267
reshape2 (Wickham 2007) and visualization was done using ggplot2 package (Wickham 268 2009). 269 270
Results
271Initial differences between populations
272
The experimental populations were clearly differentiated from the control 273
populations in the initial performance of fecundity traits, though less so for starvation 274
resistance (Fig 1 and 2). NW populations performed significantly better than the other 275
Sintra populations, both in age of first reproduction and early fecundity, whereas they 276
performed worse for male starvation resistance (see Table S3 and Figs 1 and 2). Most 277
populations from different years showed significant differences in the initial 278
performance for peak fecundity and female starvation resistance. On the other hand, no 279
significant differences were found between locations for any trait (see Table S3). 280
281
Short-term Evolutionary Dynamics
282
In general, fecundity-related traits, particularly early fecundity, show a clear 283
evolutionary increase in performance during short-term evolution across populations, 284
with a tendency to converge to control values, although at different rates (see Fig 1 and 285
below; see also Fig S2, for data on the mean and variation of slopes of replicate 286
populations). In contrast, patterns for starvation resistance are less consistent. In fact, 287
male starvation resistance does not show a noticeable evolutionary response, although 288
there is a suggestion of increased starvation across generations for all sets of 289
populations except AR (see Fig 2 and Fig S2). The evolutionary response of female 290
starvation resistance varies greatly among sets of populations with patterns of stasis 291
13 (AR and TW), decreased (FWA and NARA) and increased performance (for NW). In 292
spite of these differences, the patterns are again of convergence to control values (see 293
Fig 2, S2 and below). 294
When comparing the evolutionary response among populations, we observe 295
significant differences of slopes between years (see Table 1). This variation is 296
particularly evident for female starvation resistance, in agreement with our previous 297
analysis (Simões et al. 2008). On the other hand, for male starvation resistance no 298
significant variation in the evolutionary response was found. Significant differences 299
between locations were only observed for peak fecundity (see Table 1). 300
Interestingly, of the eight comparisons showing significant (or at least marginally 301
significant, after FDR correction) differences between populations in short-term 302
dynamics across all assayed traits (Table 1), six of these showed also significant 303
variation in initial performance (cf. Table 1 and Table S3). This concordance 304
corresponded to a reduction of differences between populations through time for age of 305
first reproduction and female starvation resistance. In contrast, for early fecundity, a 306
higher initial performance of NW relative to TW or FWA was followed by faster 307
improvement through time increasing the initial differences, leading at least to transient 308
divergence between populations (Table 1 and Table S3, Fig 1 and 2). 309
310
Long-term Evolutionary Dynamics
311
In each set of populations there was a clear variation of evolutionary rates (slopes) 312
between the short-term and the long-term period for age of first reproduction, early 313
fecundity and female starvation resistance (Table S4). This corresponded to a general 314
slowing down of the evolutionary response as populations tended to converge to the 315
14 control values (see Figs 1, 2 and S2; Fig S3 shows the same pattern in the evolutionary 316
trajectories using all generations). 317
Differences in evolutionary dynamics between sets of populations were more evident 318
in the long-term than in the short-term evolutionary response for several traits, 319
particularly for early fecundity (see Table 1; Figs 1, 2 and S2). For this trait, a 320
significant effect of location was due to a higher evolutionary rate in Sintra populations. 321
Also, several comparisons showed significant effects of year, due in part to a lower 322
slowing down of the response of the 2001 populations. On the other hand, differences 323
between populations in the evolutionary response of female starvation resistance 324
decreased in this period with only two significant effects in five comparisons– see Table 325
1. These significant effects involved comparisons with NW, which showed a clear drop 326
in performance during this later period (see Fig 2). 327
When comparing the variation in evolutionary rates of the different sets of 328
populations between the two periods (short vs. long-term evolution), early fecundity and 329
female starvation resistance showed the greatest differences between populations, due to 330
the above mentioned differential slowing down of response for early fecundity during 331
long-term evolution and to the reported high variation in evolutionary rates seen in the 332
short term evolution of female starvation resistance (Figs 1 and 2, Table 2). Importantly, 333
for early fecundity, populations with higher short-term evolutionary rates (NW and the 334
two 2005 populations) were also those with a stronger slowing down in the long-term 335
period (Fig 1), which is expected under convergent evolution (see below). 336
337
Final differences between populations
338
In more advanced generations, there was a loss of the initial differences between 339
populations for several comparisons, as expected if full convergence occurs (see Table 340
15 S3). This was observed between NW and TW for all fecundity traits, between NW and 341
FWA for age of first reproduction, and between the 2001 and 2005 populations for 342
female starvation resistance (Table S3 and Figs. 1 and 2). Nevertheless, significant 343
differences in final performance were also found for several comparisons (see Table 344
S3). In some cases, differentiation was also present at the start. Three temporal patterns 345
were observed taking into account initial, intermediate, and final values (see Table S5): 346
1- continuous reduction of differences (NW versus TW for male starvation resistance); 347
2- increased differences through time (TW versus FWA for peak fecundity); 3- 348
differentiation at the initial and final generations but with intermediate loss of 349
differentiation (NW versus FWA for early fecundity and female starvation resistance). 350
Finally, in other comparisons there was a significant (or at least marginally significant 351
after FDR correction) differentiation between populations at the later stage of 352
adaptation, not present at the start (Table S3). In this case two temporal patterns were 353
observed (see Fig 1 and Table 1, S3 and S5): 1- higher differences at the end than at 354
intermediate or initial generations (Arrábida versus Sintra populations for early 355
fecundity and NW versus FWA for peak fecundity); 2 - - higher differences at 356
intermediate generations than at the end of the study due to a differential slowing down 357
of the evolutionary rate (between the two sets of Arrábida populations for age of first 358
reproduction and early fecundity; in both cases differences are marginally significant 359
after FDR correction). 360
361
Overall Evolutionary Dynamics
362
Evolutionary trajectories across the entire time span confirm a general deceleration 363
of the evolutionary response through time, as populations evolved towards the control 364
values (see Fig S3). This led to a generally better fit of the overall evolutionary 365
16 trajectory to a linear-log model relative to a linear one, particularly for fecundity-related 366
data (see Table S2). Differences between sets of populations in the overall evolutionary 367
response were due to variable changes between short and long periods, leading to 368
pervasive contrasts, particularly for early fecundity (see Table 1 and S6). 369
370
Discussion
371Evolutionary convergence is a core expectation for adaptive evolution in a 372
similar environment (Losos 2011; Stern 2013). With a smooth fitness landscape, that 373
lacks multiple peaks, populations will tend to evolve to the same outcome (Wright 374
1931). In such cases, the outcome of evolution will be predictable. The predictability of 375
evolution is an issue of much interest at present (e.g. de Visser and Krug 2014; 376
Orgogozo 2015). Experimental evolution is a great tool for testing whether adaptive 377
evolution involves smooth or rugged landscapes, as it allows us to study the fate of 378
populations initially differentiated when subject to similar selective pressures, 379
especially whether they evolve towards similar or different fitness values (Fragata et al. 380
2018; Matos et al. 2015; Orgogozo 2015; Rebolleda-Gómez and Travisano 2019). Here 381
we add to the previous Simões et al. (2008) study the analysis of c. 40 more generations 382
of laboratory adaptation, in order to determine whether: 1) longer-term evolution leads 383
to similar outcomes as short-term evolution; 2) populations will ultimately tend to 384
converge or show more complex evolutionary patterns. 385
In this study we found a general pattern of convergent evolution, with clear changes 386
in the evolutionary rates between the short-term (~20 generations) and longer-term (~60 387
generations) periods. We observed a slowing down of the evolutionary response 388
through time for several traits as populations approached the evolutionary equilibria of 389
long-established populations. Empirical evidence for deceleration of evolutionary rate 390
17 has been observed in other experimental studies using both asexual (Wiser et al. 2013; 391
Lenski et al. 2015) and sexual organisms (Gilligan and Frankham 2003; Simões et al. 392
2007). 393
We also observed that the differences between short-term and longer-term dynamics 394
were trait and population specific. Whereas differences in the early-fecundity response 395
between sets of populations increased from short- to long-term evolution, the inverse 396
pattern was observed for female starvation resistance. The source of differences 397
between populations also varied between traits. In the case of early fecundity, trajectory 398
variation was due to a continuous increase in performance of the 2001 populations, even 399
during long-term evolution, contrasting with the 1998 and 2005 populations, where 400
quicker short-term evolution was followed by a slowing of the evolutionary response 401
after generation 20. These differences are consistent with convergent evolution, as faster 402
evolution in an earlier period is followed by a plateauing, while slower evolution 403
corresponds to a steadier evolutionary rate throughout generations. Such contrasting 404
evolutionary dynamics led to an interesting pattern: an intermediate phase of transient 405
divergence was followed in the long-term by a partial convergence among evolving 406
populations. In contrast, for female starvation resistance there were striking differences 407
in the evolutionary trajectories during short-term evolution, with increase, decrease, or 408
stasis contingent on the degree of initial differentiation from controls (see also Simões 409
et al. 2008). For this trait, convergence was fast between all populations. These patterns 410
were followed in general by a reduction of differences between evolutionary trajectories 411
over the longer time period analyzed. The exception was the NW populations, which 412
presented an initial positive trend, unique across populations (see also Matos et al. 413
2004), followed by a negative long-term trend. Nevertheless, despite the different 414
18 underlying evolutionary dynamics, both early fecundity and female starvation resistance 415
show a general pattern that suggests convergence in longer-term periods. 416
It is an inherent expectation of convergent evolution that there will be a negative 417
association between initial state and subsequent evolutionary rates of populations 418
adapting to a new environment (Simões et al. 2007). This expectation was confirmed 419
for D. subobscura populations with clear initial historical differentiation, founded from 420
contrasting latitudes of the European cline (Fragata et al. 2014). In that study fast 421
convergence was observed after only 14 generations in a common environment. In our 422
study, evidence of such an association was only found for age of first reproduction and 423
female starvation resistance for the short-term dynamics. Even so, for female starvation 424
resistance the overall trend was not of convergence in the case of NW populations (see 425
above). The relative lack of such overall and rapid convergence in our study might be 426
due to the smaller degree of initial differentiation of these populations, with greater 427
sampling effects (Santos et al. 2012). 428
If full convergence occurs, an obvious corollary is that populations will not be 429
differentiated as an outcome of evolution in a common environment. This expectation 430
was not entirely met in our study, as several populations remained differentiated for 431
some traits after sixty generations of evolution. In this context, several patterns emerged 432
when comparing dynamics between different populations: (1) continuous reduction of 433
differences indicating partial convergence (for male starvation resistance); (2) 434
continuous divergence between populations (for early and peak fecundity); (3) transient 435
divergence followed by partial convergence (for age of first reproduction and early 436
fecundity) or (4) transient convergence followed by later divergence (for early fecundity 437
and female starvation resistance). Teotónio and his collaborators (Teotónio et al. 2002; 438
Teotónio and Rose 2000) performed a reverse evolution study during 50 generations 439
19 involving many genetically differentiated Drosophila melanogaster populations. They 440
found that populations converged to ancestral values, but this trend was not general as it 441
varied with the previous history and the trait studied. They concluded that populations 442
converged to similar fitness values to a larger extent than other characters did. In 443
contrast, in our study we did not see any clear relation between the extent of 444
convergence and how the traits analyzed were presumed to determine fitness. In fact, 445
several populations remained differentiated for early fecundity, a trait that is under 446
strong selection in our environment with clear and consistent improvement across many 447
independent studies (Fragata et al. 2014; Matos et al. 2002; Matos et al. 2004; Simões et 448
al. 2007; Simões et al. 2008). Given our interpretation of transient divergence and 449
partial convergence in some of these populations, it is possible that the time span of the 450
study was not sufficient to allow for full convergence in some cases, convergence that 451
might ultimately occur over more generations of evolution. 452
We observed considerable differences between short-term and longer-term dynamics 453
in all our populations, which raises questions about predicting long-term evolution from 454
short-term evolution. This contrasts with the study of Burke et al. (2016), which 455
suggests that short-term evolution is predictive of longer evolutionary time periods. In 456
that study recently selected D. melanogaster populations converged to the trait values of 457
other independently derived populations evolving in a similar selection regime for a 458
longer time scale, regardless of the evolutionary history of the populations studied. 459
However, different time scales were involved, as the shorter-term evolutionary 460
responses of that study were sometimes more than 100 generations in duration, with 461
long-term evolution approaching 1,000 generations. In general, the fact that our study 462
showed such differentiated outcomes and complex evolutionary patterns highlights the 463
20 importance of characterizing extended periods of experimental evolution and the
464
possible pitfalls of predicting evolution from short-term adaptive patterns. 465
466
Conclusions 467
We here showed that after 60 generations of evolution in a common environment, 468
Drosophila subobscura populations remain differentiated for several traits. Noticeably,
469
this was observed even for life-history traits that are clearly under selection in our lab. 470
In this context, we found evidence for transient divergence, as a result of heterogeneity 471
in evolutionary rates through time, occurring under a general scenario of convergence. 472
Ultimately, we conclude that extrapolating from short-term evolutionary patterns to 473
longer evolutionary periods might be risky, particularly if one is interested in predicting 474
the outcomes of evolution. 475
476
Author Contributions
477PS and IF participated in the conception and design of the study, collected and analyzed 478
the data, and drafted the manuscript. JS participated in the conception and design of the 479
study, data collection, and revised critically the manuscript. MAS participated in data 480
collection and revised critically the manuscript. MS and MRR participated in the 481
conception and design of the study, as well as substantively revising the manuscript. 482
MM conceived and designed the study, coordinated the study, and helped drafting the 483
manuscript. All authors gave final approval for publication. PS and IF contributed 484
equally to this work. 485
486
Acknowledgments
487The authors thank Laurence D. Mueller for the first version of the script that was later 488
adapted for the analyses of the present study. Two anonymous reviewers provided 489
21 helpful comments on an earlier draft. This study was partially financed by “Fundação 490
para a Ciência e a Tecnologia” (FCT) projects POCTI/BSE/33673/2000, POCI-491
PPCDT/BIA-BDE/55853/2004 and PTDC/BIA-BDE/65733/2006 and by the cE3c FCT 492
Unit UID/BIA/00329/2013. PS and IF have postdoctoral FCT grants 493
(SFRH/BPD/86186/2012 and within the project JPIAMR/0001/2016 respectively). MS 494
is funded by grants CGL2017-89160P from Ministerio de Economía y Competitividad 495
(Spain), and 2017SGR 1379 from Generalitat de Catalunya. 496
497
Literature Cited
498Barrett, R. D. H., and D. Schluter. 2008. Adaptation from standing genetic variation. 499
Trends Ecol. Evol. 23:38–44. 500
Barton, N. H., and P. D. Keightley. 2002. Understanding quantitative genetic variation. 501
Nat. Rev. Genet. 3:11–21. 502
Benjamini, Y., and D. Yekutieli. 2001. The control of the false discovery rate in 503
multiple testing under dependency. Ann. Stat. 29:1165–1188. 504
Botero, C. A., F. J. Weissing, J. Wright, and D. R. Rubenstein. 2015. Evolutionary 505
tipping points in the capacity to adapt to environmental change. Proc. Natl. Acad. 506
Sci. USA 112:184–189. 507
Brito, R. A., L. S. Pletscher, and J. M. Cheverudi. 2005. the Evolution of Genetic 508
Architecture. I. Diversification of Genetic Backgrounds By Genetic Drift. 509
Evolution (N. Y). 59:2333–2342. 510
Burke, M., J. Dunham, P. Shahrestani, K. Thornton, M. Rose, and A. Long. 2010. 511
Genome-wide analysis of a long-term evolution experiment with Drosophila. 512
22 Nature 467:587–590.
513
Burke, M. K., T. T. Barter, L. G. Cabral, J. N. Kezos, M. A. Phillips, G. A. Rutledge, K. 514
H. Phung, R. H. Chen, H. D. Nguyen, L. D. Mueller, and M. R. Rose. 2016. Rapid 515
divergence and convergence of life-history in experimentally evolved Drosophila 516
melanogaster. Evolution (N. Y). 70:2085–2098. 517
Burke, M. K., and A. D. Long. 2012. What paths do advantageous alleles take during 518
short-term evolutionary change? Mol. Ecol. 21:4913–4916. 519
Chippindale, A. K., J. A. Alipaz, H.-W. Chen, and M. R. Rose. 1997. Experimental 520
Evolution of Accelerated Development in Drosophila. 1. Developmental Speed and 521
Larval Survival. Evolution (N. Y). 51:1536–1551. 522
Cohan, F. M. 1984. Can Uniform Selection Retard Random Genetic Divergence 523
Between Isolated Conspecific Populations? Evolution (N. Y). 38:495–504. 524
Cohan, F. M., and A. A. Hoffmann. 1986. Genetic divergence under uniform selection. 525
II. Different responses to selection for knockdown resistance to ethanol among 526
Drosophila melanogaster populations and their replicate lines. Genetics 114:145– 527
164. 528
de Visser, J. A. G. M., and J. Krug. 2014. Empirical fitness landscapes and the 529
predictability of evolution. Nat. Rev. Genet. 15:480–490. 530
Endler, J. A. 1986. Natural Selection in the Wild. Princeton University Press. 531
Fragata, I., P. Simões, M. Lopes-Cunha, M. Lima, B. Kellen, M. Bárbaro, J. Santos, M. 532
R. Rose, M. Santos, and M. Matos. 2014. Laboratory selection quickly erases 533
historical differentiation. PLoS One 9:e96227. 534
23 Fragata, I., P. Simões, M. Matos, E. Szathmáry, and M. Santos. 2018. Playing evolution 535
in the laboratory: From the first major evolutionary transition to global warming. 536
Epl 122. 537
Franks, S. J., and A. A. Hoffmann. 2012. Genetics of Climate Change Adaptation. 538
Annu. Rev. Genet 46:185–208. 539
Gilligan, D. M., and R. Frankham. 2003. Dynamics of genetic adaption to captivity. 540
Conserv. Genet. 4:189–197. 541
Good, B. H., and M. M. Desai. 2015. The impact of macroscopic epistasis on long-term 542
evolutionary dynamics. Genetics 199:177–190. 543
Goodnight, C. J. 2015. Long-term selection experiments: Epistasis and the response to 544
selection. Pp. 1–18 in J. H. Moore and S. M. Williams, eds. Epistasis: Methods and 545
protocols. Springer Science+Business Media New York. 546
Hansen, T. F. 2013. Why epistasis is important for selection and adaptation. Evolution 547
(N. Y). 67:3501–3511. 548
Joshi, A., R. B. Castillo, and L. D. Mueller. 2003. The contribution of ancestry, chance, 549
and past and ongoing selection to adaptive evolution. J. Genet. 82:147–162. 550
Khan, A. I., D. M. Dinh, D. Schneider, R. E. Lenski, and T. F. Cooper. 2011. Negative 551
epistasis between beneficial mutations in an evolving bacterial population. Science 552
(80-. ). 332:1193–1196. 553
Lachapelle, J., J. Reid, and N. Colegrave. 2015. Repeatability of adaptation in 554
experimental populations of different sizes. Proc. R. Soc. B 282:20143033. 555
Lässig, M., V. Mustonen, and A. M. Walczak. 2017. Predicting evolution. Nat. Ecol. 556
24 Evol. 1:1–9. Macmillan Publishers Limited.
557
Lenormand, T., D. Roze, and F. Rousset. 2009. Stochasticity in evolution. Trends Ecol. 558
Evol. 24:157–165. 559
Lenski, R. E., M. J. Wiser, N. Ribeck, Z. D. Blount, R. Maddamsetti, A. R. Burmeister, 560
E. J. Baird, and J. Bundy. 2015. Sustained fitness gains and variability in fitness 561
trajectories in the long-term evolution experiment with Escherichia coli. Proc. R. 562
Soc. B 282:20152292. 563
Long, A., G. Liti, A. Luptak, and O. Tenaillon. 2015. Elucidating the molecular 564
architecture of adaptation via evolve and resequence experiments. Nat. Rev. Genet. 565
16:567–582. 566
Losos, J. B. 2011. Convergence, adaptation, and constraint. Evolution (N. Y). 65:1827– 567
1840. 568
Matos, M., T. Avelar, and M. R. Rose. 2002. Variation in the rate of convergent 569
evolution: adaptation to a laboratory environment in Drosophila subobscura. J. 570
Evol. Biol. 15:673–682. 571
Matos, M., P. Simões, A. Duarte, C. Rego, T. Avelar, and M. R. Rose. 2004. 572
Convergence to a novel environment: comparative method versus experimental 573
evolution. Evolution 58:1503–1510. 574
Matos, M., P. Simões, M. A. Santos, S. G. Seabra, G. S. Faria, and F. Vala. 2015. 575
History, chance and selection during phenotypic and genomic experimental 576
evolution: replaying the tape of life at different levels. Front. Genet. 6:71. 577
Melnyk, A. H., and R. Kassen. 2011. Adaptive landscapes in evolving populations of 578
25 pseudomonas fluorescens. Evolution (N. Y). 65:3048–3059.
579
Orgogozo, V. 2015. Replaying the tape of life in the twenty-first century. Interface 580
Focus 5:20150057. 581
Orozco-Terwengel, P., M. Kapun, V. Nolte, R. Kofler, T. Flatt, and C. Schlãtterer. 582
2012. Adaptation of Drosophila to a novel laboratory environment reveals 583
temporally heterogeneous trajectories of selected alleles. Mol. Ecol. 21:4931– 584
4941. 585
Paixão, T., and N. H. Barton. 2016. The effect of gene interactions on the long-term 586
response to selection. Proc. Natl. Acad. Sci. 113:4422–4427. 587
Phillips, M. A., A. D. Long, Z. S. Greenspan, L. F. Greer, M. K. Burke, B. 588
Villeponteau, K. C. Matsagas, C. L. Rizza, L. D. Mueller, and M. R. Rose. 2016. 589
Genome-wide analysis of long-term evolutionary domestication in Drosophila 590
melanogaster. Sci. Rep. 6:1–12. Nature Publishing Group. 591
Rebolleda-Gómez, M., and M. Travisano. 2019. Adaptation, chance, and history in 592
experimental evolution reversals to unicellularity. Evolution (N. Y). 73:73–83. 593
Rose, M. R., H. B. Passananti, and M. Matos. 2004. Methuselah Flies: A Case Study in 594
the Evolution of Aging. World Scientific. 595
Santos, J., M. Pascual, P. Simões, I. Fragata, M. Lima, B. Kellen, M. Santos, A. 596
Marques, M. R. Rose, and M. Matos. 2012. From nature to the laboratory: the 597
impact of founder effects on adaptation. J. Evol. Biol. 25:2607–2622. 598
Schoustra, S. E., D. Punzalan, R. Dali, H. D. Rundle, and R. Kassen. 2012. Multivariate 599
Phenotypic Divergence Due to the Fixation of Beneficial Mutations in 600
26 Experimentally Evolved Lineages of a Filamentous Fungus. PLoS One 7:1–7. 601
Seabra, S. G., I. Fragata, M. A. Antunes, G. S. Faria, M. A. Santos, V. C. Sousa, P. 602
Simões, and M. Matos. 2018. Different genomic changes underlie adaptive 603
evolution in populations of contrasting history. Mol. Biol. Evol. 35:549–563. 604
Simões, P., I. Fragata, S. Seabra, G. S. Faria, M. Santos, M. R. Rose, M. Santos, and M. 605
Matos. 2017. Predictable phenotypic, but not karyotypic, evolution of historically 606
differentiated populations. Sci. Rep. 7: 913. 607
Simões, P., M. R. Rose, A. Duarte, R. Gonçalves, and M. Matos. 2007. Evolutionary 608
domestication in Drosophila subobscura. J. Evol. Biol. 20:758–766. 609
Simões, P., J. Santos, I. Fragata, L. D. Mueller, M. R. Rose, and M. Matos. 2008. How 610
repeatable is adaptive evolution? The role of geographical origin and founder 611
effects in laboratory adaptation. Evolution 62:1817–1829. 612
Stern, D. L. 2013. The genetic causes of convergent evolution. Nat. Rev. Genet. 613
14:751–64. Nature Publishing Group. 614
Teotónio, H., I. M. Chelo, M. Bradić, M. R. Rose, and A. D. Long. 2009. Experimental 615
evolution reveals natural selection on standing genetic variation. Nat. Genet. 616
41:251–257. 617
Teotónio, H., M. Matos, and M. Rose. 2002. Reverse evolution of fitness in Drosophila 618
melanogaster. J. Evol. Biol. 15:608–617. 619
Teotónio, H., and M. R. Rose. 2000. Variation in the reversibility of evolution. Nature 620
408:463–466. 621
Travisano, M., J. A. Mongold, A. F. Bennett, and R. E. Lenski. 1995. Experimental 622
27 Tests of the Roles of Adaptation, Chance, and History in Evolution. Science (80-. 623
). 267:87–90. 624
Whitlock, M. C., P. C. Phillips, F. B. Moore, and S. J. Tonsor. 1995. Multiple Fitness 625
Peaks and Epistasis. Annu. Rev. Ecol. Syst. 26:601–629. 626
Wickham, H. 2009. ggplot2: Elegant Graphics for Data Analysis. Springer-Verlag, New 627
York. 628
Wickham, H. 2007. Reshaping Data with the reshape Package. J. Stat. Softw. 21:1–20. 629
Wiser, M. J., N. Ribeck, R. E. Lenski, J. S. Littell, C. J. Muller, K. A. Dunne, A. V 630
Vecchia, L. R. Leung, Y. Qian, Y. Zhang, J. L. Betancourt, and G. J. Mccabe. 631
2013. Long-Term Dynamics of Adaptation in Asexual Populations. Science (80-. ). 632
342:1364–1367. 633
Wright, S. 1931. Evolution in Mendelian Populations. Genetics 16:97–159. 634
2018. R Core Team. R: A Language and Environment for Statistical Computing. 635
28
Tables
637
638
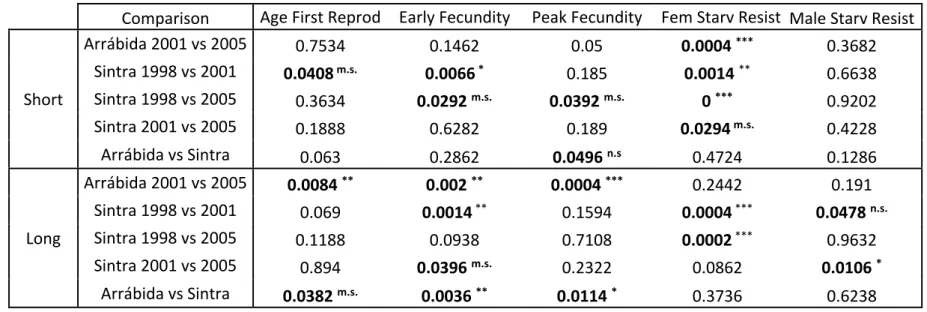
Table 1 - Comparison of evolutionary rates between different years or locations for short or longer periods. 639
Comparison Age First Reprod Early Fecundity Peak Fecundity Fem Starv Resist Male Starv Resist
Short Arrábida 2001 vs 2005 0.7534 0.1462 0.05 0.0004 *** 0.3682 Sintra 1998 vs 2001 0.0408 m.s. 0.0066 * 0.185 0.0014 ** 0.6638 Sintra 1998 vs 2005 0.3634 0.0292 m.s. 0.0392 m.s. 0 *** 0.9202 Sintra 2001 vs 2005 0.1888 0.6282 0.189 0.0294 m.s. 0.4228 Arrábida vs Sintra 0.063 0.2862 0.0496 n.s 0.4724 0.1286 Long Arrábida 2001 vs 2005 0.0084 ** 0.002 ** 0.0004 *** 0.2442 0.191 Sintra 1998 vs 2001 0.069 0.0014 ** 0.1594 0.0004 *** 0.0478 n.s. Sintra 1998 vs 2005 0.1188 0.0938 0.7108 0.0002 *** 0.9632 Sintra 2001 vs 2005 0.894 0.0396 m.s. 0.2322 0.0862 0.0106 * Arrábida vs Sintra 0.0382 m.s. 0.0036 ** 0.0114 * 0.3736 0.6238 640
Note: P-values were obtained by residual bootstraping of 10000 samples and estimated the fraction of these samples that were greater than 0 641
(see Material and Methods for more details). When p<0.05 (indicated in bold) significance levels after FDR correction are also presented (in 642 superscript): *** p<0.00044 (α=0.001); ** 0.00044<p<0.0044 (α=0.01); * 0.0044<p<0.022 (α=0.05); m.s. 0.022<p<0.044 (α=0.1); n.s. 643 p>0.044 (α=0.1) 644 645
29 Table 2 - Comparison of short and long term evolutionary rates between years and locations.
646
Comparison Age First Reprod Early Fecundity Peak Fecundity Fem Starv Resist Male Starv Resist
Arrábida 2001 vs 2005 0.2376 0.0042 ** 0.7132 0 *** 0.1444 Sintra 1998 vs 2001 0.1402 0 *** 0.069 0 *** 0.2288 Sintra 1998 vs 2005 0.6716 0.006 * 0.048 n.s. 0 *** 0.9166 Sintra 2001 vs 2005 0.238 0.1714 0.5928 0.0078 * 0.0702 Arrábida vs Sintra 0.2628 0.6254 0.7414 0.2986 0.1144 647
Note: P-values were obtained by residual bootstraping of 10000 samples and estimated the fraction of these samples that were greater than 0 648
(see Material and Methods for more details). Significant results are indicated in bold. When p<0.05 (indicated in bold) significance levels after 649
FDR correction are also presented (in superscript): *** p<0.00044 (α=0.001); ** 0.00044<p<0.0044 (α=0.01); * 0.0044<p<0.022 (α=0.05); 650 m.s. 0.022<p<0.044 (α=0.1); n.s. p>0.044 (α=0.1) 651 652 653 654 655 656
30
Figures
657
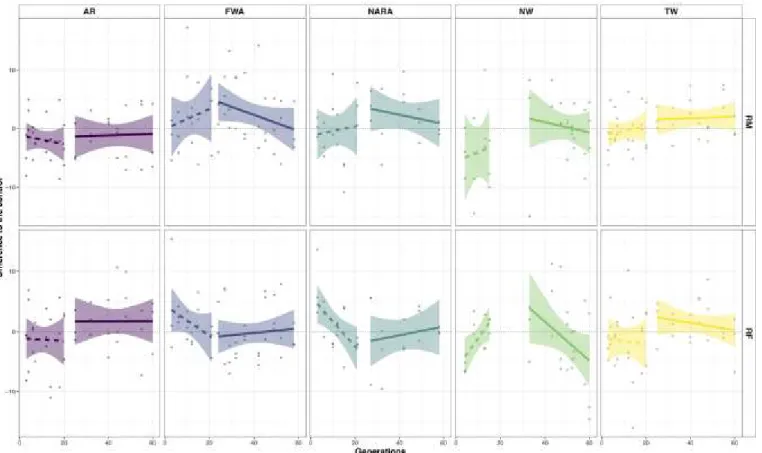
Figure 1 - Short and long-term evolutionary trajectories for fecundity related traits for the 5 sets of populations studied. Age of first 658
reproduction (number of days), Early fecundity (number of eggs), Peak fecundity (number of eggs) are represented. Points represent mean 659
values for each replicate at each generation. Dashed lines indicate short term period and full line indicates long-term period. Shaded area 660
represents 95% confidence intervals estimated from the regression, using mean replicate population values. 661
31 663
Figure 2 - Short and long-term evolutionary trajectories for female and male starvation resistance for the 5 sets of populations studied. Male 664
starvation resistance (in hours) and Female starvation resistance (in hours) are represented. Points represent mean value for each replicate at 665
each generation. Dashed lines indicate short term period and full line indicates long-term period. Shaded area represents 95% confidence 666
intervals estimated from the regression, using mean replicate population values. 667