1
U
Universidade de Lisboa
Faculdade de Medicina Dentária
In vitro study of the adhesion to dentin
promoted by an universal system - Futurabond M+ -
with and without pulpar pressure
Filipa Nobre de Carvalho Rodrigues
Dissertação
Mestrado Integrado em Medicina Dentária
2
Universidade de Lisboa
Faculdade de Medicina Dentária
In vitro study of the adhesion to dentin
promoted by an universal system - Futurabond M+ -
with and without pulpar pressure
Filipa Nobre de Carvalho Rodrigues
Dissertação orientada pela Professora Doutora Sofia Arantes e Oliveira
Mestrado Integrado em Medicina Dentária
i
Agradecimentos
À minha orientadora, Professora Doutora Sofia Arantes e Oliveira, quero expressar o mais profundo agradecimento pelo contante apoio, motivação, disponibilidade e orientação durante a realização desta tese de mestrado. Agradeço também o facto de ter partilhado comigo todo o seu conhecimento, a paciência que demonstrou para ensinar e esclarecer todas as minhas dúvidas e a sua amizade.
À Dra. Filipa Chasqueira, pela sua simpatia e disponibilidade para ajudar a resolver dúvidas e problemas com o material durante e execução do ensaio laboratorial.
À minha colega e amiga Marta Ramos, por ter partilhado e crescido comigo nesta jornada de aprendizagem no mundo da investigação e por ter tornado as inúmeras horas que passámos no laboratório e todas as adversidades com que nos deparámos mais fáceis de ultrapassar com a sua boa-disposição, alegria e espírito positivo.
Às minhas amigas Joana Costa e Sara Palmares por estarem do meu lado desde que comecei o meu caminho nesta faculdade, pelo seu apoio e amizade e por terem partilhado comigo os momentos bons e os menos bons.
À minha amiga Catarina, por ter sido a minha amiga e companheira de clínica nos últimos anos e aos meus amigos Lisa, Carolina, Fábia, Padilha, Rui e Margarida pelo convívio e apoio.
À minha família, aos meus pais e avós por terem sido um pilar constante de força e motivação durante esta etapa e todas as outras etapas da minha vida. À minha irmã Mariana, por me incentivar sempre a ser melhor e por me dar a sua força e alegria nos momentos mais difíceis durante toda a minha vida. Ao meu namorado Luís, por ter acreditado sempre em mim e por me ter dado motivação, força e o seu carinho sempre que precisei.
iii
Table of Contents
Abstract ... x Resumo ... xii I. Introduction ... 1 II. Objectives ... 6III. Materials and Methods ... 8
1. Experimental design ... 8
2. Materials ... 9
3. Specimen preparation ... 11
4. Microtensile bond strength ... 12
5. Scanning electron microscopy ... 13
6. Statistical analysis ... 14
IV. Results ... 15
1. Microtensile bond strength ... 15
2. Scanning electron microscopy ... 16
V. Discussion ... 19
Conclusions ... 24
References... 25 Appendices ... I
v
Abbreviations
ER Etch-and-rinse
FB Futurabond M+
HAp Hydroxyapatite
HEMA 2-hydroxyethyl methacrylate
4-MET 4-methacryloyloxyethyl trimellitic acid
10-MDP 10-methacryloyloxydecyl dihydrogen phosphate
MMP-2 Matrix metalloproteinase-2
MMP-8 Matrix metalloproteinase-8
MMP-9 Matrix metalloproteinase-9
μTBS Micro-tensile bond strength test
Phenyl-P 2-(methacryloyloxyethyl) phenyl hydrogenphosphate
PTF Pretesting failures
SE Self-etch
SEM Scanning electron microscopy
TEM Transmission electron microscopy
UA Universal adhesives
Units
cmH2O – Centimetre of water μm – Micrometre ºC – Celsius degree nm – Nanometre mm – Millimetremm/min – Millimetre per minute
mW/cm2 – Milliwatt per square centimetre M – Molar – mol/dm3
ml –Millilitre kN – Kilonewton kV - Kilovolt
vi
Symbols
% Percentage pH Potencial hydrogen n Sample size p Statistical significancevii
List of Figures
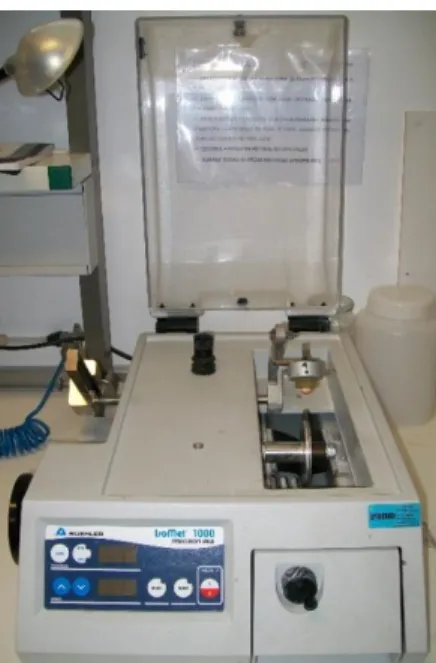
Figure 1 – Hard tissue microtome, Isomet 1000 Precision Saw ... 8
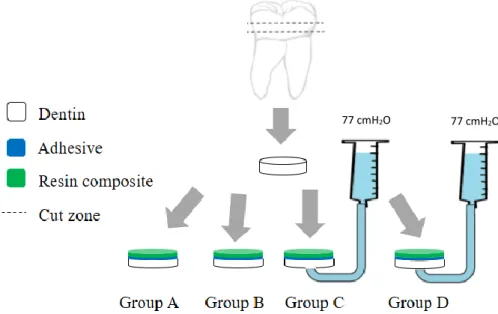
Figure 2 – Specimen division into groups according to the methodology used ... 9
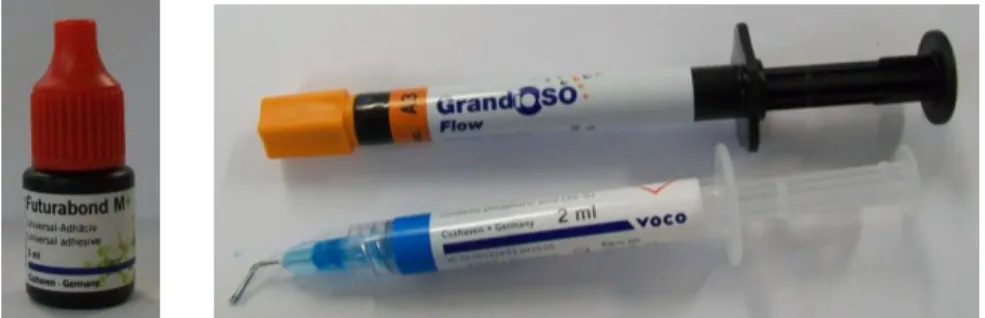
Figure 3 – Adhesive system, resin composite and phosphoric acid (35%) ... 10
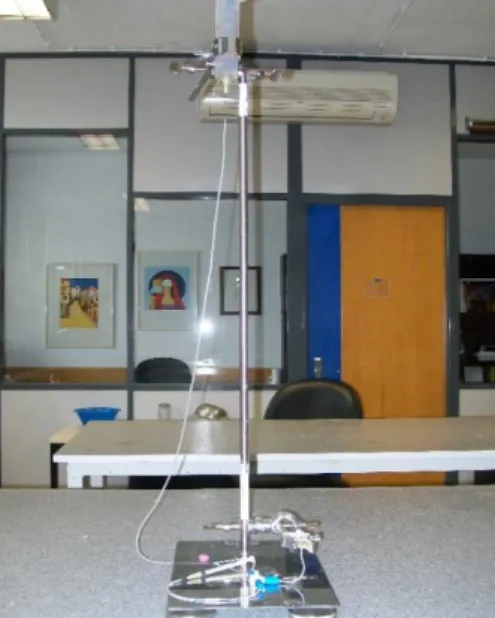
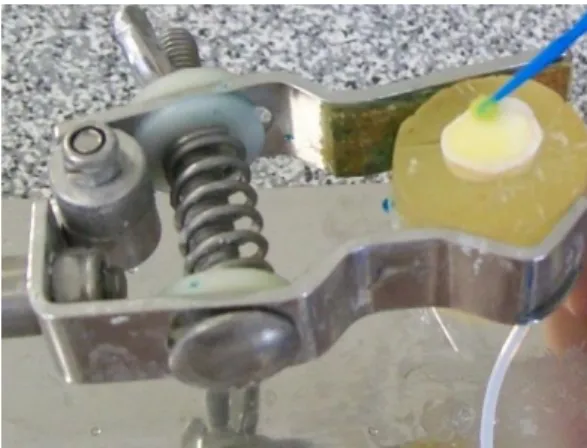
Figure 4 – Pulpar pressure device ... 11
Figure 5 – 35% phosphoric acid gel application. ... 11
Figure 6 – Adhesive system application with a disposable brush ... 12
Figure 7 – Specimen after the application and polymerization of the resin composite 12 Figure 8 – Specimen attached to a Geraldelli’s jig ... 13
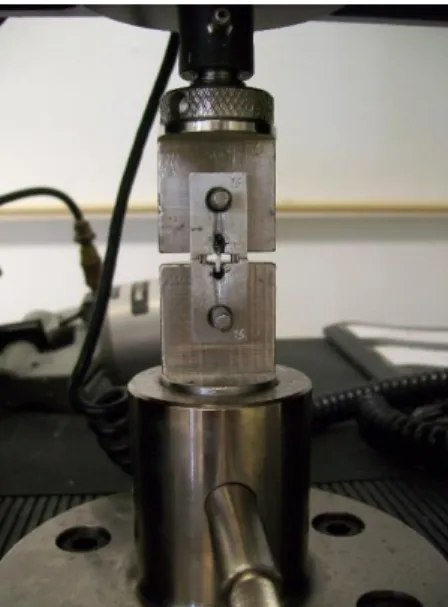
Figure 9 – Specimen positioned in the universal testing machine, Instron 4500 ... 13
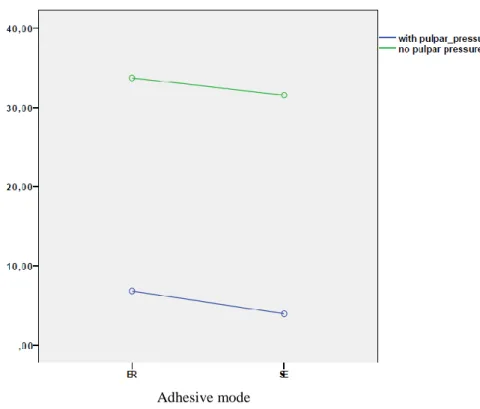
Figure 10 – Graphic relating the μTBS values, the adhesive application mode and the presence or absence of pulpal pressure ... 16
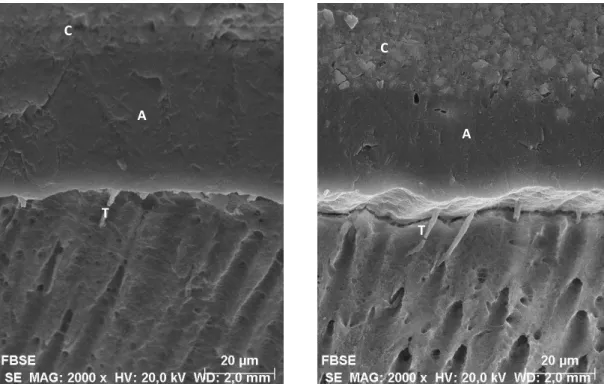
Figure 11 – SEM micrograph of resin-dentin interface formed with Futurabond M+ under the ER mode, without pulpal pressure at 2000x magnification. (C) Resin composite; (H) hybrid layer; (A) adhesive; (T) resin tags. Note the hybrid layer and the area densely filled with resin tags in both images ... 17
Figure 12 – SEM micrograph of resin-dentin interface formed with Futurabond M+ under the SE mode, without pulpal pressure at 2000x magnification. (C) Resin composite; (H) hybrid layer; (A) adhesive; (T) resin tags. Note the hybrid layer and the presence of some resin tags in both images ... 17
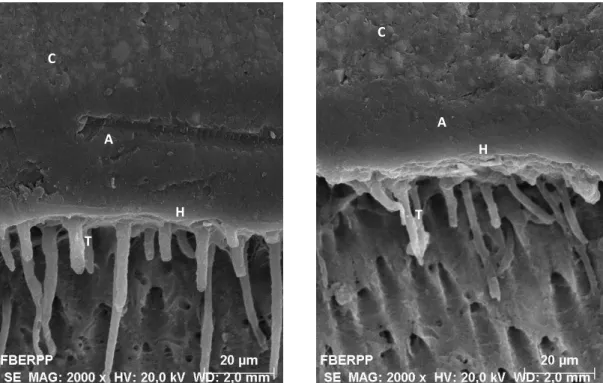
Figure 13 – SEM micrograph of resin-dentin interface formed with Futurabond M+ under the ER mode, with pulpal pressure at a 2000x magnification. (C) Resin composite; (H) hybrid layer; (A) adhesive; (T) resin tags. Note the hybrid layer and the presence of some resin tags in both images ... 18
Figure 14 – SEM micrograph of resin-dentin interface formed with Futurabond M+ under the SE mode, with pulpal pressure at 2000x and 4000x magnifications. (C) Resin composite; (H) hybrid layer; (A) adhesive; (T) resin tags. Note the hybrid layer, the absence of resin tags and the presence of a gap between the adhesive and the dentin surface in both images ... 18
viii
List of Tables
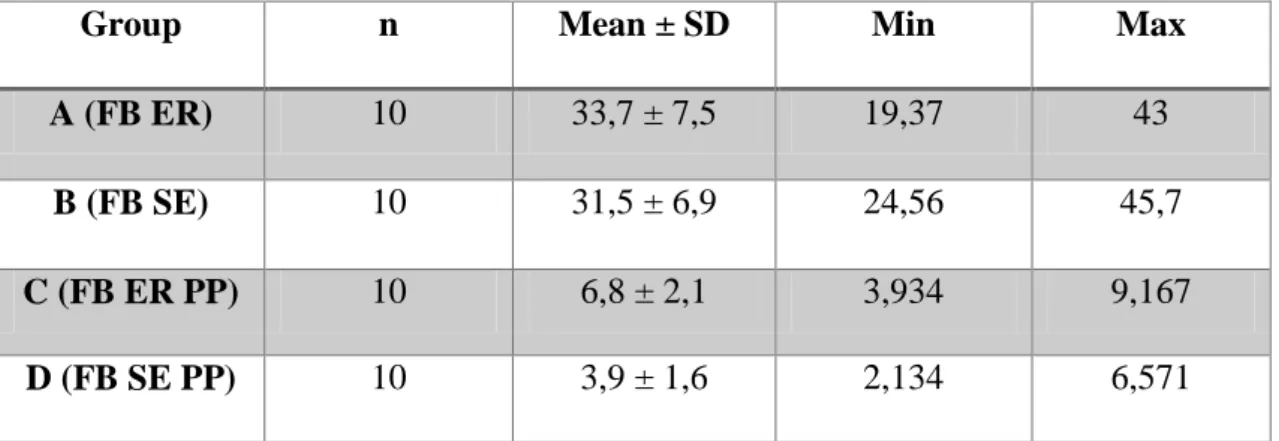
Table 1 – Materials, composition and application modes ... 10 Table 2 – Microtensile bond strength (μTBS) values (n, Mean and SE and SD) of the
different experimental groups in MPa ... 15
Table A.3 – Kolmogorov-Smirnov and Shapiro-Wilk tests to evaluate the normality of
the sample ... I
Table A.4 – Levene’s test to evaluate the homogeneity of the sample ... I Table A.5 – Kruskal-Wallis test to establish the comparison between the experimental
groups. ... I
Table A.6 – Mann-Whitney tests to compare between the two studied variables:
x
Abstract
Objectives: To evaluate the microtensile bond strength (μTBS) and the
resin-dentin interface morphology of an universal adhesive system, Futurabond M+ (FB), in the etch-and-rinse strategy and in the self-etch strategy, with and without pulpal pressure.
Methods: Forty caries-free extracted human molars were randomly assigned to
four experimental conditions: Group A - FB with etch-and-rinse strategy; Group B - FB with self-etch strategy, both without pulpal pressure; Group C - FB with etch-and-rinse strategy; Group D - FB with self-etch strategy, both with pulpal pressure. The specimens were then stored in distilled water in an incubator for 24 hours at 37ºC. Subsequently, teeth were longitudinally sectioned with a low-speed diamond saw under water irrigation, dividing them into two halves. One of the halves was then longitudinally sectioned in both “x” and “y” directions across the bonded interface, creating sticks with a cross-sectional area of approximately 1mm2. The other half was sectioned in order to create 2 quarters of the initial specimen and used for SEM observation. Statistical analysis was performed through the SPSS program. Kruskal-Wallis and Mann-Whitney tests were performed when the assumption of normality and homogeneity were not observed.
Results: There were statistically significant differences in μTBS (p<0,05)
between the ER and SE application modes in the group with pulpal pressure and also when the experimental groups with pulpal pressure were compared with the ones without pulpal pressure. The presence of pulpal pressure also caused structural defects in the resin-dentin interface morphology both in the ER and SE strategies.
Conclusions: Pulpal pressure clearly leads to significant differences both in the
microtensile bond strength analysis and in the resin-dentin interface morphological analysis of universal adhesives. Hence, it becomes increasingly more important that researchers simulate pulpal pressure in their in vitro studies in order to better represent clinical conditions.
Keywords: Universal adhesive system, dentin adhesion, microtensile bond strength, scanning electron microscopy, pulpal pressure.
xii
Resumo
A tecnologia adesiva sofreu uma rápida evolução desde que foi introduzida há mais de 50 anos. O principal desafio para os sistemas adesivos é fornecer uma boa qualidade de adesão a dois tecidos dentários diferentes, o esmalte e a dentina. Enquanto que a adesão ao esmalte é considerada estável e duradoura, a adesão à dentina é mais completa necessitando de processos mais morosos e complexos. Isto deve-se à natureza da dentina que está intimamente relacionada com o tecido pulpar através dos túbulos dentinários por onde circula o fluido dentinário, a uma pressão estável e constante de aproximadamente 77 cmH2O. Assim, torna-se extremamente importante que os estudos
laboratoriais simulem a existência de pressão pulpar por forma a que as conclusões retiradas dos mesmo possam ser extrapoladas para a realidade clínica.
O processo de adesão consiste na substituição dos minerais removidos dos tecidos dentários duros por monómeros de resina, de forma a que estes se tornem micro-mecanicamente interligados ao substrato dentário, após polimerização. Assim, a técnica adesiva é considerada tecnicamente sensível, sendo que um simples erro pode levar a perda de retenção e a degradação marginal precoce. Consequentemente, existe a procura de adesivos mais simples e menos sensíveis tecnicamente, o que leva os fabricantes a produzirem novos adesivos a um ritmo elevado.
Nesse sentido, apareceram os adesivos universais, também chamado de multi-purpose ou multi-mode. Esta nova família de adesivos tem como filosofia utilizar a opção mais simples para cada estratégia de aplicação do sistema adesivo, ou seja, existem na forma de etch-and-rinse de dois passos ou de self-etch de um passo. Mais ainda, promovem uma ligação química, para além de micromecânica.
Objetivos: O objetivo deste estudo laboratorial é avaliar se as forças de resistência
adesiva à dentina de um adesivo universal, o Futurabond M+ (FB), medidas através de testes de microtração, e se a morfologia da interface adesiva, analisada através de microscopia eletrónica de varrimento, são influenciadas pela estratégia de aplicação do adesivo, etch-and-rinse e self-etch ou pela presença de pressão pulpar. As hipóteses nulas testadas foram as seguintes: (1) não há diferenças nas forças de adesão à dentina quando o adesivo é aplicado na estratégia etch-and-rinse ou self-etch; (2) não há diferenças nas forças de adesão à dentina quando o adesivo é aplicado na estratégia etch-and-rinse, na presença ou não de pressão pulpar; (3) não há diferenças nas forças de adesão à dentina quando o adesivo é aplicado na estratégia self-etch, na presença ou
xiii
não de pressão pulpar; (4) não há diferenças na morfologia da interface adesiva quando o adesivo é aplicado na estratégia de etch-and-rinse ou self-etch; (5) não há diferenças na morfologia da interface adesiva quando o adesivo é aplicado na estratégia de etch-and-rinse, na presença ou não de pressão pulpar e (6) não há diferenças na morfologia da interface adesiva quando o adesivo é aplicado na estratégia de self-etch, na presença ou não de pressão pulpar.
Materiais e métodos: 40 molares humanos, não cariados, foram distribuídos
aleatoriamente por quatro grupos (n=10), de acordo com a estratégia de adesão utilizada e com a presença ou não de pressão pulpar simulada: Grupo A – FB aplicado segundo a estratégia etch-and-rinse, sem pressão pulpar; Grupo B – FB aplicado segundo a estratégia self-etch, sem pressão pulpar; Grupo C – FB aplicado segundo a estratégia etch-and-rinse, com pressão pulpar; Grupo D – FB aplicado segundo a estratégia self-etch, com pressão pulpar.
Os dentes foram seccionados transversalmente para remoção das raízes e do terço oclusal com uma micrótomo Isomet 1000 Precision Saw (Buehler, Lake Bluff, IL, EUA), equipado com um disco de corte impregnado de diamante (Lapcraft, OH, EUA; 4” x .012” x ½”), obtendo-se discos de dentina com 1-2 mm desde o corno pulpar até a superfície de dentina. A smear layer foi criada na superfície dentinária, recorrendo à lixa de grão 320 (Buhler, Lake Bluff, IL, EUA) durante 2 minutos, sob refrigeração com água. Procedeu-se de seguida à aplicação do sistema adesivo de acordo com a estratégia de adesão escolhida. Assim, o adesivo foi aplicado e polimerizado durante 10 segundos com o fotopolimerizador Bluephase ® 20i (Ivoclar Vivadent, Schaan, Liechtenstein) de 1200 mW/cm2, sendo que nos grupos A e C foi previamente aplicado o ácido fosfórico
a 35% e lavado com água. Seguidamente foram aplicadas três camadas de resina composta nanohíbrida (Grandioso – VOCO) que foram polimerizadas durante 20 segundos cada, exceto a última camada que foi polimerizada durante 40 segundos. Nos grupos C e D, os espécimes foram colocados num dispositivo de pressão pulpar de 77 cmH2O durante 10 minutos e aí permaneceram durante a aplicação do sistema adesivo e
da resina composta. Os espécimes foram armazenados em água destilada numa incubadora a 37ºC, durante 24 horas.
Posteriormente, os dentes foram seccionados longitudinalmente no micrótomo, ficando assim divididos em 2 metades. Numa dessas metades foram efetuados cortes no eixo “x” e “y”, criando palitos com uma área aproximada de 1mm2. A outra metade foi
xiv
novamente seccionada a meio para criar dois quartos do espécime original que foram utilizados para observação no microscópio eletrónico de varrimento (SEM).
Os palitos foram individualmente colados em suportes de Geraldelli com cola de cianoacrilato e testados um a um numa máquina de Teste Universal, a uma velocidade de 1mm/min até ocorrer fratura. Mediu-se a seção de cada espécime fraturado e determinou-se a área em milímetros quadrados. As forças de adesão em MPa foram calculadas dividindo a resistência à fratura pela área de superfície de cada palito. As fraturas foram observadas num estereomicroscópio (Nikon, Japão) com uma ampliação de 10x e caracterizadas em: adesiva, se ocorreu na interface adesiva; coesiva no compósito, se ocorreu exclusivamente na resina composta; e mista, se ocorreu na interface adesiva, abrangendo tanto a dentina como o compósito.
Os espécimes cortados para microscopia eletrónica de varrimento foram fixados em 2,5% de glutaraldeído durante 24 horas a 4ªC, posteriormente imersos numa solução de cacodilato de sódio a 0,1 M (pH=7,4) e preparados para visualização da interface adesiva no microscópio.
A análise estatística dos resultados foi realizada através programa SPSS. Os testes de Kolmogorov-Smirnov e de Shapiro-Wilk foram usados para avaliar a normalidade da amostra e o teste de Levene para avaliar a homogeneidade. Verificando-se que havia normalidade mas não homogeneidade da amostra, usaram-Verificando-se os testes não paramétricos de Kruskal-Wallis e Mann-Whitney com correção de Bonferroni com nível de significância de 5%.
Resultados: As maiores forças de adesão foram observadas no grupo A (33,7 ± 7,5
MPa) e as menores foram observadas no grupo D (3,9 ± 1,6 MPa). Verificaram-se diferenças estatisticamente significativas entre os modos de aplicação etch-and-rinse e self-etch nos grupos experimentais com pressão pulpar (p<0,05), mas não nos grupos sem pressão pulpar (p>0,05). Verificaram-se também diferenças estatisticamente significativas quando os grupos sem pressão pulpar foram comparados com os grupos com pressão pulpar. As forças de resistência adesiva foram significativamente menores na presença de pressão pulpar (p<0,05).
No que diz respeito à análise morfológica, a camada híbrida não foi identificada em todos os grupos experimentais, a sua presença foi observada apenas nos grupos com o modo de aplicação etch-and-rinse. Verificou-se que nos grupos com pressão pulpar a interface adesiva apresentava defeitos estruturais, nomeadamente no modo etch-and-rinse os resin tags não se apresentavam íntegros, para além de serem mais pequenos,
xv
menos definidos e sem prolongamentos acessórios e no modo self-etch para além de não se observarem resin tags, visualizou-se a presença de uma descontinuidade entre a camada adesiva e a superfície dentinária.
Conclusões: Tendo em conta as limitações deste estudo laboratorial, foi possível
perceber que a presença de água levou a diferenças significativas quer na análise das forças adesivas quer na análise morfológica da interface adesiva. Deste modo, torna-se extremamente importante que sejam realizados mais estudos in vitro, com pressão pulpar após armazenamento em água a longo prazo, para avaliar o desempenho do adesivo estudado e assim termos mais conhecimentos acerca do seu comportamento.
Palavras-chave: Sistema adesivo universal, adesão à dentina, forças de resistência adesiva, microscopia eletrónica de varrimento, pressão pulpar.
1
I. Introduction
Adhesive technology has evolved rapidly since it was introduced more than fifty years ago (Van Meerbeek et al., 2011). The major challenge for dental adhesives is to provide an equally effective bond to two hard tissues of different nature (Van Meerbeek et al., 2011; Rosa et al., 2015). Bonding to enamel has been proven to be durable while bonding to dentin is far more intricate and can apparently only be achieved when more complicated and time consuming procedures are followed (Van Meerbeek et al., 2011). Dentin is extremely difficult to bond because of its humid and organic nature (Perdigão et al., 2013). Furthermore, dentin surface is maintained constantly wet due to the dentinal fluid which circulates inside the dentinal tubules, under a constant intrapulpal pressure (Rodrigues et al., 2015) of approximately 77 cmH2O (Brown and Yankowitz
1964). Hence, it is extremely important to simulate pulpal pressure when adhesives are being tested in vitro, so that the conclusions drawn in laboratory studies can be applied to real life conditions (Cardoso et al., 2008).
Consequently, today’s adhesives are often regarded as technique sensitive with the smallest error in the clinical application procedure being penalized either by rapid debonding or early marginal degradation (Van Meerbeek et al., 2003; Breschi et al., 2008; Van Meerbeek et al., 2011). As a consequence, the demand for simpler, more user-friendly and less technique-sensitive adhesives remain high, urging manufacturers into developing new adhesives at a rapid pace (Van Meerbeek et al., 2011; Chen et al., 2015).
The fundamental mechanism of bonding to enamel and dentin is essentially based on an exchange process, in which minerals removed from the dental hard tissues are replaced by resin monomers that upon polymerization become micromechanically interlocked in the created porosities (Van Landuyt et al., 2007; Van Meerbeek et al., 2011; Muñoz et al., 2013; Rosa et al., 2015).
Contemporary adhesive strategies depend on how adhesive systems interact with the smear layer (Sezinando 2014) – either removing it (etch-and-rinse technique) or maintaining it as the substrate for the bonding technique (self-etch technique) (Breschi et al., 2008).
The etch-and-rinse adhesive strategy (ER), formerly known as total-etch (TE) involves a two-step or three-step strategy (Van Meerbeek et al., 2003). The first step involves the application of a phosphoric acid gel to both dental substrates and rinsing
2
off with water, which allows removal of the smear layer, exposure of the collagen fibrils in dentine, and increase in surface area and surface energy in the enamel substrate (Muñoz et al., 2013; Sezinando 2014). The solvent rich primer is then applied and air-dried, followed by a bonding resin, which must be polymerized. In the two-step strategy, dentin and enamel are simultaneously primed and bonded, followed by air-drying and polymerization (Sezinando 2014).
The application of phosphoric acid in enamel surface selectively dissolves the hydroxyapatite (HAp) creating macro and micro-porosities, which will then be infiltrated by resin monomers through capillary attraction, creating macro and micro “prism like” resin tags (Van Meerbeek et al., 2003; Sezinando 2014). In dentin, the acid etching step demineralizes the surface of the intertubular dentin matrix to create porosities within the underlying collagen fibrillar matrix, which should then be infiltrated by resin monomers that polymerize in situ (Van Meerbeek et al., 2003; Pashley et al., 2011; Sezinando 2014). The monomer polymerization within the collagen network spaces creates a hybrid layer of collagen and resin which provides mechanical retention for resin-based restorative materials (Pashley et al., 2011; Sezinando 2014).
The main disadvantage of the ER system, mainly two-step strategy, is that there is risk of collagen fibre collapse during the process of demineralized dentine drying, which leads to a decrease in bond strength (Pashley et al., 2011; Muñoz et al., 2013; Sezinando 2014). The collagen collapse is prevented by keeping demineralized dentine moist, which is a difficult task to perform clinically (Pashley et al., 2011; Muñoz et al., 2013; Perdigão et al., 2013; Sezinando 2014). Although water is essential at the early stage of resin infiltration, its presence within the interfibrillar spaces of the collagen matrices may trigger the hydrolysis of collagen by collagenolytic and gelatinolytic enzymes that occur naturally in the collagen fibrils in their inactive forms, such as matrix metalloproteinase-8 (MMP-8) and MMP-2 and MMP-9, respectively (Pashley et al., 2011; Perdigão et al., 2013).
The desire to produce more user-friendly (shorter application time, less steps needed) and less technique-sensitive (no wet-bonding, simple drying) adhesives (Van Meerbeek et al., 2003; Van Meerbeek et al., 2011; Rosa et al., 2015) led to the development of a new strategy, an adhesive using the self-etch strategy (SE) (Muñoz et al., 2013).
3
The self-etch strategy (SE) does not require a separate etching step, as the adhesive system contains acidic monomers that simultaneously “condition” and “prime” the dental substrate (Van Meerbeek et al., 2011; Muñoz et al., 2013; Sezinando 2014), thus integrating the smear layer into the adhesive interface (Sezinando 2014). As the smear layer is left partially intact, this class of adhesives may cause less post-operative sensitivity than that of ER systems (Van Meerbeek et al., 2011; Sezinando 2014). In addition, another advantage of the SE adhesives is that they demineralize and infiltrate the tooth surface simultaneously, theoretically ensuring complete penetration of the adhesive (Van Meerbeek et al., 2011).
SE adhesives can come as “two-step” or “one-step” adhesives, depending on whether a self-etching primer and (mostly solvent-free) adhesive resin are separately provided or are combined into one single solution. One-step adhesives can further be subdivided into “two-component”, in which the “active” ingredients are separated (the functional monomer from water) and “single component”. The latter being known as the only true “one-bottle” or “all in one” adhesives (Van Meerbeek et al., 2011).
Moreover, SE adhesives are classified according to their acidity into strong (pH ≤ 1), intermediately strong or moderate (1 <pH< 2), mild (pH ≈ 2) and ultra-mild (pH > 2,5) (Van Meerbeek et al., 2011; Sezinando 2014; Wagner et al., 2014). The degree of demineralization and interaction with the smear layer and underlying dentin is dependent on the adhesive aggressiveness (pH and chemical composition) (Sezinando 2014).
“Strong” self-etch adhesives usually result in rather deep demineralization effects due to its high acidity. Therefore, the underlying bonding mechanism of this adhesives is primarily diffusion-based and similar to the ER approach (Van Meerbeek et al., 2003). “Intermediately strong” adhesives allow an interaction depth of 1-2 μm (Van Meerbeek et al., 2011; Sezinando 2014). “Mild” self-etch adhesives demineralize dentin only to a depth of 1 μm (Van Meerbeek et al., 2003; Van Meerbeek et al., 2011; Sezinando 2014) and “ultra-mild” adhesives create a nanometric interaction in depth, allowing a true nano-interaction zone, differing from the traditional thick hybrid layer (Sezinando 2014). Both “mild” and “ultra-mild” self-etch adhesives interact with dentin by a micromechanical interaction due to polymerization in situ of the infiltrated resin monomers and by a chemical interaction, due to ionic bonding between carboxylic and phosphate-based functional monomers of the adhesive system (4-MET, phenyl-P and 10-MDP) and the calcium in residual dentin HAp (Van Meerbeek et al., 2003; Van
4
Meerbeek et al., 2011; Sezinando 2014). However, the thickness of the hybrid layer is much smaller than that produced by the strong self-etch or ER approach (Van Meerbeek et al., 2003).
Considering the differences in professional judgement regarding the selection of the adhesive strategy and the number of steps, some manufacturers have released more versatile adhesive systems that give the dentist the opportunity to decide which adhesive strategy to use: etch-and-rinse or self-etch (Muñoz et al., 2013; Rosa et al., 2015). Moreover, this new adhesion philosophy advocates the use of the simplest option for each strategy, for instance, one-step SE or two-step ER (Perdigão et al., 2014). This new family of dental adhesives is known as “universal”, purpose” or “multi-mode” and represents the latest generation of adhesives on the market (Muñoz et al., 2013; Perdigão et al., 2014; Wagner et al., 2014; Rosa et al., 2015). The universal adhesives (UA) allow the practitioner to decide on a specific adhesive protocol that is most suited to the cavity being prepared, as they can be applied both ways (Rosa et al., 2015).
The UA promote a chemical adhesion potential due to the integration of 10-MDP in their composition (Sezinando 2014). Yoshida et al. showed that an effective chemical reaction occurs between 10-MDP and HAp forming a stable nano-layer that could form a stronger phase at the adhesive interface, thus increasing its mechanical strength (Yoshida et al., 2012; Muñoz et al., 2013). This chemical interaction is extremely important to enhance durability of resin-dentin interfaces in universal adhesives, since the bond strengths are usually lower than those of two and three-step ER adhesives, but in line with the SE adhesives’ results (Sezinando 2014).
Munõz et al. in 2013, showed that an UA applied as a 2-step SE resulted in higher bond strengths and increased degree of conversion, compared with other simplified UA (Muñoz et al., 2013; Perdigão et al., 2014).
The ever-growing diversity in adhesive materials has made in vitro testing of a paramount importance (El Zohairy et al., 2010). Laboratory testing is easy, fast and relatively cheap to screen new materials and techniques and thus useful in evaluating products before they are released on the market. The final objective should obviously be to gather data in prediction of the eventual clinical outcomes (Van Meerbeek et al., 2003; Van Meerbeek et al., 2010).
In order to measure the bonding effectiveness of adhesives to enamel and dentin, diverse methodologies can be used nowadays. Currently, the most popular tests being
5
conducted are the microtensile bond strength tests, followed by macro-shear, micro-shear and macrotensile bond strength tests (Van Meerbeek et al., 2010).
Microtensile bond strength test (μTBS) was introduced to dentistry to measure the ultimate tensile strength and modulus of elasticity of mineralized and demineralized dentine by Sano et al. in 1994 (Armstrong et al., 2010). The advantages of the μTBS approach are: more adhesive failures and few cohesive failures, measurement of higher interfacial bond strengths, means and variance can be calculated for a single tooth, permits testing of irregular surfaces, permits testing of very small areas and facilitates scanning electron microscopy (SEM) and transmission electron microscopy (TEM) examinations of the failed bonds since the surface area is approximately 1mm2 (Pashley et al., 1999; Van Meerbeek et al., 2003; Van Meerbeek et al., 2010; Armstrong et al., 2010). The drawbacks are the labour intensity and technical demand, the dehydration and damaging potential of the specimens and the difficulty to measure very low bond strengths (<5 MPa) (Van Meerbeek et al., 2003; Armstrong et al., 2010).
The μTBS is calculated as the tensile load at failure divided by the cross-sectional area of the bonded interface (Armstrong et al., 2010). Through this formula, Sano et al. in 1994 in their study showed that microtensile bond strength was inversely related to the bonded surface area (Armstrong et al., 1998; Van Meerbeek et al., 2003), as the bonding interface had very small dimensions, and the values found were much higher than those obtained by a conventional tensile test (Cardoso et al., 1998).
If experimental conditions are constant during the bonding tests, it is expected that the μTBS results from different laboratories would be in agreement. However, variable methods and parameters have been employed by the different laboratories around the world resulting in bond strength data that can hardly be compared across studies (Armstrong et al., 2010). Consequently, standardization of the testing parameters is of the utmost importance so that critical interpretations of data and meaningful comparisons of results can be achieved (Armstrong et al., 2010; Van Meerbeek et al., 2010).
Considering that pulpal pressure has seldom been simulated in most of the in vitro studies regarding dental adhesion and since the absence of this pulpal pressure prevents the extrapolation of the results to the clinical settings, it is extremely important to test new adhesive systems, in vitro, with simulated pulpal pressure. Hence, in the present study the presence of pulpal pressure has been simulated so that more accurate conclusions could be drawn.
6
II.
Objectives
The main purpose of this study was to evaluate if the immediate microtensile bond strength and morphology of the resin-dentin interface are influenced by the chosen adhesive strategy (ER or SE) or by a positive pulpal pressure, according to the following hypothesis:
1-To compare the differences in the microtensile bond strength when the adhesive was applied either following the ER or the SE strategy
H0: There were no differences in the microtensile bond strength when the adhesive was applied either following the ER or the SE strategy
H1: There were differences in the microtensile bond strength when the adhesive was applied either following the ER or the SE strategy
2-To compare the differences in the microtensile bond strength when the adhesive was applied following the ER strategy, with and without pulpal pressure
H0: There were no differences in the microtensile bond strength when the adhesive was applied following the ER strategy, with and without pulpal pressure
H1: There were differences in the microtensile bond strength when the adhesive was applied following the ER strategy, with and without pulpal pressure
3-To compare the differences in the microtensile bond strength when the adhesive was applied following the SE strategy, with and without pulpal pressure
H0: There were no differences in the microtensile bond strength when the adhesive was applied following the SE strategy, with and without pulpal pressure
H1: There were differences in the microtensile bond strength when the adhesive was applied following the SE strategy, with and without pulpal pressure
4-To compare the differences in the resin-dentin interface morphology when the adhesive was applied either following the ER or the SE strategy
H0: There were no differences in the resin-dentin interface morphology when the adhesive was applied either following the ER or the SE strategy
H1: There were differences in the resin-dentin interface morphology when the adhesive was applied either following the ER or the SE strategy
7
5-To compare the differences in the resin-dentin interface morphology when the adhesive was applied following the ER strategy, with and without pulpal pressure H0: There were no differences in the resin-dentin interface morphology when the adhesive was applied following the ER strategy, with and without pulpal pressure H1: There were differences in the resin-dentin interface morphology when the adhesive was applied following the ER strategy, with and without pulpal pressure
6-To compare the differences in the resin-dentin interface morphology when the adhesive was applied following the SE strategy, with and without pulpal pressure
H0: There were no differences in the resin-dentin interface morphology when the adhesive was applied following the SE strategy, with and without pulpal pressure
H1: There were differences in the resin-dentin interface morphology when the adhesive was applied following the SE strategy, with and without pulpal pressure
8
III. Materials and Methods
1. Experimental design
Experimental in vitro study with the purpose of evaluating the microtensile bond strength and the adhesive interface morphology of an universal adhesive system, Futurabond M+ (FB), in the etch-and-rinse strategy and in the self-etch strategy, with and without pulpal pressure.
The significant number of specimens (n) to be tested in the present study was calculated with a level of significance (α) of 0,05 and a power (β) of 80% through Snedecor & Cochran’s formula: n=1+2C (s/d)2, in which s represents the standard deviation, d the difference to be detected and C a constant dependent on α and β’s values (Clark 1991).
As a result, forty caries-free extracted human molars were disinfected and stored in 0,5º chloramine at 4ºC and used within six months after extraction. The teeth collection was executed after being approved by the Dental School’s Ethics Committee, respecting the donor’s anonymity.
The roots and the occlusal third of each tooth were removed in two cuts, using a low-speed diamond saw (Lapcraft, OH, USA; 4” x .012” x ½”), on a hard tissue microtome (Isomet 1000 Precision Saw, serial number: 666-IPS-03518, Buehler, Lake Bluff, IL, USA) under constant water irrigation (Figure 1).
9
The first cut was made 2mm bellow the cementoenamel junction and the second one removed the occlusal enamel and superficial dentin. After that the remaining pulp tissue was removed and the occlusal surface was polished with a 600-grit silica carbide (SiC) sandpaper (Buhler, Lake Bluff, IL, USA) in order to obtain dentin discs with a remaining thickness of 1-2 mm from the pulp horn to the dentin surface.
In order to create a uniform smear layer, the dentin surface was polished with a 320-grit silica carbide (SiC) sandpaper (Ref.: 30-5218-320, Buhler, Lake Bluff, IL, USA) under constant water irrigation for 2 minutes.
The specimens were randomly assigned to four experimental conditions (n=10) (Figure 2):
Group A: FB in etch-and-rinse strategy without pulpal pressure
Group B: FB in self-etch strategy without pulpal pressure
Group C: FB in etch-and-rinse strategy with pulpal pressure
Group D: FB in self-etch strategy with pulpal pressure
2. Materials
In the present study the following materials were utilized: one universal adhesive system Futurabond M+, utilized both in the etch-and-rinse strategy (2 steps) and in the self-etch strategy (1 step); phosphoric acid gel 35% and a flow resin composite (Figure 3). The information regarding these materials is described in Table 1.
Figure 2 – Specimen division into the 4 experimental groups, adapted from Oliveira 2014 (Oliveira
2014).
10
Material Composition Application mode Futurabond M+ Voco, Cuxhaven, Germany Batch number:1511268 Expiry date:12/2016 2-Hydroxyethyl methacrylate (10%-25%), BIS-GMA (10%-25%), ethanol (10%-25%), acidic adhesive monomer (2.5%-5%),
Urethanedimethacrylate (2.5%-5%),
catalyst (≤ 2,5%), pyrogenic silicic acids (≤ 2,5%)
Etch-and-rinse
1-Apply the phosphoric acid gel (35%) for 15 seconds. Rinse with water for 20 seconds and dry off the excess water with a gentle stream of air
2-Apply the adhesive, rubbing it in for 20 seconds. Dry off with dry, oil-free air for at least 5 seconds
3-Polymerize for 10 seconds
Self-etch
1-Apply the adhesive, rubbing it in for 20 seconds. Dry off with dry, oil-free air for at least 5 seconds
2-Polymerize for 10 seconds
Vococid® Voco GmbH, Germany Batch number:1535595 Expiry date:12/2017 35% Phosphoric Acid pH(20ºC)= 0,8
1- Apply on the dentin surface for 15 seconds
2- Rinse with water and dry with air syringe until the excess water is removed
Grandio® SO flow Voco GmbH, Germany Batch number:1551095 Expiry date:06/2016 HEDMA (5-10%), BIS-GMA (2,5-5%), Triethylene glicol dimethacrylate (2,5-5%), BIS-HEMA (≤ 2,5%)
1- Apply the resin composite directly on the tooth surface with a dispensing syringe after the adhesive system application 2- Photopolymerize for 20
seconds (minimum 500mW/cm2)
Table 1 – Materials, composition and application modes. Figure 3 – Adhesive system, resin composite and phosphoric acid (35%).
11
3. Specimen preparation
In the etch-and-rinse strategy (groups A and C), the smear layer was removed through the application of phosphoric acid 35% (Vococid ®, Voco, Germany) during 15 seconds, which was then rinsed off with water. The adhesive was applied evenly and rubbed in for 20 seconds with a disposable brush, the surface was gently air-dried for 5 seconds in order to remove any solvents and photocured for 10 seconds (1200 mW/cm2, Bluephase ® 20i, LED Curing Light, serial number 506160, Ivoclar Vivadent, Schaan, Liechtenstein), according to the manufacturer’s instructions (Table 1). This was followed by the application of three increments of 2 mm of a nanohybrid resin composite (Grandio® SO flow, Voco, Germany), which were polymerized for 20 seconds each, except for the last increment which was polymerized for 40 seconds.
In the self-etch strategy (groups B and D), the phosphoric acid is not applied but the further steps are the same.
In addition, for specimens in groups C and D a pulpal pressure device was used based on the ones developed by Sauro et al (Sauro et al., 2007; Sauro et al., 2009), in order to simulate pulpal pressure during the adhesive system application (Figure 4). Each specimen in these groups was glued to an acrylic plate with cyanoacrylate (Loctite Super Cola 3, Henkel, Alverca, Portugal), and submitted to a constant pressure of 77 cm H2O, through an 18G needle, during 10 minutes (Brown and Yankowitz 1964). After
this 10 minutes, with the specimen still in the pulpal pressure device the adhesive system and resin composite were applied in the respective chosen strategy for each group according to the instructions described above (Figures 5, 6 and 7).
12
The specimens were then stored in distilled water in an incubator for 24 hours at 37ºC.
Posteriorly, the teeth were longitudinally sectioned with a low-speed diamond saw under water irrigation, dividing them into two halves. One of the halves was then longitudinally sectioned in both “x” and “y” directions across the bonded interface, thus creating sticks with a cross-sectional area of approximately 1mm2. The other half was sectioned, in order to create 2 quarters of the initial specimen, and used for SEM observation.
The sticks were immediately submitted to microtensile bond strength testing.
4. Microtensile bond strength
The sticks were individually attached to a stainless-steel grooved Geraldelli’s jig with cyanoacrylate glue (Permabond ® 737, black magic toughened adhesive, Permabond, UK) (Figure 8) and then submitted to a tension load in a universal testing machine (4500 Instron, Grove City, PA, USA) (Figure 9), with a 1 kN load cell travelling at a crosshead speed of 1 mm/min until fracture occurred.
Figure 6 – Adhesive system application
with a disposable brush.
Figure 7 – Specimen after the application and
13
A caliper was used to measure the bonding interface’s sides and calculate the bonding area in mm2. The μTBS was calculated by dividing the force imposed at time of fracture by the calculated bonding area (mm2), in MPa, through Series IX Programme (Automated Materials Test System, version 8.34.00, serial number 21744H, Instron Corporation, Grove City, PA, USA).
The failure modes for each sample were evaluated using a stereomicroscope (Nikon, Japan) at 10x magnification and classified as: adhesive (A, at the resin-dentin interface), cohesive in composite (CC, entirely within the composite), cohesive in dentin (CD, entirely within the dentin substrate) and mixed (M, at the resin-dentin interface with both composite and resin at the interface) (Wagner et al., 2014).
5. Scanning electron microscopy
The specimens obtained for SEM observation were fixed in 2,5% glutaraldehyde for 24 hours at 4ºC and subsequently immerse in a solution of 0,1 M sodium cacodylate (pH=7,4).
The specimens’ bonded interface was polished with silica carbide (SiC) sandpapers (Ref. 30-5218; Buehler, Lake Bluff, IL, USA) of increasing grit: 600-grit followed by 1000-grit and 2500-grit for 30 seconds each. Moreover, they were also polished with diamond suspensions (Meta Di® Monocrystalline Diamond Suspension, Buehler, Lake Bluff, IL, USA) of 6μm, 3μm and 1μm in felt cloths (Whitefelt, Ref.162002, Buhler, Lake Bluff, IL, USA), for 60 seconds each.
Figure 8 – Specimen attached to
a Geraldelli’s jig.
Figure 9 – Specimen positioned in the
14
The specimens were submerged in an ultrasonic bath (Bransonic®Sonic Bath, model M2800-E, serial number BHS021631000B, Branson Ultrasonic Corporation, Danbury, USA) filled with 100% ethanol for 1 minute at the end of each grit and also at the end of each diamond suspension in order to remove the remains of the diamond suspensions and of smear layer.
With regard to exposing the hybrid layer, the specimens were immersed in 0,6M of hydrochloric acid for 90 seconds, rinsed with distilled water, immersed in 10% sodium hypochlorite for 60 seconds and rinsed with water again. Thereafter they were dehydrated through the use of increasing concentrations of ethanol solutions: 25%, 50% and 75% for 20 minutes, 95% for 30 minutes and 100% for 60 minutes. The dehydrations were followed by the immersion in hexamethyldisilazane (Ref.: 440191-1L; Sigma Aldrich) for 10 minutes and left to dry for another 10 minutes at room temperature.
Finally, the specimens were attached to aluminium stubs with double-faced carbon tape (NEM TAPE, Nisshin Em.Co, Ltd., Japan) and covered in silver ink (Pelco® Colloidal Silver liquid, batch number 148005201, Ted Pella Inc., CA, USA). Specimens were sputtered with 200 nm gold/palladium in a JEOL Fine Coat Ion Sputter (JFC-1100E, serial number SM333132-670, Tokyo, Japan).
Resin-dentin interfaces were analysed in a scanning electron microscope Hitachi S-450 (Serial number 5333884, Tokyo, Japan) and the micrographs were obtained with a 2000x magnification for all specimens. Moreover, when needed, other magnifications were used in order to better analyse the resin-dentin bonded interface. After this, the micrographs were digitalised into the associated microanalysis system Esprit 1.8.2.2167 (Bruker, MA, USA).
6. Statistical analysis
The statistical analysis of the results was performed through the SPSS program (Statistic Package for Social Sciences; IBM SPSS statistics V21). The Kolmogorov-Smirnov Tests were used to access whether the data followed a normal distribution. The Levene Test was computed to determine if the assumption of equal variances was valid. Since these assumptions were not observed, non-parametric Kruskal-Wallis and Mann-Whitney tests were used to compare the microtensile results. Bonferroni test corrected the level of significance to 0,0083.
15
IV. Results
1. Microtensile bond strength
The results of the microtensile bond strength tests (μTBS) are summarized in Table 2, where the number of microtensile sticks (n), mean, standard deviation (SD), minimum (Min) and maximum (Max) values for each experimental group are registered.
The pretesting failures that occurred during specimen preparation were registered but not considered for the statistical analysis.
Group n Mean ± SD Min Max
A (FB ER) 10 33,7 ± 7,5 19,37 43
B (FB SE) 10 31,5 ± 6,9 24,56 45,7
C (FB ER PP) 10 6,8 ± 2,1 3,934 9,167
D (FB SE PP) 10 3,9 ± 1,6 2,134 6,571
Since the normality of the data distribution was observed but not the homogeneity, data were analysed using non parametric tests.
The highest mean μTBS was observed with group A (33,7 ± 7,5 MPa) and the lowest was obtained with group D (3,9 ± 1,6 MPa).
There were no statistically significant differences (p>0,05) in μTBS between the specimens prepared with ER and the SE modes within the experimental groups without pulpar pressure (p>0,05). However, in the groups subjected to pulpar pressure, statistically significant differences were observed between the ER and SE modes, with the ER mode presenting higher μTBS values.
Statistically significant differences in μTBS (p<0,05) were also perceived when the experimental groups with pulpal pressure were compared with the ones without pulpal pressure. The mean μTBS was statistically lower when pulpal pressure was present (p<0,05) (Figure 10).
Table 2 – Microtensile bond strength (μTBS) values (n, Mean and SE and SD) of the different
16
As far as failure modes are concerned, the most common type of failure pattern present in this study was “adhesive” in all of the four experimental groups tested.
2. Scanning electron microscopy
The resin-dentin interface morphological analysis was conducted for all of the experimental groups and the images obtained from the scanning electron microscopy are presented below.
Overall, the hybrid layer could not be identified in all experimental groups, especially in the ones that followed the SE strategy (Figures 11, 12, 13, 14).
Concerning the ER mode, in the group without pulpal pressure, a large area filled with resin tags could be observed as well as some lateral branches (Figure 11). In the group with pulpal pressure, the resin tags are smaller, less defined and with no lateral branches present (Figure 13).
Regarding the SE mode, in the group without pulpal pressure, only a few resin tags could be identified (Figure 12) and in the group with pulpal pressure, no resin tags could be found. Moreover a considerable gap between the adhesive layer and the dentin surface was observed (Figure 14).
Adhesive mode
Figure 10 – Graphic relating the μTBS values, the adhesive application mode and the presence or
17
Figure 11 – SEM micrograph of resin-dentin interface formed with Futurabond M+ under the ER
mode, without pulpal pressure at 2000x magnification. (C) Resin composite; (H) hybrid layer; (A) adhesive; (T) resin tags. Note the hybrid layer and the area densely filled with resin tags in both images. C H A T C A T
Figure 12 – SEM micrograph of resin-dentin interface formed with Futurabond M+ under the SE
mode, without pulpal pressure at 2000x magnification. (C) Resin composite; (H) hybrid layer; (A) adhesive; (T) resin tags. Note the hybrid layer and the presence of some resin tags in both images.
C T A C T A
18
Figure 13 – SEM micrograph of resin-dentin interface formed with Futurabond M+ under the ER
mode, with pulpal pressure at a 2000x magnification. (C) Resin composite; (H) hybrid layer; (A) adhesive; (T) resin tags. Note the hybrid layer and the presence of some resin tags in both images.
C H T A C H T A
Figure 14 – SEM micrograph of resin-dentin interface formed with Futurabond M+ under the SE
mode, with pulpal pressure at 2000x and 4000x magnifications. (C) Resin composite; (H) hybrid layer; (A) adhesive; (T) resin tags. Note the hybrid layer, the absence of resin tags and the presence of a gap between the adhesive and the dentin surface in both images.
C
A
C
19
V.
Discussion
The efficacy of one universal adhesive, applied following both the ER and the SE strategies, with and without pulpal pressure, was evaluated through microtensile bond strength testing and through the analysis of the resin-dentin interface morphology, in the present experimental in vitro study.
In clinical circumstances, dentin surface is maintained constantly wet due to the dentinal fluid which circulates inside the dentinal tubules, under a constant intrapulpal pressure (IPP) (Rodrigues et al., 2015). However, intrapulpal pressure has hardly been simulated in vitro and, as a consequence, the absence of an outward fluid through dentin tubules represents one of the differences between clinical and laboratorial conditions that can influence the results. Thus, the simulation of pulpal pressure in in vitro studies is of the utmost importance so that the conclusions drawn in these studies can be inferred in the in vivo setting (Cardoso et al., 2008). Consequently, in this experimental study, pulpal pressure was simulated through a pulpal pressure device based on the ones developed by Sauro et al. (Sauro et al., 2007; Sauro et al., 2009).
A few authors have already simulated pulpal pressure in their studies, however the pressure values used are not consensual, varying from 15 to 200 cmH2O (Grégoire et al., 2003; Grégoire et al., 2005; Sauro et al., 2007; Hosaka et al., 2007; Cardoso et al., 2008; Sauro et al., 2009). Moreover, the effect of local anaesthesia on the pulpal pressure has also been evaluated in the literature and the majority of the studies refer that there is a slight decrease in the IPP values which returns to normal shortly after. Overall, it is considered that those variations are not significant and that IPP maintains constant values (Beveridge & Brown 1965; Harrington et al., 1970; Simard-Savoie et al., 1979; Simard-Savoie et al., 1990).
Brown and Yankowitz conducted a study in which they directly measured intrapulpal pressure in vivo and obtained a mean value of 77 cmH2O, which was the
constant adopted value in the present study (Brown and Yankowitz 1964).
Regarding the failure modes, the most common type of failure pattern present in this study was “adhesive” in all of the four experimental groups tested, which is in agreement with several studies in the literature where it is reported that the predominant failure mode for the UA tested was “adhesive” (Muñoz et al., 2013; Muñoz et al., 2014; Wagner et al., 2014; Marchesi et al., 2014).
20
Considering the pretesting failures (PTF), they were registered but not included in the statistical analysis. This decision relies on the fact that the specimens prepared for microtensile bond strength testing are cut into an area of 1mm2 or less which is much
smaller than those prepared for macrotensile tests, for instance (Van Meerbeek et al., 2010). Hence, the stress to which the μTBS specimens are subject to could produce microfractures at the interface which could weaken the bond and, consequently, reduce the actual bond strength (Van Meerbeek et al., 2003). In addition, the literature is not consensual about the value that should be attributed to the pretesting failures. Mine et al. 2009 and Meerbeek et al. 2010 refer that PTF could be considered as 0 MPa, which actually penalizes the adhesive too severely (as there is always a certain amount of bond strength) or it could be excluded from the average μTBS calculation or it could receive the lowest μTBS measured within the respective group (Mine et al., 2009; Van Meerbeek et al., 2010). It should be mentioned, however, that the exclusion of PTF in this study could have overestimated the actual bond strength (Van Meerbeek et al., 2010; Wagner et al., 2014).
In the μTBS analysis, there were statistically significant differences between the specimens prepared with ER and the SE modes in the groups with pulpal pressure (p<0,05), but not in the groups without pulpal pressure where the ER mode performed slightly better (p>0,05). Thus, the first null hypothesis was rejected.
This results are in accordance with a study conducted by Muñoz et al. in 2014, where the UA tested had slightly better μTBS values when applied in the ER mode (Muñoz et al. 2014). Notwithstanding, another study where an adhesive produced by the same manufacturer and with a similar chemical composition was studied (Futurabond U) it is reported that there were no statistically significant differences in μTBS between the ER and SE modes (Wagner et al. 2014). Moreover, Marchezi et al. in 2014 have also shown that the UA tested had no statistically significant differences in μTBS values between both adhesive application modes (Marchesi et al. 2014).
The presence of the smear layer imposes a physical barrier against the penetration of resin monomers. Phosphoric acid etching removes the smear layer, promotes the demineralization of superficial dentin and creates porosities within the underlying collagen fibrillar matrix, which are then infiltrated by resin monomers that polymerize in situ (Van Meerbeek et al., 2003; Pashley et al., 2011; Sezinando 2014; Muñoz et al., 2014), thus leading to the formation of a thick hybrid layer, fully integrated with the dentin (Muñoz et al., 2014). Conversely, the SE strategy does not
21
have the acid etching step as the smear layer is not removed, it is instead integrated into the adhesive interface (Sezinando 2014) through the action of the acidic monomers that simultaneously “condition” and “prime” the dental substrate (Van Meerbeek et al., 2011; Muñoz et al., 2013; Sezinando 2014). In order words, the acidic monomers demineralize and infiltrate the tooth surface simultaneously, theoretically ensuring complete penetration of the adhesive (Van Meerbeek et al., 2011). In addition, the smear layer produces most of the resistance to the flow of fluid across dentin (Pashley, 1984) and thus it could be expected to be an advantage of the SE mode, as the water from the dentinal tubules would not reach dentin surface as easily, not interfering with the adhesive procedures, leading to similar values of μTBS as those obtained without pulpal pressure and higher than those of the ER mode with pulpal pressure. Nonetheless, this was not observed and one could hypothesized that the mentioned barrier could instead reduce the bonding effectiveness by not allowing for a complete infiltration in the dentin substrate and in situ polymerization of the resin monomers (Muñoz et al., 2014).
As far as the second and third null hypothesis are concerned, they were rejected since there were statistically significant differences in μTBS when the experimental groups with pulpal pressure were compared with the ones without pulpal pressure (p<0,05). For both adhesive application modes (ER and SE) the μTBS values were significantly lower when pulpal pressure was present. Hence, it can be speculated that the presence of water significantly diminished the adhesive resistance in the present study.
Although it has been reported that moisture on dentin surface is essential for a successful bonding protocol, an overwet condition may contribute negatively to the adhesive procedure. The advantages of a wet bonding technique are related to the ability of water to keep the demineralized collagen network open during primer infiltration. However, fluid flow through dentin may result in large amounts of water on the surface to be bonded, thus preventing the optimal interaction between the adhesive and the dentin substrate (Cardoso et al., 2008). In addition, Inokoshi et al. in 1982, reported that water could also interfere with the etching acid, preventing the acid from reaching the pulp when applied for a short time (Inokoshi et al., 1982) which consequently limits the resin monomer infiltration through the dentinal tubules and demineralized collagen network, thus preventing resin tags and hybrid layer formation (Cardoso et al., 2008). Furthermore, excessive moisture on the adherent substrate is also responsible for a
22
lower degree of resin monomer conversion which reduces the mechanical properties of the adhesive layer (Hosaka et al., 2007; Cardoso et al., 2008), namely its ultimate tensile strength (Sauro et al., 2007).
Hosaka et al. 2007, Sauro et al. 2007 and Cardoso et al. 2008 investigated the effect of pulpal pressure in μTBS of contemporary dental adhesives and they all concluded that μTBS values were significantly lower when pulpal pressure was simulated which corroborates the findings of the present study (Hosaka et al., 2007; Sauro et al., 2007; Cardoso et al., 2008).
It is also pertinent to analyse the chosen adhesive’s composition and its role in the results obtained in the present study. The solvents present in FB are water and ethanol and it is referred in the literature that these two solvents are less effective than the solvent acetone when it comes to displacing moisture from the dentin surface since they do not promote an intense water evaporation as the latter (Cardoso et al., 2008). Adding to this, FB also has the hydrophilic monomer 2-hydroxyethyl methacrylate (HEMA) in its composition and if on the one hand it is a positive aspect as it improves wetting and spreading of adhesives on dentin which helps the adhesion process, on the other hand they also permit movement of water molecules from dentin across the adhesive layer when excess water is present (Sauro et al., 2007). These two aspects combined could help explain the lower μTBS obtained for FB when pulpal pressure was present. In spite of this, future studies should be conducted in order to evaluate HEMA’s role in long term adhesion.
Concerning the resin-dentin morphological analysis, the hybrid layer could not be identified in all experimental groups, especially in the ones that followed the SE strategy, which is not uncommon in SEM analysis since this adhesives usually produce very thin hybrid layers (Rodrigues et al., 2015). Differences were also identified in the formation of resin tags, in the ER mode large areas filled with long and denser resin tags that are hybridized in the upper portion of the dentinal tubules could be observed as well as some lateral branches. Whereas in the SE mode fewer thinner shorter resin tags were observed.
Comparing with the groups were pulpal pressure was present, the hybrid layer was also only identified for the ER mode and structural defects were identified in the resin-dentin interface. In the ER mode it seems that the resin tags are not complete besides being smaller, less defined and with no lateral branches present (Toledano et al., 2006; Sauro et al., 2007; Rodrigues et al., 2015). Conversely, in the SE mode no resin
23
tags could be found and a considerable gap between the adhesive layer and the dentin surface was observed (Sauro et al., 2007).
Thus, the fourth null hypothesis was rejected since there were differences in the resin-dentin interface between both adhesive application systems. The fifth null hypothesis was also rejected since the simulation of pulpal pressure caused differences in the resin-dentin interface when the adhesive was applied in the SE mode. Similarly, the sixth null hypothesis was rejected as the simulation of pulpal pressure caused differences in the resin-dentin interface when the adhesive was applied in the ER mode.
Pulpal pressure clearly leads to significant differences both in the microtensile bond strength analysis and in the resin-dentin interface morphological analysis of universal adhesives. Hence, it becomes increasingly more important that researchers simulate pulpal pressure in their in vitro studies in order to better represent clinical conditions.
24
Conclusions
Within the limitations of this experimental in vitro study, the following conclusions were drawn:
- There were no statistically significant differences in μTBS between the specimens prepared with ER and the SE modes without pulpal pressure, however, differences were observed between these two modes with pulpal pressure;
- In the presence of pulpal pressure, μTBS values were significantly lower for both the ER and SE application modes, which means that in the present study, the presence of water significantly diminished the adhesive resistance;
- The presence of pulpal pressure also caused structural defects in the resin-dentin interface morphology, namely in the ER mode the resin tags are smaller, less defined, not complete and with no lateral branches present. In the SE mode no resin tags could be found and a considerable gap between the adhesive layer and the dentin surface was observed.
Concluding, pulpal pressure clearly leads to significant differences both in the microtensile bond strength analysis and in the resin-dentin interface morphological analysis of universal adhesives. Hence, it is extremely important that researchers conduct future in vitro studies to evaluate the performance of FB with pulpal pressure on long-term water storage.
25
References
Armstrong S, Geraldeli S, Maia R, Raposo LHA, Soares CJ, Yamagawa J. Adhesion to tooth structure: A critical review of “micro” bond strength test methods. Dental Materials. 2010;26(2):50–62.
Armstrong SR, Boyer DB, Keller JC. Microtensile bond strength testing and failure analysis of two dentin adhesives. Dental Materials. 1998;14(1):44–50.
Beveridge E, Brown A. The Measurement of Human Dental Intrapulpal Pressure and Its Response To Clinical Variables. Oral surgery, oral medicine, and oral pathology. 1965;19:655–68.
Breschi L, Mazzoni A, Ruggeri A, Cadenaro M, Di Lenarda R, De Stefano Dorigo E. Dental adhesion review: Aging and stability of the bonded interface. Dental Materials. 2008;24(1):90–101.
Brown C, Yankowitz D. Tooth Pulp Tissue Pressure and Hydraulic Permeability. Circulation research. 1964;15(1):42–50.
Cardoso MV, Moretto SG, Carvalho RCR De, Russo EMA. Influence of intrapulpal pressure simulation on the bond strength of adhesive systems to dentin. Brazilian oral research. 2008;22(2):170–5.
Cardoso PE, Braga RR, Carrilho MR. Evaluation of micro-tensile, shear and tensile tests determining the bond strength of three adhesive systems. Dental materials : official publication of the Academy of Dental Materials. 1998;14(6):394–8.
Chen C, Niu L-N, Xie H, Zhang Z-Y, Zhou L-Q, Jiao K, et al. Bonding of universal adhesives to dentine - Old wine in new bottles? Journal of dentistry. 2015;43(5):525–36.
Clark V. Sample size determination. Plastic and reconstructive surgery. 1991 Jan 1;87(3):569–73.