Fortaleza, CE, INOVAGRI – http://www.inovagri.org.br DOI: 10.7127/rbai.v11n300586
Protocolo 586.17 – 01/03/2017Aprovado em 22/03/2017
TEMPORAL VARIATION OF THE MATRIC POTENTIAL OF A LATOSOL MONITORED BY TENSIOMETRY
Nelmício Furtado da Silva1, Fernando Nobre Cunha2, Marconi Batista Teixeira3,
Frederico Antonio Loureiro Soares3, Camylla Vieira de Sousa4
1 Professor Doutor em Engenharia Agrícola, Universidade Estadual da Paraíba, Campus IV, Catolé do Rocha-PB, Brasil, E-mail: [email protected]
2 Doutorando em Engenharia Agrícola, Universidade Federal de Campina Grande, Campus I, Campina Grande-PB, Brasil, E-mail: [email protected]
3 Graduado(a) em Licenciatura em Ciências Agrárias, Universidade Estadual da Paraíba, Campus IV, Catolé do Rocha-PB, Brasil, E-mail: [email protected]; [email protected]; [email protected] 4 Mestrando em Ciência do Solo, Universidade Federal da Paraíba, Campus II, Areia-PB, Brasil. E-mail: [email protected]
ABSTRACT
In order to obtain soil water availability data, monitoring with some devices is necessary, in which tensiometers are highlighted. However, there are factors that may cause errors in the readings of this equipment. Thus, the aim of this study was to monitor the water potential of a dystrophic Red Latosol with straw coverage at different times of the day, through tensiometers installed at different depths. The experiment was conducted in pots with a completely randomized design, with three repetitions in a 3x 3 x 2 factorial. Three times and three tensiometric cup installation depths, with and without straw soil coverage. Tensiometer evaluation time influenced soil water matric potential, and the highest soil water matric potential values were found in the uncovered soil. In the 12 p.m. evaluation time, the highest soil water matric potential mean values were observed, for both covered and uncovered soils. In addition, there was a 51.18% difference for 8 a.m. in the uncovered soil and a 30.10% difference in the soil covered by straw. Tensiometer installation depths influence soil water matric potential variation. The water soil matric potential values were observed at a depth of 0.15m. The highest soil water matric potential variation was observed in the uncovered soil at a depth of 0.15 m, except for 4 p.m., in which the highest variation was observed at the depth of 0.30 m. The variance tends to be higher at a depth of 0.15 m 12 p.m.
Keywords: irrigation management, soil cover, soil water tension.
VARIAÇÃO TEMPORAL DO POTENCIAL MÁTRICO DE UM LATOSSOLO MONITORADO POR TENSIOMETRIA
RESUMO
A partir da hipótese de que o horário de coleta e a cobertura do solo podem influenciar nos valores de leitura da tensão de água no solo em diferentes profundidades, objetivou-se com
este trabalho monitorar o potencial da água em um Latossolo Vermelho distroférrico (LVdf) com efeito de cobertura com palhada, em diferentes horários do dia por meio de tensiômetros instalados em diferentes profundidades. O experimento foi realizado em vasos com delineamento inteiramente casualizado, com três repetições, em fatorial 3 x 3 x 2, sendo três horários para avaliação do potencial da água, três profundidades de instalação das cápsulas tensiométricas, com e sem cobertura do solo com palhada. O horário de avaliação dos tensiômetros influenciou o potencial matricial da água no solo, sendo que no solo descoberto de palhada houve os maiores valores de potencial matricial de água no solo. No horário de avaliação de 12 horas, observaram-se os maiores valores médios de potencial matricial da água no solo, tanto no solo coberto como descoberto, sendo que houve uma diferença correspondente a 51,18% para as 8 horas no solo descoberto e 30,10% no solo coberto de palhada. As profundidades de instalação dos tensiômetros influenciaram na variação do potencial matricial da água no solo. Os maiores valores de potencial matricial da água no solo foram observados na profundidade de 0,15 m. Houve maior variação do potencial matricial da água no solo descoberto de palhada na profundidade de 0,15 m, exceto para as 16 horas onde a maior variação foi observada na profundidade de 0,30 m. A variância tendeu a ser mais elevada na profundidade de 0,15 m as 12 horas.
Palavras-chave: Manejo de irrigação, cobertura do solo, tensão de água no solo.
INTRODUCTION
Irrigation management is aimed at rational use of water in agriculture, allowing for a more efficient water use and economic, socially and environmentally sustainable irrigation practice. According to Bezerra et al. (2012), in order to obtain soil water availability data, monitoring is required. Therefore, some devices are used, especially tensiometers. Tensiometers are devices that measure the tension at which water is retained in the soil, within its pore spaces of different diameters (macro and micropores). Water is retained due to capillary action and adsorption on the surface of particles, and both phenomena are jointly called matric potential.
Among tensiometers, the most used are, as follows: puncture tensiometers, tensiometers with vacuum gauge and mercury tensiometers. According to Braga and Calgaro (2010), currently, puncture tensiometers are widely used due to ease of handling. The tensiometer is basically composed of a porous ceramic cup, a PVC tube with about 1/2 inch, and other connections that ensure vacuum gauge or
silicone rubber insertion (BRAGA and CALGARO, 2010).
Tensiometers have advantages over irrigation management through climatic water balance, based on the Class A Pan method. Turco et al. (2009) concluded that, in treatments in which irrigation management was carried out by Class A Pan method, due to increased water consumption, the highest energy consumption and costs were observed, compared to treatments in which management was carried out by tensiometry. Although it has some limitations, the tensiometer has been used satisfactorily to determine the energy with which water is retained by the soil solid part. One of its limitations is that it works up to about -85 kPa. Taking into account that the agronomically important matric potential ranges from 0 to -1500 kPa, the tensiometer could be considered a limited device (BRITO et al., 2009). However, this device suits well for commercial agriculture irrigation management, in which the range is from 0 to -100 kPa, and the soil is usually irrigated before reaching this tension (KLEIN, 2001).
In order to work with tensiometers, several factors must be taken into account to
avoid reading errors, which include device choice (FRANCO, 2015), installation process (MARTINS, 2009; BRAGA and CALGARO, 2010), spacing, and the number of tensiometric units to represent the managed area (OLIVEIRA et al., 2014). For Coelho and Teixeira (2004), one of the main factors that may cause tensiometer reading errors is the temperature difference to which cups are subjected during the course of the day. In addition, there is little information related to cropping systems with and without straw coverage of the soil. Thus, on the assumption that collection time and soil cover may influence soil water tension reading values at different depths, the aim of this study was to monitor the water potential in a dystrophic Red Latosol, with straw coverage at different times of the day, through tensiometers installed in different depths.
MATERIAL AND METHODS The experiment was conducted at the Federal Institute of Goiás, Rio Verde Campus, GO. The climate is classified according to Köppen as Aw (tropical), with rain from October to May and drought from June to September. Rainfall varies from 1500 to 1800 mm annually. The geographical coordinates of the location where the study was conducted are 17°48’19.98’’S and 50°54’16.06’’W. During the study implementation period, average climate data were, as follows: minimum temperature of 18. 67 °C, average temperature of 24.70 °C, maximum temperature of 30.83°C, RH of
63.74%, maximum solar radiation of 624 W m-2 at midday, and medium dew point
temperature of 13.3 °C. A dystrophic Red Latosol (EMBRAPA, 2013) was used. The physical characteristics of the soil can be observed on the Table 1.
The experiment was conducted in pots in a completely randomized design (CRD) with three replications, in a factorial 3 x 3 x 2, three times the evaluation matrix potential with tensiometers (8:00, 12:00 and 1600 hours), three depths location of tensiometer capsules (0.15 m, 0.30 m and 0.45 m) and two ground cover conditions (uncovered and covered with straw).
Tensiometers tube made of PVC and acrylic were used. The portion introduced in the soil was composed of the PVC tube and the upper, to carry out the reading and inserting the silicone rubber, the acrylic part without tensiometer. The tension meters have been installed in each vessel at depths of 0.15, 0.30 and 0.45 m, and spaced 0.20 m. The vessels from stainless steel (internal diameter on the surface of the soil 1.5 m and 0.75 m of total soil depth) volume of 500 L and each on had a deep drainage system consisting of two layers: 0.05 m of no. 0 gravel; 0.05 m of no. 1 gravel and the
separation between the drainage layer and the soil was used Bidin® pad (Figure 1).
The soil volume corresponding to the pot volume was removed manually. Removed volumes, which corresponded to each soil profile phase, were packed again according to removal order. The soil was wetted manually with the help of a watering can for two weeks, so that soil particles were stabilized, avoiding their dispersion
Depth; Ds - soil density; O.M - organic matter; m - aluminum saturation; CEC - cation exchange capacity; SB - sum of bases; V – base saturation.
Depth m Ds g cm-3 Grain Size (%) Classification
Sand Silt Clay
0 – 0.45 1.20 43 5 52 Clayey Depth m O.M g dm-3 pH CaCl2 P mg dm-3 K Ca Mg Al M % CEC SB V % cmolcdm-3 0 – 0.45 22.8 5.42 1.6 0.81 3.61 0.65 0.01 0.19 10.32 5.12 50
and breakdown in the pots. Afterwards, samples were collected at different depths, in order to keep characteristics the soil.
During tensiometer installation, the methodology described by Braga and Calgaro (2010) was used, in which the soil was treated in the tensiometer installation depth with the aid of a soil auger. Subsequently, a “fluid mud” was prepared with the same soil taken from the cup installation depth, and this material was later inserted to the bottom of the hole.
In pots in which straw soil coverage was provided, bahiagrass (Paspalum
notatum) pruning residue was used on a 5 cm
layer. Each tensiometer battery consisted of three tensiometer rods, which were installed with 0.2 m spacing. Tensiometer readings for soil matric potential record were conducted daily, between May and June 2014, a total of 60 readings for each container depth through only a digital tensiometer (Mano-vacuum gauge) with measurement interval matrix potential of 0-96 kPa (vacuum), wrapped in rubber cover, 9V, needle puncture involved with protection tube in crystal PVC, manufactured with imported vacuum gauge with an accuracy of 2%.
The determination of the matric potential (Ψ) of the soil as tensiometer was taken with the digital readout given in kPa, which was converted to matric potential at the midpoint (average length) of the microporous capsule at each depth in the soil by the equation:
where: Ψ is the soil water matric potential, in kPa (negative); L is the device display reading, in kPa (negative); c is the tensiometer length (distance from the middle of the porous cup to the center of the acrylic tube, at the top of the device), in meters; and 0.098 is the units fitting factor.
Matric potential data (Ψ) were subjected to analysis of variance (p <0.05) and, in cases of significance, Tukey test (p <0.05) was performed using the SISVAR (FERREIRA, 2011) statistical software. Descriptive analysis was conducted using the Microsoft Excel Action 2.7 supplement, and for this, the water tension values in soil were considered in module for better understanding and discussion.
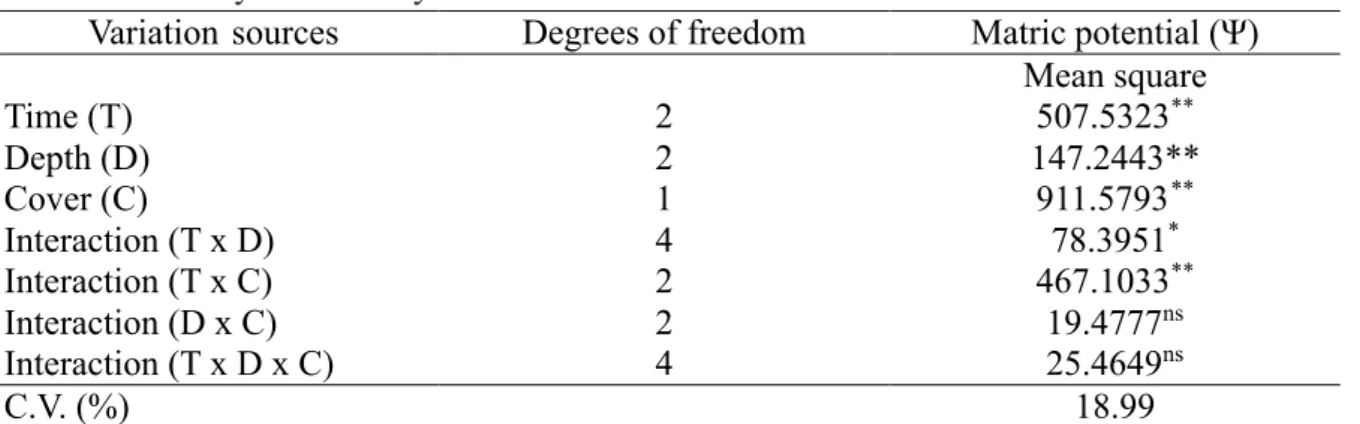
RESULTS AND DISCUSSION In the summary of the analysis of variance, there was significant effect for Evaluation time (T), Depth (D) and Soil Cover (C) factors, when analyzed in isolate, as well as for the interaction between (T x D) and (T x C) (Table 2).
In the mean test for matric potential of soil water (Ψ) as a function of depth (Table 3), it is observed that under Ψ, recorded at 12 p.m. in all depths, however, there was no significant difference between 12 p.m. and 4 p.m. in depth of 0, 30 m between 8 a.m. at a depth of 0.15 m, and there was no difference between 8 a.m. and 4 p.m. in any depth of installation of tensiometers. In depth of 0.15 m matric potential difference between the evaluation times of 12 p.m. and 4 p.m. was 27.08%, since the depth of 0.30 m between 8 a.m. and 12 p.m. schedule was found a difference of 29.32% and 0.45 m in depth between 8 a.m. and 12 p.m. was no difference of 56.92% and between 12 p.m. and 16 p.m. was 41.48% difference
When Ψ is analyzed at different depths, it is observed that there was significant difference only in the 0.45 m depth at 8
Figure 1. Side profile of the reservoir used for tensiometer installation.
L 0.098c Ψ = +
a.m. (Table 3). The results corroborate with Coelho and Teixeira (2004), who observed the highest temperature fluctuations at around 12 p.m., and used these temperature fluctuations to explain the small oscillations observed in the curves describing the matric potential monitoring.
In the mean test for Ψ related to time, it was observed that the highest Ψ mean values were recorded at 12 p.m. in the soil covered by straw, and lowest results were recorded at 4 p.m. There was a 51.18% difference from 12 p.m. to 4 p.m., of 27.6% to 8 a.m. In the uncovered soil, the highest Ψ mean values were recorded at 12 p.m. and 4 p.m., in which there was a difference of up to 30.10%. When soils covered and uncovered by straw are analyzed, it is observed that there was a significant difference at 4 p.m., with the highest mean values in the covered system, with a 45.71% difference (Table 4).
Brito et al. (2014) have reported that potential gradient was also influenced by temperature, with a quite similar behavior
to that of the matric potential, with significantly high values in the period from 11 a.m. to 7 p.m., peaking at around 4 p.m..
Descriptive statistics for Ψ at different evaluation times and tensiometer depths, with covered and uncovered soils, showed that minimum, mean, median, maximum, standard deviation and Ψ variance (Table 5) values recorded in the uncovered soil were higher than those recorded in the covered soil. In addition, both the lowest mean values for all descriptive parameters as the Table 2. Summary of the analysis of variance for the different evaluated factors.
Variation sources Degrees of freedom Matric potential (Ψ)
Mean square Time (T) 2 507.5323** Depth (D) 2 147.2443** Cover (C) 1 911.5793** Interaction (T x D) 4 78.3951* Interaction (T x C) 2 467.1033** Interaction (D x C) 2 19.4777ns Interaction (T x D x C) 4 25.4649ns C.V. (%) 18.99
ns not significant; **; * Mean 1% and 5% significance, respectively, according to F test; CV - Coefficient of variation.
Table 3. Mean test for the Time x Depth factor.
Horary Depth (m) 0.15 0.30 0.45 Ψ (kPa) 8 a.m. 29.84 abA 23.29 bB 21.17 bB 12 p.m. 34.11 aA 30.12 aA 33.22 aA 4 p.m. 26.84 bA 28.07 abA 23.48 bA DMS 5.64 Standard Error 1.66
Means followed by the same lower case letter in columns and by capitals in lines do not differ according to Tukey test at 5% probability.
Table 4. Mean test for the Time x Cover factor.
Horary Straw cover
Covered Uncovered Ψ (kPa) 8 a.m. 24.12 bA 25.32 bA 12 p.m. 31.20 aA 33.65 aA 4 p.m. 18.35 cA 33.80 aB DMS 3.84 Standard Error 1.36
Means followed by the same lower case letter in columns and by capitals in lines do not differ according to Tukey test at 5% probability.
highest Ψ mean values were higher in the soil without straw cover.
In the soil water matric potential data descriptive analysis (Table 5), it was observed that the highest Ψ mean values (minimum, mean, median, maximum, standard deviation and variance) found in the covered soil occurred at 12 p.m. at a depth of 0.15 m. The lowest mean values (minimum, mean and median) occurred at 4 p.m. at a depth of 0.15 m (Table 5). The highest maximum mean values also occurred at 4 p.m. at a depth of 0.30 m, and at a depth of 0.45 m for standard deviation and variance (Table 5). For Coelho & Teixeira (2004), reading errors may result from diurnal temperature fluctuations and tend to be more evident as the matric potential decreases, i.e., the soil dries. The device response time tends to increase as the matric potential decreases. Melo Filho and Libardi (2005), while studying the temporal stability of soil water content and soil matric
potential, stressed the importance of using descriptive parameters of matric potential variability.
Asymmetry values had a higher distance from 0 in the uncovered soil, particularly at 4 p.m. and at a depth of 0.30 m, in which the highest Ψ values were found by tensiometers, although only this depth was classified with strong asymmetry (> 1.0). The remaining asymmetry values were classified as moderate (0.15 to 1.0), except for the covered soil at 8 a.m. and at depths of 0.30 and 0.45 m, 12 p.m. at depths of 0.15 and 0.30 m and 4 p.m. at depths of 0.15, 0.30 and 0.45 m, which were classified as asymmetric (<0.15) (Table 5). Kurtosis values that were more distant from 0 were observed in the covered soil, although being higher than 0.263 for both covered and uncovered soils and at all times and depths. Oliveira et al. (2014), while performing field monitoring of a dystrophic Red Latosol with similar characteristics to Table 5. Descriptive statistics for soil water tension.
Uncovered
Time 8 a.m. 12 p.m. 4 a.m.
Depth 0.15 0.30 0.45 0.15 0.30 0.45 0.15 0.30 0.45 m Min. 14.97 15.36 19.25 23.61 21.51 23.18 21.98 21.21 22.35 Mean 18.86 18.57 21.73 31.29 24.62 28.23 27.55 32.44 24.62 Median 18.87 19.11 21.39 29.92 24.28 27.08 25.02 25.16 23.80 Max. 21.85 20.45 23.79 41.66 28.73 37.70 39.41 46.14 28.95 SD 2.65 1.95 1.92 7.08 2.64 5.71 7.06 18.95 2.53 Variance 7.01 3.80 3.70 50.13 6.96 32.63 49.91 59.06 6.39 Assymetry -0.29 -0.68 -0.05 0.34 0.42 0.72 0.79 1.04 0.84 Kurtosis -1.71 -1.34 -2.02 -1.76 -1.43 -1.33 -1.29 -0.96 -1.14 Covered
Time 8 a.m. 12 p.m. 4 a.m.
Depth 0.15 0.30 0.45 0.15 0.30 0.45 0.15 0.30 0.45 m Min. 13.66 14.77 20.56 25.18 22.78 22.74 11.05 11.64 13.24 Mean 16.19 16.72 22.65 27.86 24.31 24.63 12.11 12.39 13.77 Median 16.78 16.24 22.86 27.78 24.22 25.06 12.06 12.37 13.83 Max. 17.44 18.81 24.76 30.21 25.86 25.69 13.06 13.05 14.47 SD 1.58 1.61 1.84 1.90 1.10 1.19 0.74 0.63 0.51 Variance 2.50 2.60 3.39 3.62 1.20 1.43 0.55 0.39 0.26 Assymetry -0.63 0.12 -0.04 -0.15 0.01 -0.59 -0.14 -0.03 0.18 Kurtosis -1.55 -1.94 -2.13 -1.72 -1.44 -1.57 -1.59 -2.12 -1.89
the soil used in this study, in an area of 0.7 ha, observed normal distribution and low spatial variability, and statistical parameters were unaffected by the presence of extreme values, reflecting in low heterogeneity.
For Campos et al. (2013), mean and median values that have a certain distance may indicate asymmetric data distribution. Assymetry and kurtosis coefficients are far from zero for all variables studied, characterizing asymmetrical distribution (Table 5). Zanão Junior et al. (2007) reported that assymetry and kurtosis values near 0 indicate normal frequency distribution. For Brito et al. (2014), soil surface temperature variations hinder soil water matric potential measurement, especially when two or more tensiometers are differently influenced by these variations. Thus, although inaccuracies have already been noted with puncture tensiometers (MORAES et al., 2006; BRITO et al. (2009; 2014) and FRANCO, 2015), soil water potential evaluation time should also be taken into account when working with this type of equipment.
CONCLUSIONS
Tensiometer evaluation time influenced soil water matric potential, and the highest soil water matric potential values were found in the uncovered soil.
In the 12 p.m. evaluation time, the highest soil water matric potential mean values were observed, for both covered and uncovered soils. In addition, there was a 51.18% difference for 8 a.m. in the uncovered soil and a 30.10% difference in the soil covered by straw.
Tensiometer installation depths influence soil water matric potential variation. The water soil matric potential values were observed at a depth of 0.15m.
The highest soil water matric potential variation was observed in the uncovered soil at a depth of 0.15 m, except for 4 p.m., in which the highest variation was observed
at the depth of 0.30 m. The variance tends to be higher at a depth of 0.15 m 12 p.m..
ACKNOWLEDGEMENT
The authors want to thank the Ministry of Science and Technology (MCT); the National Council for Scientific and Technological Development (CNPq); the Higher Education Personnel Improvement Coordination (CAPES) and the Goiás Research Support Foundation (FAPEG)
REFERENCES
ALMEIDA, A.S.; ARAÚJO, F.S.; SOUZA, G.S. Determinação da curva parcial de retenção de água de um Latossolo Vermelho por tensiomêtria. Scientia Plena, v.6, n.9, p.1-5, 2010.
BEZERRA, J.F.R.; GUERRA, A.J.T.; RODRIGUES, S.C. Relações entre potencial matricial no solo e cobertura vegetal em uma estação experimental, Uberlândia - MG. Soc. nat. v.24, n.1, p.103-114, 2012. BRAGA, M.B.; CALGARO, M. Uso da tensiometria no manejo da irrigação. Petrolina: Embrapa Semiárido, 30p.
BRITO, A.S.; LIBARDI, P.L.; MOTA, J.C.A.; MORAES, S.O. Desempenho do tensiômetro com diferentes sistemas de leitura. Revista Brasileira de Ciência do Solo, v.33, n.1, p.17-24, 2009.
BRITO, A.S.; LIBARDI, P.L.; MOTA, J.C.A.; KLEIN, V.A. Variação diurno-noturna do potencial mátrico e gradiente de potencial total da água no solo. Revista Brasileira de Ciência do Solo, v.38, p.128-134, 2014.
CAMPOS, M.C.C.; AQUINO, R.E.; OLIVEIRA, I.A.; BERGAMIM, A.C. Variabilidade espacial da resistência
mecânica do solo à penetração e umidade do solo em área cultivada com cana-de-açúcar na região de Humaitá, Amazonas, Brasil. Rev. Bras. Ciênc. Agrár. v.8, n.2, p.305-310, 2013.
CASTRO NETO, P. Notas de aula prática do curso de agrometeorologia. Lavras, ESAL, 45p, 1982.
COELHO, S.L.; TEIXEIRA, A.S. Avaliação do tensiômetro eletrônico no monitoramento do potencial matricial de água no solo. Engenharia Agrícola, v.24, n.3, p.536-545, 2004.
EMBRAPA - Empresa Brasileira de Pesquisa Agropecuária. Centro Nacional e Pesquisa em Solos. Sistema brasileiro de classificação de solos, Brasília. 353p, 2013. FERREIRA, D.F. Sisvar: a computer statistical analysis system. Ciência e Agrotecnologia (UFLA), v.35, n.6, p.1039-1042, 2011.
FRANCO, H.H.S. Abordagem metodológica envolvendo tensiometria e determinação da curva de retenção de água num solo de textura média. ESALQ-USP (Dissertação de mestrado em Engenharia Agrícola). 2015.
KLEIN, V.A. Uma proposta de irrigação automática controlado por tensiômetros. Revista Brasileira de Agrociência, v.7, n.3, p.231-234, 2001.
MARTINS, M.V. Influência da distância de instalação de tensiômetros no campo
para o cálculo do gradiente de potencial total no método do perfil instantâneo. ESALQ-USP (Dissertação de mestrado em Engenharia Agrícola). 2009.
MELO FILHO, J.F.; LIBARDI, P.L. Estabilidade temporal de medidas do teor e do potencial mátrico da água no solo em uma transeção. Revista Brasileira de Ciência do Solo, v.29, n.4, p.497-506, 2005.
MORAES, N.B.; MEDEIROS, J.F.; LEVIEN, S.L.A.; OLIVEIRA, M.A.S. Avaliação de cápsulas de cerâmica de instrumentos de medida de tensão usados em tensiômetros. Revista Brasileira de Engenharia Agrícola e Ambiental, Campina Grande 10:58-63, 2006.
OLIVEIRA, R.C.; CUNHA, F.N.; SILVA, N.F.; IORI, P.; TEIXEIRA, M.B.; COELHO, R.D. Spatial variation in soil moisture with subsurface drip irrigation in cane sugar. Afr. J. Agric. Res. v.44, n.9, p.3291-3299, 2014.
TURCO, J.E.P.; RIZZATTI, G.S.; PAVANI, L.C. Custo de energia elétrica em cultura do feijoeiro irrigado por pivô central, afetado pelo manejo da irrigação e sistemas de cultivo. Eng. Agríc. v.29, n.2, p.311-320, 2009.
ZANÃO JUNIOR, L.A.; LANA, R.M.Q.; GUIMARÃES, E.C. Variabilidade espacial do pH, teores de matéria orgânica e micronutrientes em profundidade de amostragem num Latossolo Vermelho sob semeadura direta. Ciência Rural, v.37, n.4, p.1000-1007, 2007.