Department of Information Science and Technology
Developing a Business Intelligence Initiative in Higher
Education
Marta Raquel Ferreira Pinheiro
A dissertation presented in partial fulfilment of the requirements for the degree of
Master in Computer Science and Management
Supervisor:
PhD, Elsa Alexandra Cabral da Rocha Cardoso, Assistant Professor
Department of Information Science and Technology, ISCTE – University Institute of Lisbon
In God we trust. All others must bring data.
W. Edwards Deming 1900-1993
In nowadays, Business Intelligence (BI) is one of the most important areas for managers and their organizations, whose investments on this type of projects are increasing. The decision-making process has become crucial to be more competitive, and higher education institutions (HEIs) are not an exception. For the last years, HEIs from all over the world have started to apply BI to their educational and decision-making challenges. In 2013, the BI Task Force from EUNIS (European University Information Systems) surveyed several HEIs to understand the maturity of their BI systems. The results revealed inconsistencies, raising the doubt about the comprehension of BI concepts. Considering this survey and its basis on maturity models, this dissertation analyses the existing models regarding higher education. Understanding the difficulties in answering the EUNIS survey from a perspective of two Portuguese universities is also a goal. It was created a feedback survey, whose results revealed it was a positive experience, although the lack of clarification of BI concepts was underlined.
Thinking about other universities starting their BI journey, it was developed a kit proposal that clarifies concepts and best practices for this sector. It was validated by the two universities mentioned above, which will be starting their initiative in January 2015. This validation was made through an interview, and the feedback was encouraging. Having a guidance to be methodical in this phase was highlighted, as well as the presentation of real success cases that allow to understand what other institutions do on their daily basis.
Keywords: Business Intelligence, Data Warehouse, Maturity Model, Higher Education, EUNIS
Atualmente, Business Intelligence (BI) é uma das mais importantes áreas para gestores e empresas, cujo investimento tem vindo a aumentar substancialmente. A tomada de decisão tem-se tornado fundamental para o aumento da competitividade e as instituições do ensino superior não são exceção. Nos últimos anos, instituições de todo o mundo têm começado a aplicar BI nos seus desafios. Em 2013, a BI Task Force da EUNIS (European University
Information Systems) decidiu realizar um inquérito a instituições de ensino superior para
conhecer a maturidade dos seus sistemas de BI. Os resultados revelaram incoerências, criando a dúvida sobre a correta compreensão dos conceitos. Tendo em conta este inquérito e a sua base em modelos de maturidade de BI, é realizada uma revisão bibliográfica dos modelos existentes direcionados para o ensino superior. Compreender as dificuldades em responder ao inquérito da EUNIS, na perspetiva de duas universidades, também é um objetivo deste estudo. Foi criado um questionário de feedback, cujos resultados revelaram ter sido uma experiência positiva, embora a falta de clarificação dos conceitos fosse sublinhada.
Considerando instituições a iniciar a sua aventura em BI, foi criado um guião que clarifica conceitos e boas práticas para o sector. Foi validado pelas universidades mencionadas, que vão começar as suas iniciativas no próximo ano. Essa validação, feita com entrevistas, revelou que um guião que ajude as universidades a serem metódicas nesta fase é essencial, bem como a apresentação de casos reais de sucesso que permitem dar a conhecer o que é feito no dia-a-dia do sector.
Palavras-Chave: Business Intelligence, Data Warehouse, Modelos de Maturidade, Ensino Superior, EUNIS
This journey of two years was intense, a mix of good and not so good feelings. I was supported by the most important people in my life, through all the moments and changes that I lived. At the end of this journey, I have so much to be thankful for, that words might not be enough. And because music was my constant partner during the days (and evenings) dedicated to this dissertation, and because Hans Christian Andersen once said that “When words fail, music speaks”, I decided to choose important lyrics from songs that have been on my MP3 player since the beginning of this adventure, to help me express my deepest gratitude.
You can be the greatest, you can be the best You can be the king kong banging on your chest You can beat the world, you can beat the war You could talk to God, go banging on His door
The Script – “Hall of Fame”
To my supervisor Elsa Cardoso, who made possible for me to find an exciting subject to this dissertation, keeping me inside the beauty of Business Intelligence. Someone who constantly challenged me along the way, and who always believed I could go further. I will always be thankful for this opportunity to team up with such a special person.
Still sometimes the rain can turn into a waterfall
And the prettiest things can come out of the coldest night And even with broken wings, sometimes you find your way to fly
Taio Cruz – “I Can Be”
To Eng. Joaquim Godinho, Professor Luís Rato, Professor Sá da Costa, and Dr. João Paulo Cavaco, my sincere thank you for sharing your precious time with the crucial interviews for this study. All the exchanged information truly enriched my work. Without your collaboration, none of this would be possible.
I’ll spread my wings and I’ll learn how to fly I’ll do anything until I touch the sky
I make a wish, take a chance, make a change and breakaway!
Kelly Clarkson – “Breakaway”
To all of my work colleagues and supervisors who supported me with their knowledge and professional experience, and who made possible to me to have the needed moments to write
Vivir, amar, sentir y saber que hoy puede que no salga el sol… Aunque llueva, tu y yo sabremos bailar
Nadie nos puede parar…
Ruth Lorenzo – “Dancing in the Rain”
To my parents, for the support, love and patience during these years, for taking up with the hours away from home, for the bad sleeping nights and all the bad moments of this journey. I am here today because you made it possible and you believed I could do it. And also my sisters and the rest of the family, for being there and always apologizing me for skipping so many important moments: thank you from my heart!
All I want from you is to see you tomorrow, and every tomorrow Maybe you’ll let me borrow your heart
And is it too much to ask for every Sunday?
And while we’re at it throw in every other day to start…
Justin Timberlake – “Not a Bad Thing”
To my fiancé, my best friend and biggest support, for guiding me through this journey with his unique way of upsetting me to go further and be better. Now that we have conquered this “mountain”, we can start the rest of our lives together.
I 1. INTRODUCTION ... 1 1.1.RESEARCH CONTEXT ... 1 1.1.1. Research Aim ... 4 1.1.2. Research Motivation ... 4 1.1.3. Research Contribution ... 4 1.1.4. Problem Statement ... 5 1.2.RESEARCH METHODOLOGY ... 5 1.3.RESEARCH STRUCTURE ... 5
2. STATE OF THE ART ... 7
2.1 BUSINESS INTELLIGENCE ... 7
2.2 BISYSTEMS ... 8
2.3 MATURITY MODELS ... 8
2.3.1 TDWI Maturity Model ... 10
2.3.2 The White Book BI Maturity Model ... 14
2.3.3 Business Intelligence Strategy and Roadmap - IBM ... 15
2.3.4 Comparative Analysis ... 16
2.4 BITASK FORCE @EUNIS ... 18
2.4.1 Critical Analysis to the Results of the 2013 EUNIS BI Maturity Survey ... 27
3. KIT PROPOSAL ... 29 3.1 ASSUMPTIONS ... 29 3.2 KEY DIMENSIONS ... 29 3.3 ARCHITECTURE ... 30 3.4 DEVELOPMENT ... 36 3.5 FUNDING ... 42 3.6 SCOPE ... 44 3.7 SPONSORSHIP ... 46 3.8 VALUE ... 49 3.9 DELIVERY ... 51 3.10 DATA ... 53 4. EVALUATION ... 57 4.1 INTERVIEW PROTOCOL ... 57
4.1 BACKGROUND OF THE INTERVIEWEES ... 59
II 5. CONCLUSIONS ... 69 5.1 CONTRIBUTIONS ... 69 5.2 LIMITATIONS ... 71 5.3 FUTURE WORK ... 71 REFERENCES ... 73 APPENDICES ... 79
A. EUNISBITASK FORCE –HEMATURITY MODEL SURVEY 2013 ... 79
B. FEEDBACK SURVEY ... 87
III
FIGURE 1-INSTITUTIONAL INTELLIGENCE (ADAPTED FROM KUSTER AND ROUSE,2009) ... 2
FIGURE 2-BISYSTEM KEY COMPONENTS (ADAPTED FROM OLSZAK AND ZIEMBA,2007) ... 8
FIGURE 3-TDWIMATURITY MODEL (TDWI,2012) ... 10
FIGURE 4-STRUCTURE OF ASSESSMENT SURVEY (ADAPTED FROM TDWI,2012) ... 13
FIGURE 5-SYNTHESIS OF THE CHARACTERISTICS OF THE TDWIBIMATURITY MODEL (TDWI,2012) ... 14
FIGURE 6-THE WHITE BOOK MATURITY MODEL LEVELS (ADAPTED FROM OCU,2013) ... 14
FIGURE 7-IBMINFORMATION MATURITY MODEL (ADAPTED FROM IBM,2007) ... 15
FIGURE 8-LEVELS OF PROFESSIONAL CAREER OF BITASK FORCE @EUNIS MEMBERS (ADAPTED FROM EUNIS, N.D.) ... 18
FIGURE 9-PARTICIPANT COUNTRIES IN THE BIMATURITY SURVEY, AND CORRESPONDING NUMBER OF ANSWERS ... 19
FIGURE 10-SURVEY ANALYSIS WITH AGGREGATED VIEW ... 21
FIGURE 11-SURVEY ANALYSIS OF GERMAN PARTICIPANTS ... 22
FIGURE 12-SURVEY ANALYSIS OF PORTUGUESE PARTICIPANTS ... 22
FIGURE 13-SURVEY ANALYSIS OF ITALIAN PARTICIPANTS ... 23
FIGURE 14-SURVEY ANALYSIS OF SPANISH PARTICIPANTS ... 23
FIGURE 15-SURVEY ANALYSIS OF SWEDISH PARTICIPANTS ... 24
FIGURE 16-SURVEY ANALYSIS OF FRENCH PARTICIPANTS ... 24
FIGURE 17-SURVEY ANALYSIS OF FINNISH PARTICIPANTS ... 25
FIGURE 18-SURVEY ANALYSIS OF IRISH PARTICIPANTS ... 26
FIGURE 19-SURVEY ANALYSIS OF ENGLISH PARTICIPANTS ... 26
FIGURE 20-CONCLUDING REMARKS ABOUT BITASK FORCE @EUNIS SURVEY (ADAPTED FROM CARDOSO,2014) ... 27
FIGURE 21-KIT PROPOSAL DIMENSIONS ... 30
FIGURE 22-DATA WAREHOUSE ARCHITECTURE (KIMBALL)– ADAPTED FROM ADAMSON (2010) ... 31
FIGURE 23-DATA WAREHOUSE ARCHITECTURE (INMON)– ADAPTED FROM ADAMSON (2010) ... 32
FIGURE 24-STAND-ALONE DATA MART - ADAPTED FROM ADAMSON (2010) ... 33
FIGURE 25-ARCHITECTURE FOR UNIVERSITY DATA WAREHOUSE (ADAPTED FROM BASSIL,2012) .... 35
FIGURE 26-ADAPTED FROM RECOMMENDED HIGH-LEVEL ARCHITECTURE FOR BISTRATEGY IN HIGHER EDUCATION (ADAPTED FROM IBM,2007) ... 35
FIGURE 27-UNIVERSITY OF MARYLAND BIARCHITECTURE (CATALANO,2014) ... 35
FIGURE 28-THE KIMBALL LIFECYCLE (KIMBALL ET AL.,2008) ... 38
FIGURE 29-BIAGILE METHODOLOGY BEST PRACTICES (ADAPTED FROM HUGHES,2008)... 39
IV
ROLDAN,2014) ... 41
FIGURE 33-THE DWCOMPETENCY CENTER OF UC-BERKELEY (ADAPTED FROM UC-BERKELEY, 2006) ... 44
FIGURE 34-GUIDELINES FOR BI/DWPROJECT SCOPE (ADAPTED FROM KIMBALL ET AL.,2008) ... 45
FIGURE 35-SCOPE DEFINITION OF UNIVERSITY OF UTAH BIPROJECT (UNIVERSITY OF UTAH, N.D.) . 46 FIGURE 36-SCOPE DEFINITION OF UNIVERSITY OF ARIZONA BIPROJECT (ADAPTED FROM UNIVERSITY OF ARIZONA,2009) ... 46
FIGURE 37-WHY STRONG BISPONSORS ARE CRITICALLY IMPORTANT?(ADAPTED FROM KIMBALL ET AL.,2008) ... 47
FIGURE 38-KEY ACTIVITIES IN THE MOBILISATION PHASE (ADAPTED FROM IBM,2007) ... 48
FIGURE 39-BIGOVERNANCE STRUCTURE IN UNIVERSITY OF TEXAS AT AUSTIN (FRIEDRICH,2013) . 49 FIGURE 40-UCBERKELEY BIAPPLICATIONS (ADAPTED FROM UC-BERKELEY,2006) ... 52
FIGURE 41-EXAMPLE OF BIDELIVERY IN UNIVERSITY OF MARYLAND (CATALANO 2014) ... 53
FIGURE 42-UNIVERSITY OF NOTRE DAME GOVERNANCE MODEL (ADAPTED FROM FREDA 2014) ... 54
FIGURE 43-UNIVERSITY OF NOTRE DAME'S DATA GOVERNANCE FRAMEWORK (CHAPPLE,2013) .... 55
FIGURE 44-UNIVERSITY OF ÉVORA EXPERIENCE RESULTS ... 62
FIGURE 45-ISCTE-UNIVERSITY INSTITUTE OF LISBON EXPERIENCE RESULTS ... 63
FIGURE 46-DRIVERS OF THE IMPLEMENTATION OF THE BI/DWSYSTEM ... 64
FIGURE 47-KIT APPLICATION TO UNIVERSITY OF ÉVORA ... 65
FIGURE 48-KIT APPLICATION TO ISCTE-UNIVERSITY INSTITUTE OF LISBON... 67
FIGURE 49-INTERVIEW PRESENTATION:SLIDE 1 ... 91
FIGURE 50-INTERVIEW PRESENTATION:SLIDE 2 ... 91
FIGURE 51-INTERVIEW PRESENTATION:SLIDE 3 ... 92
FIGURE 52-INTERVIEW PRESENTATION:SLIDE 4 ... 92
FIGURE 53-INTERVIEW PRESENTATION:SLIDE 5 ... 93
FIGURE 54-INTERVIEW PRESENTATION:SLIDE 6 ... 93
FIGURE 55-INTERVIEW PRESENTATION:SLIDE 7 ... 94
FIGURE 56-INTERVIEW PRESENTATION:SLIDE 8 ... 94
FIGURE 57-INTERVIEW PRESENTATION:SLIDE 9 ... 95
FIGURE 58-INTERVIEW PRESENTATION:SLIDE 10 ... 95
FIGURE 59-INTERVIEW PRESENTATION:SLIDE 11 ... 96
FIGURE 60-INTERVIEW PRESENTATION:SLIDE 12 ... 96
FIGURE 61-INTERVIEW PRESENTATION:SLIDE 13 ... 97
FIGURE 62-INTERVIEW PRESENTATION:SLIDE 14 ... 97
FIGURE 63-INTERVIEW PRESENTATION:SLIDE 15 ... 98
FIGURE 64-INTERVIEW PRESENTATION:SLIDE 16 ... 98
V
FIGURE 69-INTERVIEW PRESENTATION:SLIDE 21 ... 101
FIGURE 70-INTERVIEW PRESENTATION:SLIDE 22 ... 101
FIGURE 71-INTERVIEW PRESENTATION:SLIDE 23 ... 102
FIGURE 72-INTERVIEW PRESENTATION:SLIDE 24 ... 102
VI
TABLE 1.BIDEFINITIONS ... 7
TABLE 2.BIMATURITY MODELS ... 9
TABLE 3.OVERALL SCORE FROM TDWIASSESSMENT ... 13
TABLE 4.COMPARATIVE ANALYSIS OF BIMATURITY MODELS ... 17
TABLE 5.ASSESSMENT OF THE BIMATURITY MODELS ... 18
TABLE 6.PROFILE OF BIMATURITY SURVEY PARTICIPANTS ... 20
TABLE 7.DEVELOPMENT OF KIT PROPOSAL DIMENSIONS ... 29
TABLE 8.COMPARING KIMBALL AND INMON ARCHITECTURES (ADAPTED FROM BRESLIN,2004, AND ADAMSON,2010) ... 32
TABLE 9.COMPARISON OF BIARCHITECTURES ... 34
TABLE 10.AGILE METHODOLOGY -PROS &CONS (ADAPTED FROM BECKERMANN AND AGOSTINO, 2014) ... 42
TABLE 11.OBTAINED OUTCOMES FROM BI IN UNIVERSITY OF MANCHESTER (ADAPTED FROM JISC, 2012) ... 51
TABLE 12.CATEGORIZATION OF DATA PRODUCTS (ADAPTED FROM OCU,2013) ... 51
TABLE 13.IMPORTANT DATA MANAGEMENT ASPECTS (ADAPTED FROM OCU,2013) ... 54
TABLE 14.UNIVERSITY OF NOTRE DAME INSTITUTIONAL LANGUAGE ... 56
TABLE 15.INTERVIEWEES'BACKGROUND:UNIVERSITY OF ÉVORA ... 59
VII Acronym Description
BI Business Intelligence
CIF Corporate Information Factory
DB Database
EDW Enterprise Data Warehouse
ER Entity-Relationship
ETL Extraction, Transformation and Loading EUNIS European University Information Systems
HE Higher Education
HEI Higher Education Institution
IS Information Systems
ISCTE-IUL ISCTE-University Institute of Lisbon
IT Information Technology
ITSM Information Technology Service Management JISC Joint Information Systems Committee
1
CHAPTER 1
1.
Introduction
The current chapter provides an overview of the context and motivation behind this research, as Introductionwell as the adopted research method and approach. Furthermore, it outlines the structure of this dissertation.
1.1. Research Context
Business Intelligence (BI) can play an important role in transforming data from heterogeneous sources into an integrated view for supporting organisational, decision-making, management and strategic planning. Devised by the Gartner Group in 1990s, the term BI is about “a variety of information technology (IT)-based tools and approaches for helping organisations to make better use of the increasingly vast amounts of data accumulated from both internal and external sources” (Isik et al., 2011). It can encompass applications such as data warehouses, data mining, data marts and Online Analytical Processing (OLAP).
The main purpose of BI is to allow interactive and easy access to data, enable manipulation and transformation of it, and provide business managers and analysts the ability to conduct appropriate analysis and perform actions (Turban et al., 2008).
The education sector, like all other types of organizations, need to have accurate, understandable and accessible information, in order to develop its strategy and planning BI is the answer to this kind of issues, and has the capability of allowing colleges or universities to be competitive, more adaptable to changes, and capable of planning the future and optimizing resources (JISC, n.d.). Higher Education institutions (HEIs) collect a large volume of data, however there are not individuals who know what to do to manage and consume that information (Kelly 2005). According to JISC (n.d.), they collect data on how their students interact with their standard business systems like library, finance, among others, and improving their BI capabilities will help position them to take the best out of their services. In addition, the pressure from social and economic changes – like public accountability required, funding constraints and reductions, compliance requirements for accreditation systems and intense international competition for students - prioritize student acquisition, engagement and retention more critical than ever. Kuh (2001) and Trowler (2010) believe that the success and development of university students has less to do with what they contribute or where they study, but more with what they do during their years as students. Consequently, student engagement is viewed as an important antecedent to student learning and achievement, as well as to institutional success. According to Coates (2010), student engagement is valuable for managers
2 because by monitoring student commitment, institutions can identify areas of good practice and areas that need improvement.
For the past years, HEIs have been under pressure to provide management information, not only for their own boards, but also to share with regulatory entities, accreditation bodies, and government agencies. All institutions want to measure and evaluate their own effectiveness, especially the public institutions which are dependent from the state aid and must show results. Gaining insights about academic performance, student success, persistence, and retention are increasing the demand for information (Goldstein, 2005). HEIs have become extremely competitive and their main goal is to attract students and funding for their governance and research. According to James (2013), HEIs should be able to answer critical questions like which programmes are popular, from which locations and demographics are students coming or are the marketing strategies aligned with feedback from students. Because of this need, the concept of BI is progressively rising up the priority list within various HEIs (JISC, 2013). Foster (2011) emphasizes that an objective study of data on students can produce highly relevant results to educational policy.
Universities are already using BI to analyse class failure patterns, to identify at-risk students and direct them to appropriate support services (Durso, 2009); and to predict student’s dropout (Dekker et al., 2009). An increasing number of institutions have understood the benefits of using BI, in particular to optimize their decision-making process and to strengthen the management of their areas and departments. Analysing the Gartner survey from 2013 – Top 10 CIO Technology
Priorities – there were 75 Higher Education CIOs who responded to it and reported that their
one technology-related priority was to “attract and retain new customers”.
A BI solution in this sector can also be referred as an Institutional Intelligence (II) initiative. This concept is about the academic analytics that appear on standard transactional reports, metrics, charts, and projections (Figure 1).
Figure 1 - Institutional Intelligence (adapted from Kuster and Rouse, 2009)
Institutional Research is “a set of activities that support institutional planning, policy development, and decision making” (Royal University of Phnom Penh, 2011). It refers to the collected data about an institution, its analysis and transformation intro information, and the interpretation made to that information. It is based on three categories: (1) Technical/Analytic Intelligence, (2) Issues Intelligence, and (3) Contextual Intelligence. The first tier encompasses the factual information and methods that provide the basis to define, count and measure data.
Institutional
Research
(IR)
Business
Intelligence
(BI)
Institutional
Intelligence
(II)
3 The second one is about the generated knowledge about crucial issues like budgeting or evaluations, which is based on the information from the first category. The third tier represents the knowledge of higher education in general and of the particular institution in question (Penn State University, n.d.). Combining these activities with BI capabilities creates the capacity to carry out analysis on questions of strategic importance under continuously changing conditions (TDWI, 2007). In order to develop an effective II initiative, it is necessary to have institutional research analysts, financial analysts, and IT report writers paired up as a team. Ideally, they manage the processes of data storage and update, to provide a unified view from multiple source systems – “one source of the truth” (Kuster and Rouse, 2009).
Nevertheless, currently it is not known the state of art of the utilization of these systems in Higher Education. According to TDWI (2007), a large number of universities do not embrace BI concepts, due to scope barriers and the complexity of the initiative to make possible to manage so many different needs. There was a great need to conduct a study to comprehend at what level of maturity they are. In order to answer this question, a survey was led in the context of an international project done by the Business Intelligence Task Force (BI Task Force) of EUNIS – the European University Information Systems organization. This organization aims to improve the cooperation and exchange of good practices between BI practitioners in Higher Education all over Europe. The BI Task Force wanted to collect a big picture of BI systems in institutions, so it decided to start a project in order to make an initial assessment of the maturity of BI systems in European HEIs, including Portugal. A survey was created and it was active during 2013. The initial results were presented at the Terena Networking Conference 2014, in Dublin (Ireland). Across the different countries (including Portugal), there seems to be a lack of understanding about the used concepts, and consequently the conditions required to develop a successful BI solution might be insufficient. A BI program is a challenging effort that requires a strong level of commitment from the executive management, continuous funding, and other critical success factors that need to be in place in the organization. Clarifying the subjacent concepts is crucial to start a successful BI journey.
The present dissertation focuses on the design of a kit to help institutions in the beginning of its BI journey. This kit proposal is divided into eight key dimensions, having in consideration the TDWI Maturity Model (TDWI, 2012): Scope, Sponsorship, Funding, Value, Architecture, Data, Development and Delivery. For each dimension, several authors were analysed, in order to gain different perspectives from the same subject. It is important to refer that this kit is merely a suggestion for the higher education sector, specifically adapted to the reality of these institutions. In order to validate this kit proposal, there were made two interviews to two public Portuguese universities, where it was collected important feedback to enrich the kit and make it more suitable for the needs of the sector. Taking the advantage of those interviews, it was also made a feedback survey about the 2013 EUNIS BI Maturity survey, in order to understand which problems these Portuguese HEIs struggled with.
4
1.1.1. Research Aim
This dissertation intends to study the best practices available that can be used by higher education institutions to trigger a more effective and informative starting of a BI initiative. This strategy encompasses several key aspects regarding BI systems: BI Maturity Models, higher education roadmaps, success cases and higher education specialized opinions like JISC from United Kingdom. This broad purpose can be divided into more specific goals:
The analysis of the 2013 EUNIS survey results;
The proposal of a kit to higher education institutions, in order to start their BI initiatives. Two public Portuguese universities, which are just starting their BI initiative, will be considered to evaluate the experience of answering to the EUNIS survey, and the usefulness of the kit proposal.
1.1.2. Research Motivation
This research was motivated by a problem that was evidenced by the 2013 EUNIS BI Maturity Survey: the answers from the higher education stakeholders revealed a misunderstanding of concepts, which led to unfaithful results. This dissertation wanted to understand the major problems with this kind of institutions, because it is wrong to compare the HEI systems with the ones used in commercial organizations - their maturities are at different levels. Taking in consideration the existing maturity models, it is crucial to understand how each one works and if they produce comparable results, due to the characteristics of HE sector.
Other motivation of this research was the development of a guiding tool to institutions that are in the beginning of their BI journey, creating a clean path for them to follow considering their characteristics. One important factor that this dissertation wanted to keep in consideration throughout this development was the budget limitations, and consequently the restrictions to consultants and to the development of major IT projects that HEIs experience. Developing a kit proposal (what this study called to the roadmap) that was realistic and adapted to the reality of HEIs worked as a top motivation.
1.1.3. Research Contribution
One contribution of this research is a kit proposal made for higher education institutions, regarding their BI systems. For those institutions that are starting their first BI initiative, this kit acts as guidance to the success of the implementation, highlighting important aspects that need to be in place for the success of their journey. It also clarifies key BI concepts and gathers success cases that will help HEI stakeholders to perform a correct evaluation of their BI systems, using the TDWI Maturity Model and The White Book Maturity Model questions.
Another important contribution is about the suggestions to improve the next edition of the EUNIS BI Maturity Survey, to be launched in the beginning of next year. It was identified the
5 need of having the used BI concepts clearly defined in the survey; nevertheless, there might be other important improvements that will lead to more accurate results.
1.1.4. Problem Statement
In order to help the Higher Education institutions in the beginning of their BI initiative, this study is focused on finding the best approach to start a BI initiative in a Higher Education institution. Consequently, the problem statement for this dissertation is:
To institutions that have not started their BI initiative yet, what are the best practices to succeed?
Since the 2013 EUNIS BI Maturity Survey is the basis of this dissertation, there is another problem statement that will be answered in the end of this study, with the collaboration of the interviewed Portuguese universities, which is:
How can EUNIS improve the next edition of its BI Maturity Survey, in order to return more accurate results?
1.2. Research Methodology
This dissertation is considered to be a case study. This methodology was used to gather results with the practical application of the feedback survey about 2013 EUNIS BI Maturity Survey, and also of the kit proposal developed in this dissertation, in order to understand the studied theory when applied to the HEIs. A quantitative investigation was embraced regarding the feedback survey, while it was adopted a qualitative investigation to describe the dimensions used in the developed kit. The starting point to reach the research aim is the state of the art, and its critical analysis. The case study encompasses information collection with interviews and surveys, observation, documentation, feedback, and the elaboration of a final narrative (Patton, 2001). To conclude this study, it is created a critical analysis about the results gathered from the interviewed universities.
1.3. Research Structure
This dissertation is divided in five chapters. In the first chapter, there is an overview of the chosen subject and the motivation to study it deeply. It is also described the contributions and the identified problem statement.
Chapter two presents the state of the art, describing the key concepts regarding the subject. Three maturity models related to the HE sector are explained, being also comparatively analysed, in order to understand the main differences and similarities. This chapter also describes the BI Task Force from EUNIS and its developed work.
In chapter three, there is the kit proposal developed for the HEIs that are in the beginning of their BI initiatives, being clarified all the used dimensions with definitions and success cases.
6 Chapter four describe the interviews performed to the Portuguese universities (University of Évora, and ISCTE-University Institute of Lisbon).
The last chapter presents the conclusions, limitations and future work resulting from the state of the art, the developed kit, and the interviews.
7
CHAPTER 2
2.
State of the Art
2.1 Business Intelligence
Ponelis and Blitz (2001) found that BI has become a great interest for Information Systems, implying systems composed of people, information and processes that improve the effectiveness and efficiency of organizations. However, what is the real definition of Business Intelligence? There are several academic and practitioner proposals. For example, Ralph Kimball says BI is about the initiative from business users, rather than the technology (Kimball et al., 2008). Another example comes from Gartner, an important IT research and advisory company that defends it is a broad term that includes applications, infrastructure, tools and best practices which allow information access and analysis, in order to improve the decision making process and productivity (Gartner, 2010). Table 1 presents some BI definitions, displayed chronologically, with contributions from renowned authors and BI vendors.
Table 1. BI Definitions
Definition
Authors
Eckerson, 2003
“Historical information presented to users for analysis to enable effective decision making and for management support”
Moss and Atre, 2003; Alter, 2004
“Holistic and sophisticated approach to cross-organizational decision support”
Watson et al., 2006 “Term comprised of both technical and organizational elements”
Rud, 2009
“Term that encompasses all needed capabilities to transform data in information, and that encourages organizations to achieve the goal of making available the right information to the right people, in the right moment and through the right way”
Raber et al., 2012 “Strategical capacity of organizations to create, collect, analyse and use information and knowledge”
BI Vendors
Microsoft, 2007
“BI simplifies information discovery and analysis, making it possible for decision-makers at all levels of an organization to more easily access, understand, analyse, collaborate and act on information, anytime and anywhere”
Microstrategy, n.d.
“Set of software systems and practices that enable organizations to analyse data, and make better decisions based on the insight from that information”
SAS, n.d. “The right information supplier, when and where is needed, in order to improve productivity and decision-making process”
8 Authors tend to emphasize the importance of BI in the organizations strategy; BI vendors highlight technical aspects of this kind of systems. The term can mean different things to different people, but everyone understands its goals equally. The goals are: (1) allow improved access to data; (2) allow data manipulation; and (3) give to managers and business analysts the ability of performing important analysis. This dissertation will always have in consideration both perspectives, however, there will be a more restricted scope whenever is necessary, in order to better fit the subject.
2.2 BI Systems
A BI system can be defined as “an integrated set of tools, technologies and programmed products that are used to collect, integrate, analyze and make data available” (Reinschmidt and Francoise, 2000). Another definition is presented by Negash and Gray (2003) as a system that “combines data gathering, data storage and knowledge management with analytical tools to present complex and competitive information to planners and decision makers”.
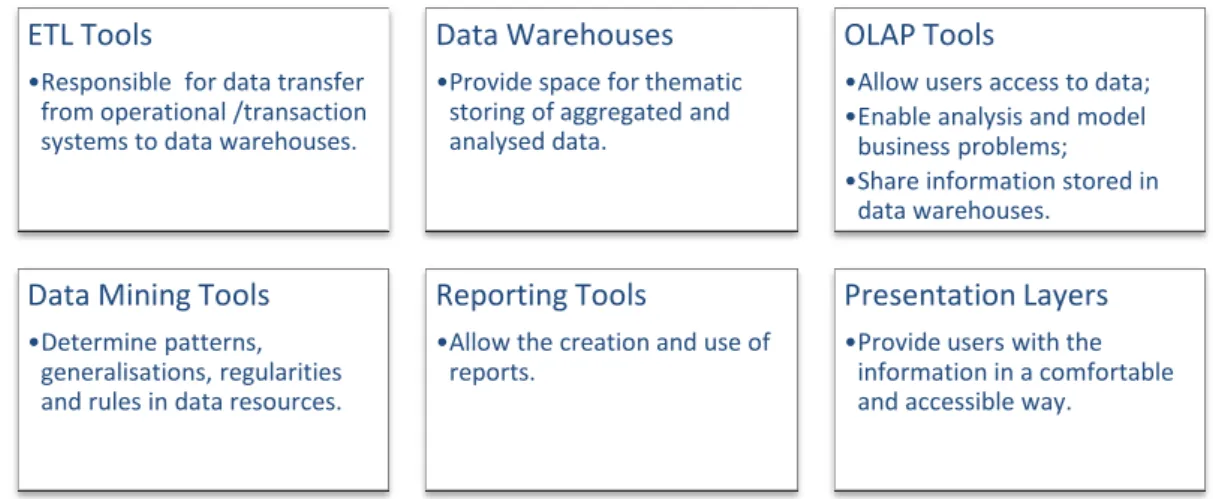
Regarding its structure, Fisher et al. (2011) define three complementary data management technologies: data warehousing, online analytical processing (OLAP) and knowledge discovery – predominantly aided by data mining techniques. Olszak and Ziemba (2007) complete this information with the components presented in Figure 2.
Figure 2 - BI System Key Components (adapted from Olszak and Ziemba, 2007)
2.3 Maturity Models
Understanding a BI system is easier with the help of Maturity Models. These models are used to describe, explain and evaluate the lifecycle of the growth of the system. One of their great benefits is the capability of explaining the right path to the organization, in order to help improving its technology alignment with business processes.
The main idea inherent to all maturity models is that they enable organizations to assess their BI systems, in order to identify and explore their BI strengthens and weaknesses (Lahrmann et
ETL Tools
•Responsible for data transfer from operational /transaction systems to data warehouses.
Data Warehouses
•Provide space for thematic storing of aggregated and analysed data.
OLAP Tools
•Allow users access to data; •Enable analysis and model
business problems; •Share information stored in
data warehouses.
Data Mining Tools
•Determine patterns, generalisations, regularities and rules in data resources.
Reporting Tools
•Allow the creation and use of reports.
Presentation Layers
•Provide users with the information in a comfortable and accessible way.
9 al., 2011). Besides, they also allow establishing an evolutive path and helping them with recommendations, so they can be more aligned with their own business and technology (HP, 2009).
Maturity models have their own evaluation method: through a specialist or a self-assessment exercise. They also offer their own procedures and processes according to best practices (Gartner, 2010).
There are maturity models focused on software development, knowledge management, performance management and data management. They are broad enough to be used for BI, but there are a few developed models for this domain – as we will be able to see further. This kind of models aid organizations to understand where they are at the moment and how they can improve. Besides, there are a number of questions which can be better understood, as “where in the organization is most of the reporting and business analysis done today?” or “what business value does BI bring?”. Table 2 shows some of the existing BI Maturity Models.
Table 2. BI Maturity Models
BI Maturity Model Reference
AMR Hagerty, 2006
Claraview BI Maturity Assessment Teradata, 2009
Gartner Gartner, 2010
HP HP, 2009
Microsoft’s BI Maturity Model Microsoft, 2008
Capability Maturity Model for BI Raber et al., 2012
SAS Information Evolution Model SAS, 2007
Data Warehousing Process Maturity Model Sen et al., 2006 The Data Warehouse Institute (TDWI) TDWI, 2012 Data Warehousing Stages of Growth Watson et al., 2001 Business Information Maturity Model Williams and Williams, 2007
There are other developed BI Maturity Models, but their credibility needs to be improved. Some sources are unavailable and/or incomplete, others were only developed in academic studies. Those maturity models are:
BIDM – Business Intelligence Development Model (Sacu and Spruit, 2010);
EBIMM – Enterprise Business Intelligence Maturity Model (Chuah, 2010);
10
SOBIMM – Service-Oriented Business Intelligence Maturity Model (Shaaban et al., 2011);
LOBI – Ladder of Business Intelligence (Cates et al., 2005);
SMC – Steria Mummert Consulting (Lahrmann et al., 2010).
Regarding this dissertation, and because the higher education sector is the main focus, it is important to refer another BI maturity model created especially for the sector: (1) The White Book Maturity Model, developed by Oficina de Cooperación Universitaria (OCU).
Until today, these are the BI maturity models concerning higher education, so that is why these models will be further explained. Still, this does not mean that general BI maturity models cannot be applied to the sector; from Table 2, we will be working with the TDWI model.
With a different perspective, there is the BI Strategy and Roadmap from IBM. This document is specific to the higher education sector and the presented strategy is based on the IBM Maturity Model. Thus, it will also be explored furthermore.
2.3.1 TDWI Maturity Model
The maturity model proposed by The Data Warehousing Institute (TDWI) was initially developed by Wayne Eckerson. TDWI is an institute whose mission is to promote the education and research in Business Intelligence area, and data warehousing. Initially built in 2004, it was improved in 2007. This maturity model was developed to respond to several professionals and executives that wanted to know how to evaluate their BI systems in comparison to their competitors. It presents, nowadays, five levels of maturity, as we can see on the figure below, equivalent to the phases of the growth of man.
Figure 3 - TDWI Maturity Model (TDWI, 2012)
This maturity model is focused, mainly, on the technical aspect for the maturity assessment (Rajteric, 2010). Maturity is evaluated through eight key areas: Scope, Sponsorship, Funding,
11 Value, Architecture, Data, Development and Delivery. The evaluation method is a questionnaire that presents, in the final, an indicator of the maturity level. Each of these areas is graded as we can see in the Figure 3. There are five maturity levels:
The first grading level, the Nonexistent stage, comprises two phases. The first phase persists until the creation of a data warehouse; the second phase is where the organization faces several partial data sources – also known as Spreadmarts. The first half of this stage represents an organization that relies entirely on operational reports for information. These reports are, generally, static and inflexible, showing a limited range of data (TDWI, 2012). In the second half of this phase, due to the lack of reports flexibility, users create their own reporting tools, typically one for each data source. To those reports TDWI calls spreadmarts and they comprises a particular set of data, metrics and rules with no correlation (or small) among them, between operational reports or between analytical systems (Rajteric, 2010).
After the first grading level, there is the Gulf Phase, where is faced the first obstacle. As a result of lowly planning, insufficient data quality, cultural resistance, poor scope definition and over usage of spreadmarts, the organization struggles for reaching the next level (TDWI, 2012). Eckerson (2007) defends that the organization has to launch a few challenges to overcome it: contest the perception their executives have of BI as a strategic resource, adequate the financial support to the BI initiatives, improve data quality and perform a cultural change on how data is accessed, how it is analysed and how decisions are made. It represents a phase that all organizations can cross without major problems.
At the second grading level, the Preliminary stage, there are departmental initiatives along with a few alignment attempts with other initiatives at the organization level. It also represents the phase in which new BI tools are implemented, allowing the use of new capabilities. This improvement will make the process of decision making and business understanding more accurate (Eckerson, 2007).
The third grading level, the Repeatable stage, represents the continuation of the work begun at the previous level, in a more comprehensive and integrated way. The organization recognizes the value of consolidating regional data warehouses into a centralized one. The major change at this level is the increased utilization of BI systems, because there are a wider number of users. The organization recognizes the value of fast data availability and creates a number of reports/dashboards for different groups of users (Eckerson, 2007).
The second obstacle happens at the Chasm Phase. This obstacle is deeper than the first one, and some organizations that struggle in this point do not get out of it. The challenges at this point might be related to business volatility, when the organization acquires or merges with another company, hire a new CEO/CIO, change its strategy, or restructures itself (and some things must go back to the start); or to semantics
12 standardization, when integrating different terms, definitions, and rules from several data marts/data warehouses is not a peaceful process; or even to a high report number, when the organization enables its users to creating their reports and there is not a defined limit for it. In order to overcome this battle, it is usually built an Enterprise Data Warehouse and it is an initiative that frequently comes from management. The aim is to unite independent regional data warehouses to accomplish a more reliable view on dispersed business information on all aspects of the organization (Rajteric, 2010). At the fourth grading level, the Managed stage, Eckerson (2009) reveals that the BI/DW
teams overcome the Chasm Phase and obtain a tool that enables the organization to achieve its goals. The main characteristics of this level are the centralized management of BI data sources, a common architecture for the data warehouse, predictive and rapid dataanalysis, and centralized performance management (Rajteric, 2010).
The last grading level, the Optimized stage, is the moment where BI is seen as a completely intrinsic service in processes, applications and strategies at the organization. This phase is about using BI to deliver interactive reports, dashboards and other information services. The use of enterprise portals is a generalized procedure and the organization works with complex applications that incorporate data through techniques such as rules, notifications, alerts, predictive models, in order to monitor processes in real-time (Eckerson, 2007).
Eckerson says that this maturity model should not be seen as a final evaluation of the BI systems, because it cannot evaluate the program with the necessary depth. For the best results, it should be complemented with an independent consultant study, in order to identify and evaluate, sporadically, the strengths and weaknesses of the BI systems.
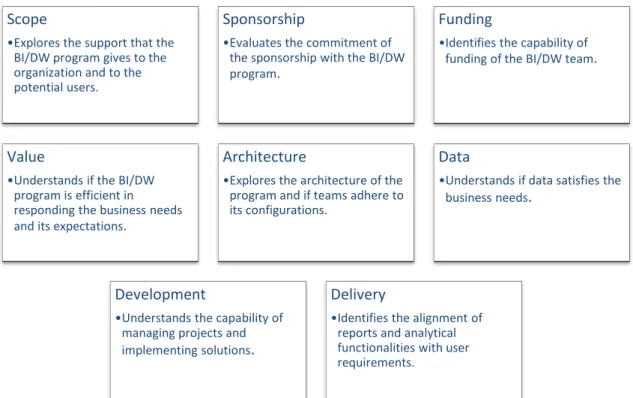
Concerning the assessment, there is an online survey available, with forty questions. Each of them has five possible answers and all the questions are grouped in eight categories. This structure is explained on Figure 4.
13 Figure 4 - Structure of Assessment Survey (adapted from TDWI, 2012)
It is given a weight to each answer, from 1 to 5, whose value corresponds to the maturity level. The value 1 matches to the level “Preliminary” and the value 5 matches to “Optimized” level. The sum of the values from the various answers originates a global result and a result by category. Table 3 presents the overall score and demonstrates the possible results and the equivalent maturity levels.
Table 3. Overall Score from TDWI Assessment OVERALL SCORE SCORE STAGE 5 to 7 Nonexistent 6 to 9 The Gulf 8 to 12 Preliminary 13 to 17 Repeatable 15 to 19 The Chasm 18 to 22 Managed 23 to 25 Optimized
Scope
•Explores the support that the BI/DW program gives to the organization and to the potential users.
Sponsorship
•Evaluates the commitment of the sponsorship with the BI/DW program.
Funding
•Identifies the capability of funding of the BI/DW team.
Value
•Understands if the BI/DW program is efficient in responding the business needs and its expectations.
Architecture
•Explores the architecture of the program and if teams adhere to its configurations.
Data
•Understands if data satisfies the business needs
.
Development
•Understands the capability of managing projects and implementing solutions
.
Delivery
•Identifies the alignment of reports and analytical functionalities with user requirements.
14 It is important to refer that this scale may or may not include the stages “The Gulf” and “The Chasm”.
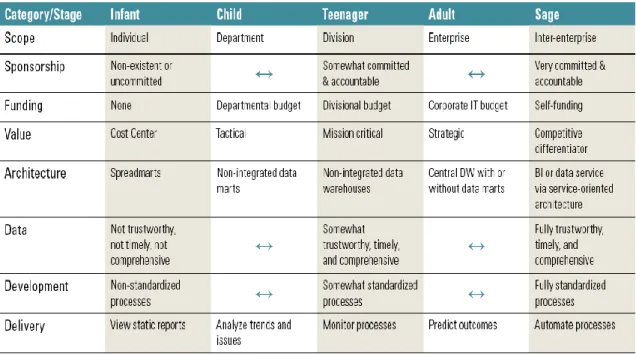
Figure 5 presents a synthesis of the characteristics of each maturity level related to each category.
Figure 5 - Synthesis of the Characteristics of the TDWI BI Maturity Model (TDWI, 2012)
The BI Task Force @ EUNIS (see section 2.4) created an assessment survey based on this maturity model. All the questions were adapted to the higher education sector, especially in terms of vocabulary. The calculations for the overall score and the maturity levels were maintained as the original.
2.3.2 The White Book BI Maturity Model
The Spanish Oficina de Cooperación Universitaria (OCU) developed a BI maturity model for Higher Education institutions with the help from JISC InfoNet. – this collaboration resulted in the White Book Maturity Model. This maturity model is based on the experience of the contributors and was conceived as a specific tool for the Higher Education sector (OCU, 2013).
Figure 6 - The White Book Maturity Model Levels (adapted from OCU, 2013)
Absent
Level 1
Initial
Level 2
Expanding
Level 3
Consolidated
Level 4
Institutionalized
Level 5
15 As displayed in Figure 6, there are five maturity levels:
The first level, Absent, represents institutions with no dedicated initiatives, or they are in such an early state that it cannot be perceived. Data usage is, in general, limited to operational contexts;
At the second level, Initial, the institution starts to realize data and its importance. In a small scale, there might be a few local success stories regarding data analysis;
In the third level, Expanding, the potential of data to empower the institution is clearly perceived. There is a strong wish to translate the success of the local success stories to a wider scale. There is the first global effort to put in place and gradually incorporate and/or substitute the previous local initiatives;
At the fourth level, Consolidated, the institution has its intelligence clearly established as a permanent and wide program, originating an effective internal service. Also, there are data products targeted to different user groups and covering different functional areas; The last level, Institutionalized, covers an institution where institutional intelligence
forms an integral part of its culture. Everyone uses effectively the data tools and they cover all key functional areas.
Regarding the assessment, there is not enough information about the used tools or criteria.
2.3.3 Business Intelligence Strategy and Roadmap - IBM
In 2007, IBM was chosen to help define a BI strategy for An Chéim1 and the Institutes of Technology (IoT)2 in Ireland. There was a crescent need in meeting the external needs of Higher Education concerning accountability and in supporting the growing internal requirement for more targeted information and analytics. In order to better define this BI strategy, the IBM Information Maturity Model was used, which is a maturity model that can be used in several industries – higher education is not an exception (IBM, 2007).
Figure 7 - IBM Information Maturity Model (adapted from IBM, 2007)
According to the Figure 7, there are five maturity levels on this maturity model used to develop the Business Intelligence Strategy and Roadmap by IBM.
1
An Chéim Computer Services is a specialist shared services organization, which operates in the public and higher education sectors in Ireland. This organization implements, maintain and support business-critical and regulatory systems.
2
Institutes of Technology represent 13 Irish university-level institutes that operate a unique system where they allow students to progress from Degree programs to Masters and PhD. These institutes are focused on teaching/learning, purpose-driven research, and public service.
1. Data to Run the Business 2. Information to Manage the Business 3. Information as a Strategic Asset 4. Information to Enable Innovation 5. Information as a Competitive Differentiator
16 The first level, Data to Run the Business, have basic reporting and the utilization of spreadsheets is global. It is hard to get the “single version of the truth”, because solutions are non-integrated and the applications are stand-alone modules.
The second level, Information to Manage the Business, have basic search and querying. Working environments are disparate and there is a limited enterprise visibility, originating multiple versions of the truth.
The third level, Information as a Strategic Asset, see a single version of truth. There is an integrated business performance management and an effort to present real-time information.
The fourth level, Information to Enable Innovation, have their capabilities within workflow, processes and systems fully embedded. They already use predictive analysis and there are improved business processes and operations management. Data is seamless and shared.
The fifth level, Information as a Competitive Differentiator, are optimizing the strategic business innovation. Business performance and operations are enhanced and all relevant information is unified and public.
Regarding the assessment, there is not enough information about the used tools or criteria.
2.3.4 Comparative Analysis
This section presents a comparative analysis of the previous BI maturity models. Using Lahrmann et al. (2011) as a reference, the compared properties are: maturity concept, dimensions, maturity levels, and assessment. Maturity Concept represents the understanding of maturity, and it can be seen from three different angles: people, processes and technology. Dimensions express specific areas of capability, process or objects structuring the field of interest. Maturity Levels define the maturity state of a certain dimension, with a designation and a detailed description. Assessment is the evaluation made that can be qualitative or quantitative. The authors also indicate a characteristic called Maturity Principle. The Maturity Principle can have two values: continuous or staged. Continuous maturity models allow a scoring of different activities in different levels. Staged maturity models demand the accomplishment of all requisites of each level. This characteristic was not relevant to include in this comparison, because all of analyzed maturity models are staged models: all of them represent maturity in levels, and each level has its own goals that are applied to all evaluated organizations.
17 Table 4. Comparative Analysis of BI Maturity Models
Maturity Model
Maturity
Concept Dimensions Maturity Levels Assessment
TDWI Processes Technology Scope Sponsorship Funding Value Architecture Data Development Delivery (1) Nonexistent (2) Preliminary (3) Repeatable (4) Managed (5) Optimized Online Self-Evaluation Quantitative OCU People Processes Technology Team Scope SBU Role Data Products User Coverage Users Engagement Data Management Business Value Strategic Support (1) Absent (2) Initial (3) Expanded (4) Consolidated (5) Institutionaliz ed Self-Evaluation Quantitative IBM Processes Technology Data Integration Applications Infrastructure (1) Data to Run Business (2) Information to Run Business (3) Information as Strategic Asset (4) Information to Enable Innovation (5) Information as a Competitive Differentiator Unknown
Table 4 presents a comparative analysis of the maturity models according to their characteristics. There are several ways to differentiate the presented models, but one of the most obvious is its origin: academic or practical. Academic models generally have a context, whether are based on a bibliographic review, a subjacent theory or well-known concepts. Practical models are usually developed by consultants and are the result of their professional experience. It is important to state that there might be models whose origin can be both academic and practical – although their sources are not academic, it is not possible to say that they have influence of commercial aspects. The maturity models from Table 4 can be characterized according to its origin.
o Practical Origin: IBM;
o Academic/Practical Origin: TDWI and OCU.
Regarding the number of maturity levels, there is an equal situation: the TDWI Maturity Model, the White Book Maturity Model (OCU) and the IBM Information Maturity Model have five maturity levels.
18 Another important characteristic is the assessment (see Table 5). TDWI maturity model enables the online assessment, where the user can answer to a survey and see the results instantly. Both OCU and IBM do not specify how the assessment is done.
Table 5. Assessment of the BI Maturity Models
Maturity Model
Online
Assessment? Link Results
TDWI Yes http://tdwiorg0000.web711.discountasp.net/
Indicated after the completion of assessment OCU Unknown - - IBM Unknown - -
2.4 BI Task Force @ EUNIS
The BI Task Force @ EUNIS is a group of members of the European University Information Systems (EUNIS) organization. The goal of this task force is to promote the creation of a European online platform to share knowledge and practices on BI in the higher education sector. This platform is a way to achieve an ideal goal: a cooperation environment for the development of innovate applications across all higher education subject categories. The exchanged experiences can be classified in four groups: (1) BI Adoption and Management; (2) Success Factors; (3) Technical Infrastructures; and (4) Software.
The core team of this task force is made by participants of eight European countries: France, Germany, Ireland, Italy, Norway, Portugal, Spain and United Kingdom. As displayed in Figure 8, the BI Task Force @ EUNIS members are managers, professors, IT directors, BI professionals and workers from several departments in universities.
Figure 8 - Levels of Professional Career of BI Task Force @ EUNIS members (adapted from EUNIS, n.d.)
In 2013, the core team decided to create a BI Maturity Survey and use it as a starting point for the BI Task Force goals. This survey was developed to assess the “occurrence and maturity of BI applications across European HEIs”, and aims for a “continuously updated collection of maturity information, enabling participants to perform a self-assessment and benchmark of its BI maturity level against other HEIs, both actually and over time” (EUNIS, n.d.). It was available
University
Manager
Professor
IT Director
BI Professional
Higher
Education
Departments
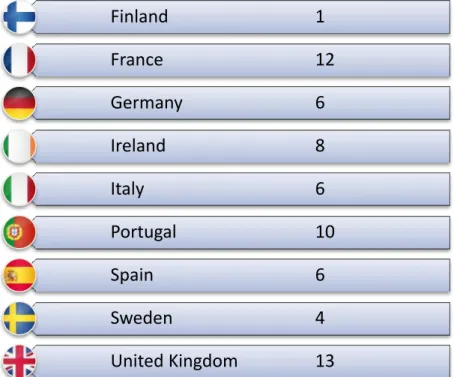
19 online until the end of 2013, and through the AlmaLaurea platform3. Figure 9 represents the participants in this survey regarding their geographical localization.
Figure 9 - Participant Countries in the BI Maturity Survey, and corresponding Number of Answers
The BI Maturity Survey was addressed mostly to IT Directors/CIOs, BI Managers or Rectory level. In total, there were 66 collected answers, mostly from public HEIs (about 92%). In Portugal and Italy, only universities were included.
The countries with more answers were France, Portugal and United Kingdom, each of them with more than 10 answers. The sum of the answers from these three countries represents more than half of the collected responses.
All of the collected answers were treated as anonymous, protecting the real identity of the respondents. Table 6 presents the profile of these respondents.
3
AlmaLaurea is a public Italian inter-university Consortium, composed by 65 universities, representing an innovative service providing online curricula to graduates. It has been a model for the analysis of academic performance of students, and of their entry into the labor market.
Finland
1
France
12
Germany
6
Ireland
8
Italy
6
Portugal
10
Spain
6
Sweden
4
United Kingdom
13
20 Table 6. Profile of BI Maturity Survey Participants
Profile Questions Percentage
How long ago did the BI/DW initiative start?
Not started yet 18%
Less than 1 year ago 11%
1 to 5 years ago 16%
5 to 10 years ago 33%
More than 10 years ago 11%
Don’t know 2%
What is the number of full-time equivalent BI/DW staff members (including contractors)? None 26% 1 18% 2 to 10 51% More than 10 2% Don’t know 3%
Regarding the number of years that universities had implemented a BI/DW initiative, the respondents represent different realities. Most of them use BI for 5 to 10 years, however, does not characterize half of the universities (33%). The second most popular answer was chosen for 18% of respondents and denote universities that have not started a BI/DW initiative. About 16% say that it is a recent reality in their institutions.
Concerning the full-time BI/DW staff members, about half of the universities have 2 to 10 employees. Still, an important percentage of them (26%) have no one working on BI. Regarding the survey analysis, Figure 10 shows the aggregated survey analysis, and Figures 11 to 19 presents the survey analysis for each country involved.
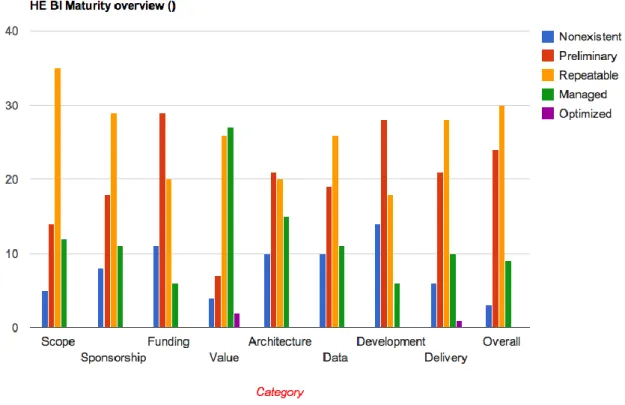
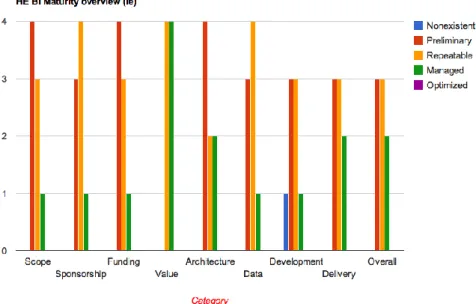
21 Figure 10 - Survey Analysis with Aggregated View
Figure 10 displays the survey results regarding the eight dimensions from TDWI Maturity Model and the Overall dimension – which demonstrates the overview perspective. Each dimension represents the total of respondents evaluated for each maturity level: Nonexistent, Preliminary, Repeatable, Managed and Optimized. Regarding the dimensions Scope, Sponsorship, Data and Delivery, most institutions assess themselves as in the Repeatable maturity level. Funding, Architecture and Development are the two dimensions where most institutions think they are at a starting level (Preliminary maturity level). Value is the only dimension with an assessment at the Managed level. Very few institutions find themselves at the Nonexistent maturity level, and practically none is at the Optimized level.
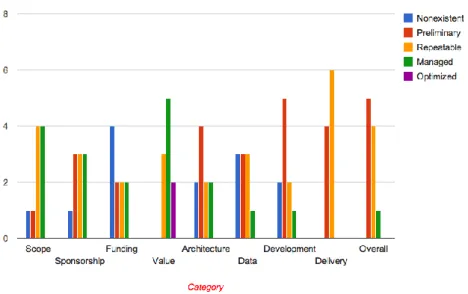
22 Figure 11 - Survey Analysis of German Participants
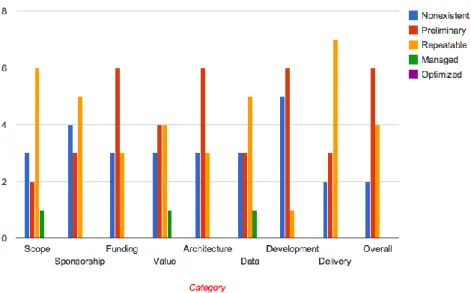
Figure 12 - Survey Analysis of Portuguese Participants
Figure 11 and Figure 12 show the survey results of Germany and Portugal, respectively. Regarding Germany, Architecture and Data dimensions were considered the least developed areas. At a preliminary level, Scope, Funding and Development are the dimensions in an initial state. Considering Sponsorship and Delivery, institutions assess themselves more strongly at the Repeatable level, while the Value dimension has half of the German institutions at the Managed level. The main conclusion from the Overall dimension is the equal division in the number of institutions at the Preliminary and Repeatable maturity levels.
Considering Portugal, Funding and Data dimensions were the two dimensions with the majority of institutions at the Nonexistent level. At the Preliminary maturity level, there are the Architecture and Development dimensions with the strongest results. Delivery is the dimension
23 that most of Portuguese institutions assess themselves at the Repeatable maturity level. From the Overall dimension, we can conclude that most institutions are at the Preliminary maturity level, although there are a few which assess themselves at the Managed level.
Figure 13 - Survey Analysis of Italian Participants
Figure 14 - Survey Analysis of Spanish Participants
Figure 13 and Figure 14 show the survey results of Italy and Spain, correspondingly. Analyzing the Italian results, it is consensual that the Managed and Repeatable maturity levels have a significant presence in this assessment. Scope, Funding, Architecture, Data, Development and Delivery have the biggest number of institutions at the Repeatable level. The Value dimension is mainly at the Managed level, yet it has a meaningful position in all other dimensions. At the
24 Overall dimension, it is clear that most Italian institutions assess themselves at the Repeatable maturity level.
Regarding the Spanish results, Funding, Value and Development are at a starting level – mostly Preliminary level. Scope and Sponsorship are at the Repeatable level for most institutions, while Architecture is the dimension where results show more for the Managed level. The Overall dimension shows that most Spanish institutions are at the Repeatable level, although the Nonexistent level is a reality for many of them (regarding all dimensions).
Figure 15 - Survey Analysis of Swedish Participants
Figure 16 - Survey Analysis of French Participants
Figure 15 and Figure 16 show the survey results of Sweden and France, respectively. The first conclusion we take from the Swedish results is that, from all respondents, there is not any
25 institution at the Nonexistent level regarding any dimension. Funding, Development and Delivery are the dimensions where the majority of institutions find themselves at the Preliminary level. Scope, Sponsorship and Architecture are at a Repeatable level, while Value and Data have the institutions equally distributed between Repeatable and Managed levels. Regarding the Overall dimension, the predominant maturity level is Repeatable.
Regarding France, Funding, Architecture and Development have the majority of institutions at the Preliminary level, while Scope, Sponsorship, Data and Delivery are at the Repeatable level. At the Overall dimension, French institutions find themselves at the Preliminary maturity level, although the Nonexistent level is a reality for many of the respondents.
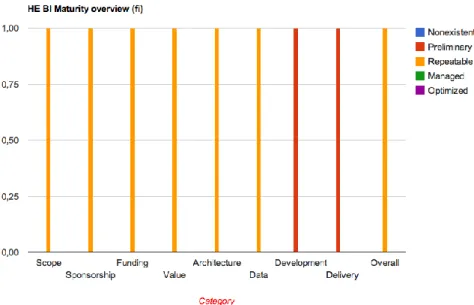
Figure 17 - Survey Analysis of Finnish Participants
As there was only one Finnish answer, we can conclude that the institution is at the Repeatable maturity level. Regarding all dimensions, only Development and Delivery are at the Preliminary level – see Figure 17.
26 Figure 18 - Survey Analysis of Irish Participants
Figure 19 - Survey Analysis of English Participants
Figure 18 and Figure 19 show the survey results of Ireland and United Kingdom, correspondingly. Considering Ireland, Scope, Funding, Architecture have the most Irish institutions at the Preliminary level. Sponsorship and Data have the most of them at the Repeatable level. Value dimension have institutions equally distributed between Repeatable and Managed level, at the same that we verify a similar situation in Development and Delivery dimensions – although between Preliminary and Repeatable maturity levels. Considering the Overall dimension, institutions are similarly balanced between Preliminary and Repeatable maturity levels, though it can be concluded that some of them are at the Managed level.
Considering the results from United Kingdom, it is possible to verify that Scope, Funding, Data and Development have the most part of respondents at the Repeatable level. Sponsorship is
27 mainly at the starting level, while Value is at the Managed level. The difference between the institutions and their corresponding maturity levels is significant, meaning different realities for several institutions. Regarding the Overall dimension, the majority of them are at the Repeatable maturity level, although a significant part is also at a Preliminary and at a Managed state.
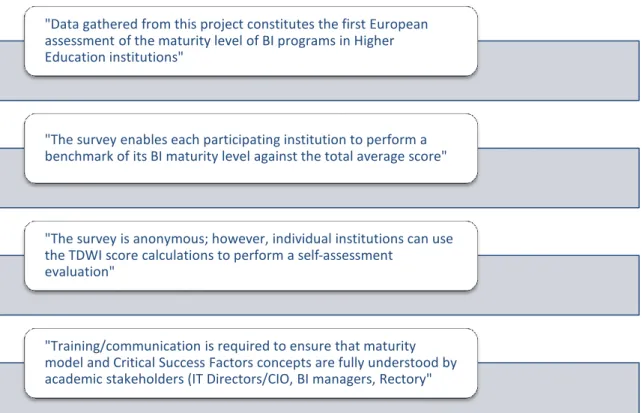
The concluding remarks that BI Task Force @ EUNIS collected from this survey are presented in Figure 20.
Figure 20 - Concluding Remarks about BI Task Force @ EUNIS survey (adapted from Cardoso, 2014)
2.4.1 Critical Analysis to the Results of the 2013 EUNIS BI Maturity Survey
The results of the 2013 EUNIS Maturity Survey reveal a lack of consistency. Considering the overall view, this might not be perceptible, because there are several countries involved, and each one of them with their own reality. However, analyzing the results of each nationality makes it easier to understand.
In Germany and Portugal’ case, respondents evaluated their funding, architecture and data dimensions as in an initial state, but their value dimension is in an advanced stage. In other words, this situation says that their budget is limited, their architecture is not fully developed, and there is a lot of work to do to accomplish fully integrated data sources with a “single version of the truth”, revealing that their BI initiatives are not completely stable; on the other hand, their universities are taking full advantages of their analytics. If data is not universal, it is difficult to produce effective BI products that will help improving higher education services.
"Data gathered from this project constitutes the first European assessment of the maturity level of BI programs in Higher Education institutions"
"The survey enables each participating institution to perform a benchmark of its BI maturity level against the total average score"
"The survey is anonymous; however, individual institutions can use the TDWI score calculations to perform a self-assessment
evaluation"
"Training/communication is required to ensure that maturity model and Critical Success Factors concepts are fully understood by academic stakeholders (IT Directors/CIO, BI managers, Rectory"