MARIA RIBEIRO DE SOUSA CARDOSO
ADDUCTOR POLLICIS AS AN UNDERNUTRITION SCREENING INDICATOR IN INSTITUTIONALIZED OLDER ADULTS
Universidade Fernando Pessoa Faculdade Ciências da Saúde
1
MARIA RIBEIRO DE SOUSA CARDOSO
ADDUCTOR POLLICIS AS AN UNDERNUTRITION SCREENING INDICATOR IN INSTITUTIONALIZED OLDER ADULTS
Universidade Fernando Pessoa Faculdade Ciências da Saúde
2
Maria Ribeiro de Sousa Cardoso
Adductor Pollicis as an undernutrition screening indicator in institutionalized older adults
_______________________________________ (Maria Ribeiro de Sousa Cardoso)
Orientadora: Prof. Doutora Rita Guerra Trabalho Complementar apresentado à Universidade Fernando Pessoa como parte dos requisitos para obtenção do grau de licenciado em Ciências da Nutrição
3
Adductor Pollicis as an undernutrition screening indicator in institutionalized older adults
Maria S. Cardoso1, Rita S. Guerra 1,2
1-Faculdade de Ciências da Saúde, Universidade Fernando Pessoa 4-UISPA – INEGI/LAETA
Corresponding author:
Maria Ribeiro de Sousa Cardoso
Faculdade Ciências da Saúde, Universidade Fernando Pessoa Rua Carlos da Maia, 296 | 4200-150 Porto
E-mail: [email protected]
Short title: Adductor Pollicis and undernutrition screening Word count: 5842
Number of tables and figures: 5 Conflict of interests: Nothing to declare
4 Índex Abstract ... 6 Resumo ... 7 Background ... 9 Objectives ... 10
Participants and Methods ... 11
Results ... 14 References ... 20 Table 1 ... 22 Table 2 ... 24 Table 3 ... 26 Table 4 ... 27 Table 5 ... 28 Annex 1 ... 29
5 List of abbreviations and acronyms
APMT- Adductor pollicis muscle thickness BMI- Body mass index
MNA- Mini nutritional assessment SD- Standard deviation
IQR- Interquartile range
ROC- Receiver operating characteristic SPSS- Statistical Package for Social Sciences SGA- Subjective global assessment
6
Adductor Pollicis as an undernutrition screening indicator in institutionalized older adults
(O adductor pollicis como indicador para o rastreio da desnutrição em idosos institucionalizados)
Abstract
Background: Population is ageing worldwide. With increasing age, institutionalization becomes a necessity for many older subjects. The adductor pollicis muscle thickness (APMT) is associated with muscle protein status, has shown to be correlated with nutritional parameters and was found to discriminate undernutrition status.
Objectives: To evaluate the validity of APMT to screen undernutrition in institutionalized older adults. It is intended to study the association between APMT, from dominant and non-dominant hands, with undernutrition, and to define gender-specific APMT cutoff values for undernutrition screening.
Participants and Methods: An observational analytic transversal study was conducted between May and July of 2018 in six nursing homes for older adults in the north of Portugal. A total of 104 subjects were enrolled. Socio-demographic and nutritional indicators were obtained. APMT was measured in dominant and non-dominant hands using a skinfold caliper. Mini Nutritional Assessment - full form (MNA) was used to evaluate undernutrition status. Two different multivariable linear regression models were constructed to identify variables possibly associated with dominant and non-dominant APMT (dependent variables). Gender-specific Receiver Operating Characteristic analysis was conducted to evaluate the performance of APMT for correctly screening undernutrition or its risk, on the basis of participants' classification by MNA (not undernourished versus undernutrition and undernutrition risk).
Results: The present study sample is composed of 31 men (29.8%) and 73 (70.2%) women, age ranged from 65 to 93 years old, mean (standard deviation) =82 (7) years. APMT was inversely associated with undernutrition or undernutrition risk: dominant APMT β=-0.284 (95% confidence intervals: -3.513; -0.896) and non-dominant APMT β=-0.207 (-2.977; -0.172), after adjustment for gender, age and education. Women’ cutoff value obtained for
7
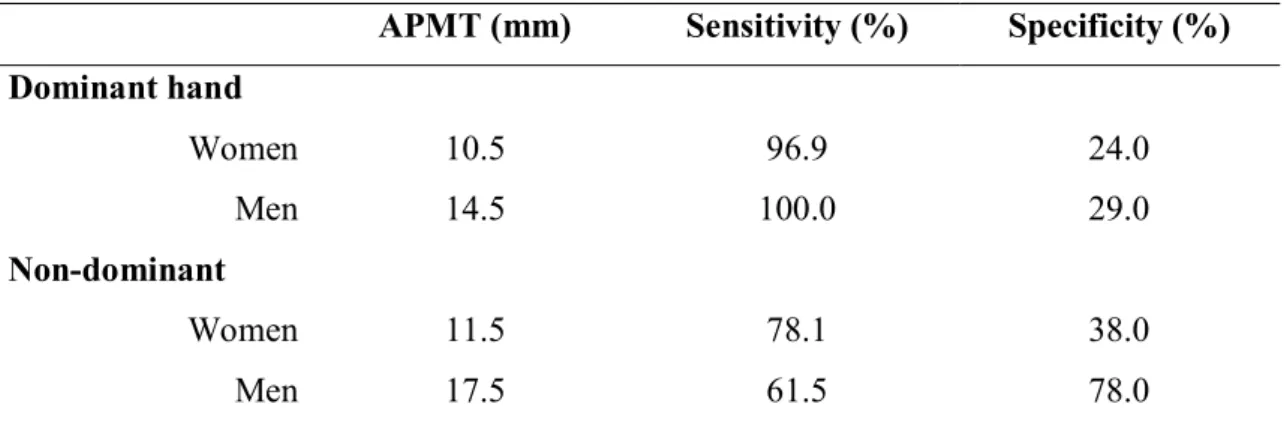
dominant APMT was 10.5 mm, with a sensitivity equal to 96.9% and a specificity equal to 24.0%. For non-dominant APMT these values were 11.5 mm, 78.1% and 38.0%, respectively. For men, dominant APMT cutoff value, sensitivity and specificity were respectively 14.5 mm, 100.0% and 29.0%, whereas for non-dominant APMT these values were 17.5 mm, 61.5% and 78.0%.
Conclusions: Relevant evidence regarding the validity of APMT as an undernutrition screening method for the institutionalized older adults was achieved. After adjustment for potential confounding variables, dominant and non-dominant APMT were found to be inversely associated with undernutrition or its risk. Moreover, APMT cutoff values were defined. In general, dominant APMT provided for better diagnostic values. These cutoffs need further validation.
Key words: dominant adductor pollicis muscle thickness, non-dominant adductor pollicis muscle thickness, older adults, Mini Nutritional Assessment, undernutrition screening, sensitivity, specificity, multivariable linear regression model, ROC analysis.
Resumo
Introdução: Mundialmente verifica-se o envelhecimento da população. Com o aumento da idade, a institucionalização torna-se uma necessidade para muitos idosos. A espessura do músculo adutor do polegar (EMAP) está associada com o estado proteico muscular e mostrou correlacionar-se com parâmetros nutricionais e descriminar o estado nutricional. Objetivos: Avaliar a validade do EMAP para o rastreio da desnutrição de idosos institucionalizados. Pretende-se estudar a associação entre o EMAP, da mão dominante e da mão não-dominante, com a desnutrição e definir pontos de corte do EMAP específicos para o género para o rastreio da desnutrição.
Participantes e Métodos: Realizou-se um estudo analítico transversal observacional entre maio e julho de 2018, em seis lares para idosos no norte de Portugal. Foram incluídos 104 indivíduos. Obtiveram-se indicadores sociodemográficos e nutricionais. Mediu-se o EMAP na mão dominante e mão não dominante com um lipocalibrador. Utilizou-se o Mini Nutritional Assessment – Full form (MNA) para avaliar o estado de desnutrição. Foram
8
construídos dois modelos de regressão linear multivariável diferentes para identificar variáveis possivelmente associadas com o EMAP dominante e não dominante (variáveis dependentes). Conduziu-se a análise Receiver Operating Characteristic, estratificada para o género, para avaliar o desempenho do EMAP como método de rastreio da desnutrição ou do risco de desnutrição, com base na classificação pelo MNA (sem desnutrição versus desnutrição e risco de desnutrição).
Resultados: A amostra do presente estudo é composta por 31 homens (29,8%) e 73 (70,2%) mulheres, com idades entre os 65 e os 93 anos, média (desvio-padrão) = 82 (7) anos. O EMAP associou-se inversamente com a desnutrição ou risco de desnutrição: EMAP dominante β=-0,284 (intervalo de confiança a 95%: -3,513; -0,896) e APMT não dominante β=-0,207 (-2,977; -0,172), após ajuste para género, idade e educação. O ponto de corte obtido do EMAP dominante para as mulheres foi 10,5 mm, com sensibilidade igual a 96,9% e especificidade igual a 24,0%. Para o APMT não-dominante, esses valores foram 11,5 mm, 78,1% e 38,0%, respetivamente. Para os homens, o ponto de corte do EMAP dominante foi 14,5 mm, com sensibilidade e especificidade iguais a 100,0% e 29,0%, enquanto que estes valores para o EMAP não-dominante foram 17,5 mm, 61,5% e 78,0%. Conclusões: Encontrou-se evidência relevante sobre a validade do EMAP como método de rastreio de desnutrição para idosos institucionalizados. Após o ajuste para potenciais confundidores, o EMAP dominante e não dominante associaram-se inversamente com a desnutrição ou risco de desnutrição. Para além disso, definiram-se pontos de corte do EMAP para o rastreio da desnutrição ou risco. De modo geral, o EMAP dominante forneceu melhores valores diagnósticos. Os pontos de corte encontrados necessitam de validação externa.
Palavras-chave: espessura do músculo adductor do polegar dominante, espessura do músculo do adductor do polegar não-dominante, idosos, Mini Nutritional Assessment, rastreio de desnutrição, sensibilidade, especificidade, modelo de regressão linear multivariado, análise ROC.
9 Background
Population is ageing worldwide. This phenomenon occurs mainly because of the increase in life expectancy, that can be explained by the wider access to health care facilities, improved medical treatments and better sanitary conditions. (1) Consequently, in 2015 almost 20% (2,1 billion) of the world’s population were aged 65 years or more. Of those, 614 million were aged 85 years or more . (2) Moreover, the older population is estimated to grow from the 524 million registered in 2010 to 1.5 billion in 2050. (3)
In Portugal and according to data from the last national Census, there was a rise of older adults from 16% in 2001 to 19% (2.0 million) in 2011. (4) Moreover, this group is expected to increase to 32% in 2050. (5)
With ageing, institutionalization becomes a necessity for many older subjects. In fact, in 2004, 56.535 Portuguese older adults, 3.2% of the total population, were institutionalized in 1517 different nursing homes. (6)
It is also noteworthy that the prevalence of undernutrition and of undernutrition risk among Portuguese older adults is high. According to the "Portuguese elderly nutritional status surveillance system" - PEN-3S, in 2015 approximately 4.3% of older adults were undernourished and 25.4% were at risk of undernutrition. Concerning institutionalized older subjects in Portugal, it is estimated that the prevalence of undernutrition or its risk reaches 85%. (3)
This is an alarming matter, as in older adults, undernutrition is associated with a higher burden of complications such as impaired immune response, that leads to an increased susceptibility to infections and diminishes wound healing capacity, to longer hospitalization stay and to an increased risk of morbidity and mortality (7)(8). Therefore, given its burden it is mandatory to screen undernutrition and to classify older adults’ nutritional status. (9) A valid and timely identification of undernutrition will allow a prompt intervention, that not only prevents the decay of the nutritional status, but also possibly leads to an improvement of the nutritional and health statuses, before further deterioration.(10)
However, due to both the lack of specialized professionals and the costs of some techniques that are part of nutritional status methods, it is often impossible to perform a complete
10
nutritional evaluation of all individuals admitted in nursing homes and even to conduct a formal nutritional screening procedure. Thereby, considering the optimization of costs and professional usage, it is relevant to search for a valid screening method that quickly and easily allows to signal subjects that are undernourished, that present a higher risk of being undernourished or a higher risk of developing undernutrition.
The adductor pollicis muscle thickness (APMT) is associated with muscle protein status and has shown to be correlated with nutritional parameters such as mid-arm circumference, calf circumference, body mass index (BMI) and weight. (7) The adductor pollicis has also been used to study muscle build-up since it may reflect the loss of muscle due to limitations in physical activity, due to a hidden disease or due to changes in nutritional status, that interfere with muscle trophicity and the thickness of muscle. (11) Moreover, the APMT was found to discriminate undernutrition status evaluated with the Subjective Global Assessment (SGA). (12) Other characteristics of the adductor pollicis are relevant for its use in screening procedures, this muscle is located between the thumb and the index finger, it is easily accessible, anatomically well-defined, has a minimal amount of subcutaneous fat tissue above and is promptly measured with a caliper. (10)(13)
However, few studies have correlated APMT with nutritional status in older adults. Also, these studies were conducted in hospitalized older adults or in subjects presenting specific pathologies.(11,12,14,15) Moreover, according to our knowledge, the validity of the APMT as an undernutrition screening method for institutionalized older adults has never been studied.
Objectives
The main purpose of this study is to evaluate the validity of APMT in screening undernutrition in institutionalized older adults. In order to so, it is intended to verify if there are differences in APMT between dominant and non-dominant hands; to study the association between APMT, from dominant and non-dominant hands, with undernutrition, and to define gender-specific APMT cutoff values for undernutrition screening of institutionalized older adults.
11 Participants and Methods
Study population and design
An observational analytic transversal study was conducted between May and July of 2018. The data used for this analysis was collected in six nursing homes for older adults in the north of Portugal.
The eligibility criteria to participate in the study were to be institutionalized, presenting ≥65 years old, ability to provide a written informed consent and not presenting neuro-muscular diseases. Patients presenting any condition that unabled APMT measurement, inability to understand verbal instructions or a cognitive impairment degree which unabled answer accuracy and bilateral amputation were excluded from the study.
In each nursing home, a responsible member of the staff was asked to provide a list of patients who were eligible for the investigation. The study sample is composed of 104 older adults.
This research was conducted according to the guidelines established by the Declaration of Helsinki and was approved by the Ethics Committee of Universidade Fernando Pessoa (Annex 1). Written informed consent was obtained from all study participants. Illiterate participants were explained the procedure and after they were asked to sign the informed consent with the fingerprint in the presence of two witnesses who also signed the document.
Data collection
Demographic data, gender and age, was assessed by reviewing the participants' files. The educational level was evaluated by the number of school years attended and the following classes were created: no schooling, 1 to 4 years, 5 to 12 years, and >12 years (higher education).
Age was not available from the participants' files for 4 participants (3.8%) that could not recall with precision their age. Also, 3 participants (2.9%) could not recall their educational level.
12
Weight was either consulted in medical files, if the weight had been measured in the same month of data collection (n=26, 25.0%) or measured with an electronic scale with a 0,1 kg resolution (16) at the time of data collection. Height was estimated by using hand length (17) or consulted in the patients' files. Hand length was measured with a measuring tape with a 0,1cm resolution.
Adductor pollicis muscle was measured with a caliper, presenting a constant pressure of 10g/mm2 and with a 0.5mm resolution. In order to conduct this measurement, the
participant was sitting with the hand resting on the leg and with the elbow in an angle of approximately 90° degrees over the lower limb. The caliper was used to pinch the adductor pollicis muscle in the vertex of an imaginary triangle formed by the thumb and the index finger. This procedure was repeated three times and the mean value was registered. The procedure was done in both hands. (18)
From the total sample (n=104), APMT was assessed on both hands in 101 participants. It was possible to measure dominant APMT in 103 participants and non-dominant APMT in102 participants.
Calf and mid-upper arm circumferences were measured with a measuring tape with a 0,1cm resolution, according to standardized procedures (16).
Undernutrition status was evaluated with the Mini Nutritional Assessment - full form (MNA). According to this tool, older adults are classified as being not undernourished, as presenting undernutrition risk or as being undernourished.
Statistical analysis
Categorical variables are reported as frequencies. The Kolmogorov–Smirnov test was used to evaluate the normality of continuous variables' distribution and accordingly, continuous variables are reported as mean and standard deviation (SD) or as median and interquartile range (IQR).
Wilcoxon signed ranks test was used to compare the differences between the non-dominant and dominant APMT and also to compare APMT differences between men and women, from dominant and non-dominant hands. Given the low number of undernourished participants (n=3, 2.9%), patients presenting undernutrition and undernutrition risk were
13
grouped in a single category. Participants without undernutrition and participants at undernutrition risk or undernourished were compared for several characteristics using the t-test for independent samples, the Mann -Whitney t-test or the Pearson qui-square t-test, whether the variables were continuous or categorical.
Participants were dichotomized according to presenting or not dominant APMT depletion by using the median value for the entire sample stratified by gender: 15 mm for women (depletion: <15 mm) and 18 mm for men (depletion: <18 mm). Participants were then compared for several characteristics, using the t-test for independent samples, the Mann-Whitney test or Pearson qui-square test, for continuous or categorical variables, respectively.
Two different multivariable linear regression models were constructed to identify variables possibly associated with dominant APMT (dependent variable) and with non-dominant APMT (dependent variable). Both models included the following independent variables: gender (dichotomous), age (continuous), education (categorical), MNA (categorical - not undernourished versus undernutrition and undernutrition risk) and the method “Enter” was chosen.
Participants were dichotomized for dominant and non-dominant APMT depletion, according to 5th percentile previously described in the literature. (19) Sensitivity and
specificity values for APMT were calculated, based on participants' nutritional status classification by MNA (not undernourished versus undernutrition and undernutrition risk). Moreover, gender-specific receiver operating characteristic (ROC) analysis were conducted to evaluate the performance of APMT for correctly screening undernutrition or its risk, on the basis of participants' classification by MNA (not undernourished versus undernutrition and undernutrition risk). Sensitivity and specificity were calculated for a range of APMT cutoff values. The ROC analysis allows to identify the cutoff point at which most individuals are correctly classified, and a minimum of individuals are incorrectly classified.(20)
Results were considered significant when p<0.005. All data was analyzed with the statistics software Statistical Package for Social Sciences - SPSS, from IBM, version 25, 201
14 Results
The present study sample is composed of 104 participants, 31 men (29.8%) and 73 (70.2%) women. The participants' age ranged from 65 to 93 years old, with a mean (SD) equal to 82 (7) years.
Within this sample, 59 (56.7%) participants presented undernutrition or undernutrition risk and 45 (43.3%) were not undernourished.
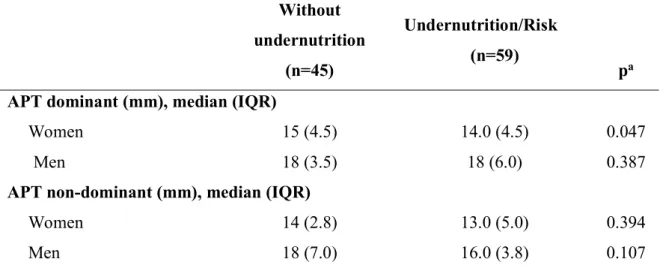
APMT was significantly higher in the dominant hand, median (IQR) equal to 15.0 (4.0) mm for women and 18.0 (4.2) mm for men when compared to the non-dominant hand, median (IQR) equal to 14.0 (5.0) mm and 16.5 (4.2) mm, p<0.001. Men presented higher mean of APMT compared to women, in both dominant and non-dominant hands, respectively: mean (SD) equal to 17.8 (3.9) mm versus 14.4 (3.4) mm, p=0.028, for dominant hand and 16.2 (3.3) mm versus 13.2 (3.7) mm, p=0.007, for non-dominant hand. Participants' characteristics according to nutritional status is presented in Table 1. Women with undernutrition or undernutrition risk presented lower median values for mid-arm circumference, for calf circumference and for dominant APMT (p<0.047).
Participants' characteristics according to whether presenting dominantAPMT depletion or not are shown in Table 2. It was chosen to present results according to the dominant APMT because only for dominant APMT a difference was found according to nutritional status categories.
Participants presenting dominant APMT depletion were older when compared with those not presenting depletion, p=0.001 (Table 2).
In what concerns the multivariable linear regression analysis, male gender was directly associated with dominant and with non-dominant APMT, whereas older age and being undernourished or at-risk according to MNAwere inversely associated with APMT of both hands (Table 3). The variables included in the model explained 29.9% of dominant APMT variation and 18.6% of non-dominant APMT variation.
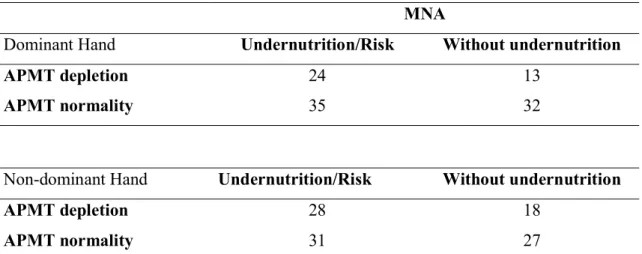
Sensitivity and specificity of APMT were calculated, using Gonzalez et al. (19) cutoff values: 15 mm for women and 18 mm for men, and according to MNA classification used as the gold standard. Both dominant and non-dominant APMT have shown reasonable
15
specificities, 71.0% and 60.0% respectively, but low sensitivities, 40.7% in the dominant hand and 47.5% in the non-dominant hand (Table 4).
Given the unsatisfactory performance of APMT as a screening method recurring to literature cutoff values, ROC curves were constructed to evaluate the validity of the APMT as a screening method. The sensitivities and specificities obtained ranged respectively from 61.5 to 100.0% and from 24.0% to 78.0% (Table 5).
16 Discussion
The present study shows that APMT is a promising undernutrition screening method for institutionalized older adults. Within this study it was shown that dominant and non-dominant APMT were inversely independently associated with undernutrition and undernutrition risk, after adjusting for socio-demographic indicators. Moreover, APMT cutoff values for undernutrition screening of institutionalized older adults are provided. When using APMT cutoff values described in the literature, despite the reasonable specificities, the sensitivities were low, and thus, ROC curves were constructed to evaluate the validity of the APMT as an undernutrition screening method. Women’ cutoff value obtained for dominant APMT was 10.5 mm, with a sensitivity equal to 96.9% and a specificity equal to 24.0%. For non-dominant APMT these values were 11.5 mm, 78.1% and 38.0%, respectively. For men, dominant APMT cutoff value, sensitivity and specificity were respectively 14.5 mm, 100.0% and 29.0%, whereas for non-dominant APMT these values were 17.5 mm, 61.5% and 78.0%.
Thus, APMT cutoff values provided within this sample revealed low specificities but satisfactory sensitivities, except for older men when using non-dominant APMT. It is also worth mentioning that sensitivities obtained were considerably higher for dominant hand, compared with non-dominant hand. A high sensitivity means a low proportion of that false negatives which is relevant for a screening tool. A sensitive method means that low proportions of subjects will be misdiagnosed and consequently subjects will have a higher opportunity of receiving nutritional support, with presumed better nutritional and clinical outcomes. However, low specificity means a high number of false positives (not undernourished subjects but identified as being undernourished) that although is less harmful to the nutritional or clinical results, can be problematic for the institutions given the need to perform a complete nutritional evaluation to a higher number of subjects.
The low specificity values obtained for dominant APMT and for women when using non-dominant APMT and also the low sensitivity value obtained for men when using non-dominant APMT can be due to the low sample size. A larger sample would allow to stratify the sample by age groups. Given the independent association between dominant and non-dominant APMT with age, the establishment of age groups could improve the
17
diagnostic values found. In fact, in a systematic review, Lew et al. (10) stated that more studies are needed to establish APMT cutoff values stratified by gender and age, in order to use APMT for nutritional screening. Accordingly, future studies should be conducted in large national samples.
According to our knowledge this is the first study that evaluated the APMT validity as an undernutrition screening method for institutionalized older adults, compared with the MNA classification.
Although some previous studies have shown that APMT can be used as a nutritional assessment parameter, these studies were conducted in mixed samples of adults and older adults but restricted to subjects admitted to the hospital or with specific pathologies, and therefore presenting health and general conditions different from the subjects included in the present research.
According to Poziomyck et al (15), APMT allows to screen undernutrition in gastric cancer patients. The sample included a total of 44 patients, with a age range from 34 to 83 years old age and mean (SD) equal to 63 (10.2) years. Weak but significant correlations (p=0,001) were obtained between SGA and dominant (Pearsonr=-0.399) and non-dominant (Pearsonr=-0.372) APMT.
Valente et al. (14) in a study conducted in 150 patients candidates to surgery, with a mean age of 42.7 (SD: 12.0) years and of which 26,7% were older adults, found weak correlations between APMT and several indicators of nutritional status. APMT was found to be correlated with mid-arm circumference (r=0.326; p<0.01), with corrected muscle arm area (r=0.371; p<0.01), with calf circumference (r=0.320; p<0,01) and with BMI (r=0.290; p<0,01). Moreover, a significant association was found between APMT with the SGA (p=0.021). The authors also conducted a multiple linear regression analysis, using the stepwise method, and showed that gender (p=0.001) and the anthropometric indicators arm muscle circumference (p=0.036), corrected arm muscle area (p=0.004) and BMI (p=0.004) were significantly associated with APMT.
In a study conducted in 83 cardiac intensive care unit patients, presenting age range from 35 to 98 years old and mean age of 68.6 (SD: 12,5) years, Karst, et al,(12) described moderate correlations between left APMT with BMI (r=0.44; p<0.001) and with calf
18
circumference (r=0.57; p<0.001). For the right APMT these correlations were equal to r=0.45 (p<0,001) for BMI and equal to r=0.58 (p<0,001) for calf circumference. A ROC curve was also done for right APMT and a reasonable area under the curve of 0.822 (with a 95% trust interval of 0.73 to 0.91), was found. Specificity and sensitivity values were not calculated, so it is not possible to compare the results with the ones from the present study. Melo, et al (11) included in a study 151 surgical patients with a mean age of 52 (SD: 15.8) years, from which 36.4% were older subjects. Undernourished patients according to arm circumference, triceps skinfold thickness and BMI, presented lower dominant and non-dominant APMT mean values (p<0.003). These values were respectively for arm circumference, triceps skinfold thickness and BMI equal to: mean 12.51 (SD: 3.30) mm for dominant hand and 11.77 (SD: 3.17) mm for non-dominant, mean 12.14 (SD: 3.48) mm for dominant hand and 11.43 (SD: 3.33) mm for non-dominant, mean 10.83 (SD: 2.96) mm for dominant hand and 10.30 (SD: 3.10) mm for non-dominant.
The use of MNA full-form as the gold method to evaluate nutritional status is a study strength since this tool has proven validity to assess the nutritional status of older adults and is considered the best tool for this purpose. (21) Despite the different provenience of study participants from several nursing homes which empowers the study, one limitation of the study is the low sample size that did not allow to stratify the sample by age groups. Moreover, for 25% of the present study sample, weight was not obtained in the same day of all other data collection. However, for most of these participants the difference in days between weight measurement and data collection was ≤8 days. Also, the presence of disease, namely of chronic diseases, was not assessed and so it was not possible to adjust the association between dominant and non-dominant APMT with undernutrition status to this variable, which is also recognized as a study limitation.
19 Conclusion
The results from the present study are promising because relevant evidence regarding the validity of APMT as an undernutrition screening method for the institutionalized older adults was achieved. Within this sample, dominant APMT was significantly higher than non-dominant APMT, for both men and women. It is important to highlight that after adjustment for potential confounding variables, dominant and non-dominant APMT were found to be inversely associated with undernutrition or its risk, evaluated by MNA. Moreover, APMT cutoff values were defined. In general, dominant APMT provided for better diagnostic values. Nevertheless, these cutoffs need further validation.
20 References
1. PORDATA - Esperança de vida à nascença: total e por sexo [Internet]. [cited 2018
Jun 19]. Available from:
https://www.pordata.pt/Europa/Esperança+de+vida+à+nascença+total+e+por+sexo-1260
2. Comissão económica das nações unidas para a europa (PT)Terceiro ciclo de revisão e avaliação da estratégia de implementação regional do plano internacional de Madrid sobre o envelhecimento. 2017 Report No.:12427/2016
3. O Projeto PEN-3S - Portuguese Elderly Nutritional Status Surveillance System [Internet]. 2018 [cited 2018 May 22]. Available from: http://pen3s.uepid.org/pt/o-projeto-pen-3s/
4. INE. CENSOS 2011. Vol. 60. 2011. 1-223 p.
5. Carneiro R, Chau F, Soares C, António J, Fialho S, Sacadura MJ. O envelhecimento da população: Dependência, ativação e Qualidade. Lisboa; 2012
6. Neto J. A Pessoa idosa institucionalizada: Depressão e suporte social. 2013 [
7. Caporossi FS, Caporossi C, Borges Dock-Nascimento D, de Aguilar-Nascimento JE. Measurement of the thickness of the adductor pollicis muscle as a predictor of outcome in critically ill patients. Nutr Hosp. 2012; 27(2):490–5.
8. Hickson M. Malnutrition and ageing. Postgrad Med J. 2006;82(963):2–8.
9. Gombos T, Kertész K, Csíkos Á, Söderhamn U, Söderhamn O, Prohászka Z. Nutritional form for the elderly is a reliable and valid instrument for the determination of undernutrition risk, and it is associated with health-related quality of life. Nutr Res. 2008 Feb 1
10. Lew CCH, Ong F, Miller M. Validity of the adductor pollicis muscle as a component of nutritional screening in the hospital setting: A systematic review. Clin Nutr ESPEN. 2016;16.
11. Melo CYSV de, Silva SA da. Adductor pollicis muscle as predictor of malnutrition in surgical patients. Arq Bras Cir Dig 2014;27(1):13–7.
21
12. Karst FP, Vieira RM, Barbiero S. Relação da espessura do músculo adutor do polegar e avaliação subjetiva global em unidade de terapia intensiva cardiológica. Rev Bras Ter Intensiva. 2015;27(4):369–75.
13. Bielemann RM, Horta BL, Orlandi SP, Barbosa-Silva TG, Gonzalez MC, Assunção MC, et al. Is adductor pollicis muscle thickness a good predictor of lean mass in adults? Clin Nutr. 2016;35(5):1073–7.
14. Valente KP, Silva NMF, Faioli AB, Barreto MA, Moraes RAG de, Guandalini VR. Thickness of the adductor pollicis muscle in nutritional assessment of surgical patients. Einstein (São Paulo). 2016;14(1):18–24.
15. Kirjner Poziomyck A, Campos Corleta O, Cavazzola LT, Weston AC, Lameu EB, Coelho LJ, et al. Adductor pollicis muscle thickness and prediction of postoperative mortality in patients with stomach cancer. ABCD Arq Bras Cir Dig Artig Orig. 2018;31(1).
16. Stewart a a, Marfell-Jones M, Olds T, Al. E. International standards for anthropometric assessment. Low Hutt, New Zeal Int Soc Adv Kinanthropometry. 2011;125f.
17. Guerra RS, Fonseca I, Pichel F, Restivo MT, Amaral TF. Hand length as an alternative measurement of height. Eur J Clin Nutr [Internet]. 2014 Feb;68(2):229– 33.
18. Lameu EB, Gerude MF, Corrêa RC, Lima KA. Adductor pollicis muscle: a new anthropometric parameter. Rev Hosp Clin Fac Med Sao Paulo. 2004;59(2):57–62. 19. Gonzalez MC, Duarte RRP, Budziareck MB. Adductor pollicis muscle: Reference
values of its thickness in a healthy population. Clin Nutr. 2010;29(2):268–71.
20. Fletcher RH, Fletcher SW, Fletcher GS. Clinical Epidemiology: the essentials. 4 th. Philadelphia: Lippincott, williams & wilkins; 2005. 35-58 p.
21. Van Bokhorst-De Van Der Schueren MAE, Guaitoli PR, Jansma EP, De Vet HCW. Nutrition screening tools: Does one size fit all? A systematic review of screening tools for the hospital setting q. 2014
22
Table 1- Demographic and anthropometric characteristics of 104 institutionalized older Portuguese adults participating in a transversal observational study according to nutritional status evaluated by MNA (without undernutrition versus undernutrition or undernutrition risk). Without undernutrition (n=45) Undernutrition/Risk (n=59) pa
Age (years)*, median (IQR) 82 (9) 82 (13) 0.694
Gender, n (%) Women 32 (69.5) 41 (71.1) 0.858 Men 13 (30.5) 18 (28.9) Education (years)**, n (%) 0 12 (27.3) 14 (24.6) 0.457 1-4 18 (40.9) 31 (54.4) 5-12 2 (4.5) 3 (5.3) >12 12 (27.3) 9 (15.8)
Weight (kg), median (IQR)
Women 69.3 (17.0) 60.2 (21.2) 0.052
Men 74.5 (18.4) 66.6 (19.1) 0.254
BMI (kg/m2), mean (SD)
Women 29.2 (5.5) 27.3 (6.0) 0.074
Men 26.7 (4.9) 25.3 (4.3) 0.266
Mid-arm circumference (cm), mean (SD)
Women 29.8 (4.4) 27.5 (5.5) 0.034
Men 28.8 (3.3) 28.0 (3.5) 0.265
Calf circumference (cm), median (IQR)
Women 34.8 (4.4) 32.5 (5.3) 0.012
23
Table 1- Demographic and anthropometric characteristics of 104 institutionalized older Portuguese adults participating in a transversal observational study according to nutritional status evaluated by MNA (without undernutrition versus undernutrition or undernutrition risk). (cont.) Without undernutrition (n=45) Undernutrition/Risk (n=59) pa
APT dominant (mm), median (IQR)
Women 15 (4.5) 14.0 (4.5) 0.047
Men 18 (3.5) 18 (6.0) 0.387
APT non-dominant (mm), median (IQR)
Women 14 (2.8) 13.0 (5.0) 0.394
Men 18 (7.0) 16.0 (3.8) 0.107
MNA = Mini Nutritional Assessment-full-form; IQR= interquartile range; BMI= body mass index; SD= standard deviation; APT= adductor pollicis thickness;
*Data presented for 100 participants. ** Data presented for 101 participants.
aQui-square test was used for categorical variables, Mann-Whitney test continuous for not normally distributed continuous variables and t-test for independent samples for continuous normally distributed variables.
24
Table 2 - Demographic and anthropometric characteristics of 104 institutionalized older Portuguese adults participating in a transversal observational study according to whether presenting or not dominant APMT depletiona.
Dominant APMT (mm) Normality Women (n=35) Men (n=12) Depletion Women (n=38) Men (n=19) p b
Age (years)*, median (IQR) 81 (10) 86 (9) 0.001
Gender, n (%) Women 38 (66.7) 35 (74.5) 0.387 Men 19 (33.3) 12 (25.5) Education (years)**, n (%) 0 15 (26.8) 11 (24.4) 0.880 1-4 28 (50.0) 21 (46.7) 5-12 2 (3.6) 3 (6.7) >12 11 (19.6) 10 (22.2)
Weight (kg), median (IQR)
Women 73.6 (17.1) 59.0 (12.8) 0.276
Men 78 (18) 64,9 (13,6) 0.418
BMI (kg/m2), mean (SD)
Women 30.4 (5.6) 25.6 (5.1) 0.412
Men 27.3 (4.3) 23.6 (3.9) 0.415
Mid-arm circumference (cm), mean (SD)
Women 31.0 (4.1) 27.2 (3.7) 0.353
Men 28.9 (2.8) 26.9 (2,.1) 0.349
Calf circumference (cm), median (IQR)
Women 35.8 (5.3) 32.0 (4.0) 0.169
25
Table 2 - Demographic and anthropometric characteristics of 104 institutionalized older Portuguese adults participating in a transversal observational study according to whether presenting or not dominant APMT depletiona (cont.)
Dominant APMT (mm) Normality Women (n=35) Men (n=12) Depletion Women (n=38) Men (n=19) p MNA, n (%) Without undernutrition 30 (52.6) 29 (61.7) 0.353 Undernutrition/ Risk 27 (47.4) 18 (38.3)
APMT- Adductor pollicis muscle thickness; IQR= interquartile range; BMI= body mass index; SD= standard deviation; MNA= mini nutritional assessment.
*Data presented for 100 participants. ** Data presented for 101 participants.
aBased on the median value for the entire sample stratified by gender: 15 mm for women (depletion: <15 mm; normality: ≥15 mm) and 18 mm for men (depletion: <18 mm; normality: ≥18 mm). bQui-square test was used for categorical variables, Mann-Whitney test continuous for not normally distributed continuous variables and t-test for independent samples for continuous normally distributed variables.
26
Table 3 - Variables associated with dominant and non-dominant adductor pollicis muscle thickness (mm) by multivariable linear regression for institutionalized older Portuguese adults participating in a transversal observational study a.
Variables β 95%CI p Dominant handb (n=97) Gender 0.338 1.420; 4.321 <0.001 Age* -0.319 -0.275; -0.073 <0.001 Education** 1-4 0.044 -1.135; 1.816 0.648 5-12 -0.096 -4.802; 1.430 0.285 >12 -0.056 -2.756; 1.469 0.547 MNA -0.284 -3.513; -0.896 0.001 Non-dominant handc (n=96) Gender 0.302 0.944; 4.026 0.002 Age -0.266 -0.246; -0,042 0.006 Education 1-4 0.118 -0.681; 2.477 0.262 5-12 0.045 -2.785; 4.516 0.639 >12 0.058 -1.606; 2.902 0.569 MNA2 -0.207 -2.977; -0.172 0.028
CI=.confidence intervals; MNA= Mini nutritional Assessment - Full form.
aVariables included in all models: gender (female was used as reference), age (continuous), education (no schooling was used as reference), MNA (being not undernourished was used as reference).
bAdjusted R2=0.299. cAdjusted R2=0.186.
27
Table 4 – Nutritional status categorization of 104 institutionalized older Portuguese adults participating in a transversal observational study of according to MNA and according to APMT reference dataa.
MNA
Dominant Hand Undernutrition/Risk Without undernutrition
APMT depletion 24 13
APMT normality 35 32
Non-dominant Hand Undernutrition/Risk Without undernutrition
APMT depletion 28 18
APMT normality 31 27
MNA= Mini Nutritional Assessment-Full form; APMT= adductor pollicis muscle thickness
aBased on cut-off values found in literature 14 mm for women (depletion: <14 mm; normality: ≥14mm) and 18 mm for men (depletion: <18 mm; normality: ≥18 mm) for dominant hand; 14 mm for women (depletion: <14 mm; normality: ≥14mm) and 16 mm for men (depletion: <16 mm; normality: ≥16 mm) for non-dominant hand.
28
Table 5- Gender-specific cut-offs (mm) and diagnostic values for dominant and non-dominant APMT for undernutrition screening based on undernutrition status classification by MNA.
APMT (mm) Sensitivity (%) Specificity (%) Dominant hand Women 10.5 96.9 24.0 Men 14.5 100.0 29.0 Non-dominant Women 11.5 78.1 38.0 Men 17.5 61.5 78.0
29 Annex 1