Transforming natural resources into industrial
advantage: the case of China’s rare earths industry
Transformando Recursos Naturais em Vantagem Industrial:
o Caso da Indústria de Terras Raras na China
CARLOS AGUIAR DE MEDEIROS NICHOLAS M. TREBAT*
RESUMo: Este artigo analisa o desenvolvimento da indústria de terras raras da China, des-tacando o papel de iniciativas estatais na transição deste país de exportador de terras raras para grande consumidor industrial dessas matérias-primas. Tal como outras potências in-dustriais no passado, a China se aproveita de suas reservas de matérias-primas estratégicas, disponíveis em grande quantidade e a baixo custo de produção no território chinês, para promover setores de maior valor agregado. Argumentamos que, no caso de terras raras, esta estratégia tem sido bem-sucedida, rompendo com uma divisão internacional clássico do trabalho que existia antes de 2000, em que a China exportava a maior parte de sua produção de terras raras para países ricos, e transformando as empresas chinesas em expor-tadores a jusante de produtos mais soisticados.
PALAVRAS-CHAVE: terras raras, política industrial, progresso técnico, tecnologias verde.
ABSTRACT: This paper analyzes the development of China’s rare earths industry, emphasiz-ing the role of state technological initiatives in the country’s transition from rare earth ex-porter to large industrial consumer of these raw materials. Like other industrial powers before it, China takes advantage of low-cost domestic supplies of strategic raw materials to promote higher value-added manufacturing. We argue that, in the case of rare earths, this strategy has been largely successful, disrupting a classic international division of labor that existed prior to 2000, in which China exported most of its rare earth output to wealthy countries, and transforming Chinese irms into exporters of more sophisticated down-stream products.
KEYWoRDS: rare earths; industrial policy; technical advance; green technologies. JEL Classiication: o1; o2; o3; N5.
* Universidade Federal do Rio de Janeiro, Brasil. E-mail: [email protected]; Universidade Federal do Rio de Janeiro, Brasil. E-mail: [email protected]. Submitted: 27/November/2015; Approved: 19/May/2016.
INTRoDUCTIoN
Rare Earths Elements (REE), a heterogeneous group of raw materials widely used in modern technologies, became a critical issue in world trade in the late 2000s as China, practically the world’s only REE producer at the time, slashed export quotas. The quota reduction was particularly sharp in 2010, alarming representa-tives of advanced industry in the US, Western Europe and Japan, who urged G-20 leaders to “work together [...] for a stable and secure rare-earth supply” (oster, 2010). In 2012, the US, followed by Japan and the EU, formed a WTo panel to judge the legality of China’s export restrictions. Legislators from these regions also took measures to stimulate domestic production and find alternative supply sources.
China’s decision to control rare earth exports marks a turning point in the international supply of these raw materials, as well as in the division of labor be-tween China and more advanced countries in renewable energy, defense, and other high-tech areas. The US was once the world’s largest producer of REEs, but Chine-se competition, as well as pollution cauChine-sed by rare earth mining and processing, led to mine closures in the US and other countries. As a result, Chinese producers took over the world market. By 2005, their share of global production had reached 95%. China assumed this dominant position just as world REE demand was increa-sing with the proliferation of applications in consumer electronics, weapons systems and green technologies. Much of this demand increase took place within China itself. Between 2000 and 2007, China, once little more than an exporter of rare earth ores and concentrates, became a large manufacturer of high-tech magnets, wind turbines and other rare earth-dependent products. In 2000, China exported over 90% of its REE output, mainly to the US, the EU and Japan. By 2012, it was shipping abroad less than 20% of its output.
We argue below that this transition was the result of a long-run industrial policy for rare earths and part of a broader strategy to promote higher value-added production and create new advantages in electronics and green technologies. In adopting this strategy, China seems to be following the development path of other large industrialized economies. Rather than rely on raw materials exports, it uses its control over strategic raw materials as a source of geopolitical power and as a basis for industrial and technological upgrading.
RAW MATERIALS AND ECoNoMIC
DEVELoPMENT IN HISToRICAL PERSPECTIVE
A recurring theme in economic history is the importance of stable access to raw materials in processes of growth and technical advance. Though large domes-tic supplies of natural resources hardly constitute a sufficient condition for econo-mic development, they played vital roles in the growth experiences of today’s ad-vanced powers.
manu-facturing position on the basis of a natural resource advantage. Prior to 1600, British textile manufacturing was relatively backward. England exported raw wool and cheap woolen cloth to the Low Countries in exchange for more advanced textile products. In the 14th century, British monarchs began discouraging raw wool
exports and encouraging domestic production of cloths, a policy radicalized by the Tudor monarchs towards the end of the 15th century. queen Elizabeth I banned the
wool export trade completely in the 1580s, crippling Flemish manufacturers and enabling British producers, with privileged access to wool, to outcompete continen-tal rivals (Chang 2002, pp. 19-20; Power, 1955).
Natural resources were key factors for Britain in the 18th and 19th centuries as
well (Landes, 1969; Deane, 1980; Milward and Saul, 1979). Privileged access to the sea and coal and iron reserves in close proximity to one another gave it an advantage over other European industrializers, with the partial exception of Ger-many, which also had large deposits of high-quality coal and iron, especially after its conquest of the French Lorraine in 1871.
No modern industrial country, however, compares with the US in terms of availability of the raw materials necessary for industrialization. Until the mid-20th
century, the US was “the world’s dominant producer of virtually every one of the major industrial minerals of that era”. “Here and there a country rivaled the US in one or another mineral, but no other nation was remotely close to the United Sta-tes in the depth and range of its overall mineral abundance” (Wright and Czelusta, 2001).
Irwin (2000) traces the surge in US industrial exports in the 1890s to the dis-covery of vast iron deposits in the Midwest, providing benefits “equivalent to nearly 30 years of productivity improvements” in heavy industry. Decades later, US industries like automobiles still enjoyed “enormous cost advantages over competi-tors in raw materials, especially steel” (Wright, 1990, p. 662). Large domestic sup-plies of oil, the most important raw material of the 20th century, were essential to
US technological leadership during the “Age of oil, the Automobile and Mass Production” (Perez, 2002).
These observations should not obscure a crucial point: transforming resources into industrial advantage in Britain, Germany, and the US involved much more than the chance discovery of raw materials. It required public investments in infrastruc-ture to bring raw materials to manufacturing centers; industrial tariffs and export controls discouraging specialization in primary goods production; state-sponsored geological surveys and scientific research to improve extraction methods; and te-chnical advances to adapt production technologies to the resources available on domestic soil.
develop-ment “sounded the death knell for the concept of European industrialization as an unaided breakthrough by the bourgeoisie” (pp. 417-18).
US industrial policy in the 19th century was ubiquitous, ranging from high
in-dustrial tariffs to public investment in advanced manufacturing technologies, gene-rally for military purposes. Some of these policies had a direct effect on the country’s ability to harness its resource base for industrial advantage. State and federal gover-nments, even prior to the Civil War, financed and managed many of the locks, canals and railroads linking extractive industries to manufacturing centers (Bowlus, 2010; Goodrich, 1961, 1970). The federal government also mapped mineral deposits and acted as “national scientific coordinator”, promoting research in minerals science and its application in modern industry (Wright, 2001; Kelly, 2014).
Notwithstanding the importance of domestic supplies of raw materials in Wes-tern industrialization, their role in economic development remains a subject of debate. Japan and South Korea experienced rapid industrial growth after World War II despite being completely dependent on raw materials imports, while many countries in Africa, Latin America and Southeast Asia remain relatively poor and underdeveloped despite being resource-rich.
one popular and very simplistic explanation for this discrepancy is the “re-source curse” (Auty, 1998; Sachs and Warner, 1995), based on an alleged negative correlation between resource abundance and economic growth in the latter half of the 20th century. Transport cost reductions, the theory’s proponents argue, have
eliminated the need for domestic supplies of raw materials, while various economic and political factors purportedly associated with resource abundance (Dutch Di-sease, state interventionism, corruption) impose slower rates of growth on resour-ce-abundant countries.
Though this is not the place for an extended analysis, a few remarks are in order. First, Sachs and Warner (1995), pioneers of the resource curse literature, use as their preferred measure of “resource abundance” the ratio of primary goods exports to GDP. As a result, underdeveloped countries with weak manufacturing sectors will appear, by this measure, “resource-abundant”, while economies with massive resource endowments but also competitive manufacturing sectors, like the US or China, will appear “resource-poor”. It comes as little surprise that other studies have found Sachs and Warner’s results “are not robust to changes in the measure of natural-resource abundance from trade-flows to reserves or production” (Stijns, 2005).
It is unclear, furthermore, why the “curse” should have emerged only after World War II. Resource curse theorists suggest shipping costs were too high prior to 1950, making it difficult for resource-poor countries to industrialize. The most significant reductions in international transport costs, however, took place not in the 20th century but between 1850 and 1900. In fact, despite major postwar
inno-vations such as containerization, ocean freight costs remained fairly stable relative to commodity prices after 1950, and in some cases appear to have increased (Fin-dlay and o’Rourke, 2007, pp. 504-505; Hummels, 2007).
after World War II had less to do with transport innovations benefitting all resour-ce-poor countries alike than with specific policies (such as public investments in shipping and port infrastructure) and unique geopolitical circumstances permitting these countries to overcome their dependence on imported fuels and minerals.
Missing from the resource curse literature is adequate recognition of the im-portance of access to natural resources (located on domestic soil or abroad) during processes of economic growth. As was well understood in the first half of the 20th
century, transport innovations can only improve the development prospects of re-source-poor countries if the resource-rich or “have” countries are willing to sell their raw materials to the “have-nots”. ocean freight costs in the 1930s, for exam-ple, were in real terms about as low as they have ever been, yet this did not impede Germany and Japan from embarking on aggressive military campaigns abroad in order to gain control over raw materials supplies. Their desire to obtain colonies was rooted in a fundamental weakness relative to the Allied countries: lack of access to energy and mineral reserves. 75% of the world’s mineral supplies in 1930 were under British Empire or US control, a situation the Axis powers likened — in times of war and peace — to a noose around their necks, subjecting them to export con-trols and balance of payments problems, particularly after world depression set in (Eckes, 1979, pp. 62, 75; Schacht, 1937).
The problem of raw materials access for these countries, including atomic minerals, virtually disappeared after World War II, but only because the US assumed the role of guarantor, offering its European and East Asian allies financial, diplo-matic, and military support needed to obtain the raw materials vital to their reco-very and development (Bunker and Ciccantell, 2007).
As the modern Russian strategy on energy shows, raw materials access has never ceased to be a major issue in economic development, though this may be less obvious today than in the 1930s. As discussed in the sections below, access remains all the more important in resource industries such as rare earths where production is highly concentrated, making importers vulnerable to supply disruptions and offering producers potential advantages, such as stable supplies and lower input costs for downstream manufacturers.
Access to resources alone, of course, is no guarantee of industrial power. As demonstrated by the history of several of today’s advanced economies, developing higher-value added manufacturing sectors requires aggressive state policies discou-raging specialization in primary exports and promoting advanced manufacturing. The international context, furthermore, can be decisive, frustrating attempts by resource-rich developing countries to promote high-tech sectors.
discovering that Brazil had purchased experimental centrifuges from West Germany, they embargoed shipment of the machinery. US control of atomic minerals all over the world combined with internal political conflicts delayed progress in Brazil’s nuclear energy sector by several decades, and the country remained a mineral ex-porter in this area (Patti, 2012; Pereira, 2013).
Present-day China offers an interesting perspective on the observations above. Though a developing country, China shares features in common with large indus-trializers of the past: it is both the world’s largest manufacturing nation and the dominant producer of a wide-range of strategic minerals. China is the leading global producer of 22 out of 41 element groups featured on a British Geological Survey “risk list” of raw materials vital to modern industry1. Deloitte’s (2013)
Global Manufacturing Competitiveness Index emphasizes China’s “robust raw ma-terials supply base” and highlights as one of the country’s main advantages the “Ease of raw material availability and coal-based production [which] have lowered
input costs”.
Rapid economic growth, however, has made China increasingly dependent on imports of oil and iron ore. In addition, China’s dependence on coal-fired electri-city has caused extreme levels of pollution in the country’s cities. These develop-ments have forced raw materials concerns onto Chinese planners, who have res-ponded by acquiring mineral reserves abroad and investing in cleaner energy technologies. “Within the framework of its energy development plan issued in Ja-nuary 2013”, a recent United Nations study notes, “China aims to reduce Co2
emissions and to Green its economy” through investments in renewable energy technologies (UNCTAD, 2014).
Apart from its atomic raw materials sector fully integrated with its energy and military sectors, China resembles Brazil and other underdeveloped countries in the early postwar period in that it possesses important reserves of strategic minerals and its technological modernization drive collides in several aspects with the main interests of the advanced powers. In the case of rare earths, as revealed by ongoing disputes within the World Trade organization (Roskill, 2014), these latter interes-ts are strongly based on a classical “core-periphery” international division of labor in which China supplies raw materials to Western high-tech industry. Since the mid-1980s, China’s strategy for the rare earths industry has focused on altering this traditional division of labor.
China has ample supplies of the natural resources needed to pursue its tech-nological goals. Lifton (2010) observes that China “is gifted with the world’s largest reliable supplies of technology metals, some of which are critical to the green revo-lution…”. These metals, in fact, are vital to all sectors of modern technology. Fo-remost among these are the rare earth elements (REEs), with which China is par-ticularly well-endowed, possessing anywhere from 23% to 55% of world reserves (UNCTAD, 2014, p. 5).
RARE EARTHS IN MoDERN TECHNoLoGIES
Though often lumped together as a single mineral resource like copper or gold, the term “rare earths” refers to 17 different metallic elements on the periodic table. REEs are generally divided into two subgroups according to the size of their atomic numbers. The “light” REEs are those with atomic numbers 21 and 57-63 (scandium, lanthanum, cerium, praseodymium, prometheum, neodymium, europium, and sa-marium), the “heavy” REEs those with atomic numbers 39 (yttrium) and 64-71 (UNCTAD, 2014). Heavy REEs, costlier to produce and harder to find in economi-cally viable concentrations, are used almost exclusively in high-tech products: dys-prosium in Predator drones, erbium in fiber optics, ytrrium in avionics, and gadoli-nium in magnetic resonance imaging (Hurst, 2010, p. 3). Light REEs are critical high-tech inputs as well, but they have less exotic applications like glass polishing.
Rare earths provide magnetism, luminescence, and strength (resistance to extre-me temperatures) to manufactured products. Magnetism is a particularly valuable feature, making most of today’s miniaturized electronics possible. Without rare ear-ths, “laptop computers would be about 50% bigger in size and weigh twice as much [...] the automotive industry would have to return to heavier and bulkier electric motors, and as a result, reduce the mileage one gets from a gallon” of gasoline” (Gs-chneider, 2011). of 28 elements defined by specialists as “technology metals” on which advanced economies “have become totally dependent”, 10 are rare earths2.
Industrial consumption of rare earths increased substantially after 1980 with the spread of consumer electronics. Today, demand comes mostly from eight market sectors (Fourth section) supplying magnets, phosphors and other intermediate pro-ducts to other industries. Until the late 2000s, the glass and oil catalyst sectors were the largest consumers of REEs. They have been surpassed by permanent mag-nets (or rare earth magmag-nets), now accounting for over 20% of world demand (Kingsnorth, 2012).
Permanent magnets are metal alloys generating powerful magnetic fields wi-thout the use of an external energy source. Neodymium-iron-boron (NdFeB) mag-nets are the most popular rare earth magmag-nets in use today, though samarium-cobalt (SmCo) magnets were the first to be introduced commercially and remain vital components of weapons systems and high-performance aircraft. The trend toward increasing importance of magnets as a source of REE demand should continue, given their role in electronics and renewable energy technologies (Hurst, 2010; Humphries, 2013).
The rare earth sector is small compared to other resource industries. The value of world rare earth oxide (REo) production in 2012 was roughly US$ 5.6 billion, less than 2% of the value of world trade in iron ore3. one reason for this is that
China, despite having a near monopoly on production, has thus far been willing to
2Technology Metals Research, <http://www.techmetalsresearch.com/what-are-technology-metals/>.
supply REos at very low cost to the rest of the world. Former Chinese premier Wen Jiabao observed that China has sold REEs “at the price of salt [while] they deserve the price of gold” (Hayes-Labruto et al., p. 61). Another reason is that most appli-cations require very small amounts of REEs: a smartphone, for example, contains only a gram or so of rare earths.
Nonetheless, rare earths are “critical raw materials” (Grieger, 2013) because they are difficult to replace and production is highly concentrated in a single coun-try. Yale University researchers identified rare earths as part of a group of 62 metals for which “the potential substitutes...are either inadequate or appear not to exist at all” (Graedel et al., 2013). The study identified lanthanum, thulium, ytterbium, yttrium, europium and dysprosium as metals “with low to very low substitute performance”. Cerium, neodymium and terbium are easier to replace but even in these cases substitution is problematic: “For the rare earths and platinum group metals [...] the best substitute is generally a metal from the same group, thus posing the same supply risk as the target metal” (p. 4).
Green technologies, furthermore, increasingly important as substitutes for fos-sil fuels, require relatively large quantities of REEs. Wind turbines contain up to 2 tons of rare earths. While a conventional Ford sedan requires around half a kilo-gram of rare earths, Ford’s hybrid cars use anywhere from 1-4.5 kg4. Toyota’s Prius
uses 1 kg of neodymium and 100-200g of dysprosium (Jepson, 2012, p. 10).
Though alternatives exist5, renewable energy and defense
technolo-gies today are dependent on rare earths and will likely remain so in the future, making REE supplies a question of national security for the US and the EU. “The United States deines rare earth as critical for its eco-nomy as well as its national defence [...] Neodymium, Europium, Ter-bium, Yttrium and Dysprosium are highlighted by the US Department of Energy as particularly critical for green energy production” (UNCTAD, 2014, p. 32). REEs are among a group of 14 raw materials singled out by the European Parliament as resources “of high economic signiicance for EU industry” and “vital to numerous high-tech applications and the development of green technologies” (Grieger, 2013).
Relatively abundant on the Earth’s surface, rare earths are hard to find in concentrations large enough to justify commercially the cost of building rare earth mining and processing facilities. Mineral ores often contain several different REEs and separating them from one another is challenging. The mining stage, in fact, accounts for a small part of the production cost of REos, typically 10%-15% of
4See Ford Motor Company website: <http://corporate.ford.com/microsites/sustainability-report-2012-13/ supply-materials-elements>.
capital expenditures. “All the rest of it is a very complex chemical process”, requi-ring large amounts of acid and energy as well as advanced scientific knowledge and technical skill (Thompson, 2013).
These difficulties increase costs and lead times for start-ups. After a mining site has been located, it can take five to ten years for operations to get underway (Humphries, 2013, p. 13). Rare earths, furthermore, are not traded or quoted on international commodity exchanges, and the “oligopolistic nature of its market” (UNCTAD, 2014) increases uncertainty for importers with regard to future prices and supplies. This helps explain the aggressive reaction to China’s imposition of lower rare earth export quotas in 2010 (Hurst, 2010; oster, 2010). China’s domi-nance of the supply chain, combined with the heavy fixed costs of rare earth pro-cessing, meant Western industries had no short or medium-term alternative to Chinese production.
CHINA’S UPSTREAM EMERGENCE
Like other minerals industries, the rare earth industry is divided into “ups-tream” and “downs“ups-tream” sectors. Upstream activity begins when rare earth ores are dug out of the ground and milled into fine particles. Rare earth-containing minerals are then extracted from the particles using separation techniques like floatation, producing rare earth concentrates. The concentrates, usually containing different types of rare earth elements, are then separated into individual rare earth oxides. The oxides are then either sold to downstream consumers (like satellite manufacturers) or refined into metals with varying degrees of purity, ranging be-tween 60% to almost 100%, depending on end-user needs.
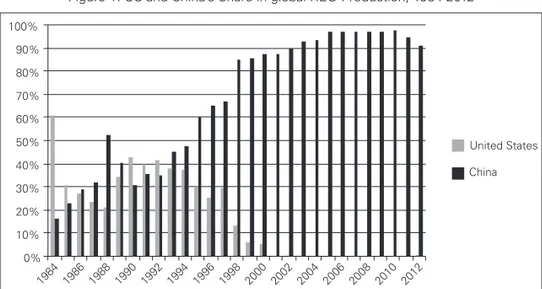
In 1980, mining activity was concentrated in the US, Brazil, India, Australia, and South Africa, with the US accounting for over 60% of world output. only the US had an integrated supply chain, producing rare earth ores, oxides, metals, mag-nets and other downstream products. The other rare earth producers exported low-value added ores and concentrates to Japan and Western Europe. Writing in the early 1990s, one expert noted that “the major value-adding process of separa-tion into pure oxides and metals is still done in true first world countries”, and suggested there was “little prospect” of underdeveloped countries competing in the production of higher value-added rare earth products (Cornell, 1993, p. 2462).
Figure 1: US and China’s Share in global REO Production, 1984-2012
0% 10% 20% 30% 40% 50% 60% 70% 80% 90% 100%
1984 1986 1988 1990 1992 1994 1996 1998 2000 2002 2004 2006 2008 2010 2012
United States
China
Source: United States Geological Survey (USGS), USGS Minerals Yearbook, http://minerals.usgs.gov/ minerals/pubs/historical-statistics/#rareearths.
Rare earth production in China is concentrated in Shandong and Inner Mon-golia in the north, Sichuan in the west, and Jiangxi, Guangdong, Fujian, Hunan, and Guangxi in the south. The south, where private, often illegal mining outfits still operate, contains around 80% of the world’s heavy rare earth reserves. Des-pite the prevalence of private miners, the central government worked aggressively in the 2000s to consolidate production in the hands of state-owned companies. As a result, six state-owned firms now produce around 85% of China’s rare earth output. The Bayan obo mine in Inner Mongolia, operated by state-owned Baotou Iron and Steel, is by far the world’s largest, accounting for over half of China’s total output (Yap, 2014).
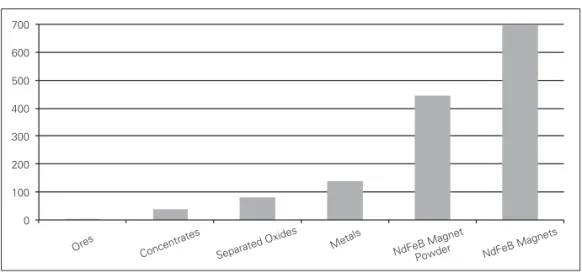
Though China broke what had been a Western monopoly in the production of rare earth oxides and metals, by the mid-1990s these upstream products had beco-me relatively minor stages in the rare earth supply chain (Figure 2). Blabeco-me for this lies partly with China’s fiercely competitive processing industry, which drove down world REo prices. Another factor was the discovery of many new high-tech appli-cations for rare earths, which raised the value of downstream products relative to oxides and metals.
Figure 2: Value Along the REE Supply Chain (US$/kilogram)
0 100 200 300 400 500 600 700
Ores Concentrates
Separated Oxides Metals NdFeB Magnet Powder NdFeB Magnets
Source: Hayes-Labruto, et. al. 2013, p. 61; UNCTAD 2014, p. 30.
This was essentially the arrangement up to 2000, with China exporting most of its REE output to more developed countries. As UNCTAD (2014, p. 12) notes, “cheap REE exports from China [...] allowed companies in the US, Europe and Japan notably, to invest in Research and Development and develop new technolo-gies as well as to produce more advanced final goods at a more competitive cost”. Rapid industrialization, particularly in electronics and alternative energy, disrupted this classic vertical division of labor as guaranteeing supplies for domestic industry became China’s main priority.
THE DoWNSTREAM TRANSITIoN
Downstream firms in China have made extraordinary progress since the mid -1990s. Industrial consumption of rare earth oxides (REos) increased 13% annually
between 1990 and 2009 (Tu, 2010), far higher than in Japan and the US, the wor-ld’s largest rare earth consumers in the 1990s. As a result, China currently “domi-nates all immediate [rare earth] downstream industries in terms of quantity” (Wübbeke, 2013, pp. 384-385). The most dramatic changes took place in the mag-net industry: in 1998, the US and Japan were responsible for 70%-80% of world output. From 1998 to 2007, magnet production in China grew at an annual rate of 30%, with NdFeB magnet capacity increasing from 2,600t in 1996 to over 80,000t in 2007 (Hurst 2010). By 2010, China was responsible for 75%-80% of world NdFeB magnet production and 60% of SmCo magnet output (Humphries, 2013, p. 14).
producers of chemicals, satellite systems, and weapons and delivery systems (Goo-nan, 2011).
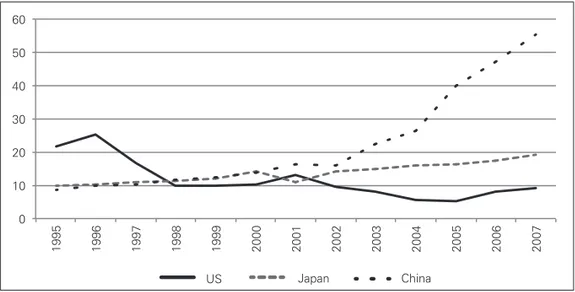
Du and Graedel (2013) estimate the evolution of downstream demand for REEs in China, the US and Japan (together responsible for 90%-95% of world demand) between 1995 and 2007. China’s share of REE consumption, the authors find, increased from 21% to 66% in the period. The increase was particularly sharp after 2002 (Figure 3). “The most dramatic changes in recent REE use occurred in China [where] the uses of REE in emerging technologies have grown substantially since 2002...” (p. 783).
Figure 3: Industrial Consumption (Gigagrams) of Rare Earths in China, the US and Japan, 1995-2007
0 10 20 30 40 50 60
1995 1996 1997 1998 1999 2000 2001 2002 2003 2004 2005 2006 2007
US Japan China
Source: Du and Graedel (2013).
other estimates are compatible with Du and Graedel’s results. UNCTAD 2014 estimates China’s share of world REE demand increased from 21% in 2000 to 64% in 2012 (p. 20). Kingsnorth (2012) estimates China accounted for 68% of world REo consumption in 2011, its share of world demand being over 50% in all major downstream sectors except ceramics.
STATE PoLICIES IN CHINESE PRoGRESS ALoNG THE RARE EARTH VALUE CHAIN
Supply-side Initiatives: R&D and Technological Upgrading
chemical concentrates in the 1980s, moving further up the value chain in the early 1990s exporting separated rare earth oxides and metals. In the late 1990s, Chinese firms began exporting permanent magnets, phosphors and polishing powders, and in the 2000s moved into electric motors, cell phones, computers, batteries, and li-quid-crystal displays.
Public investments in rare earth-related technologies and R&D were decisive in each of these stages. “China’s dominance in the RE supply chain”, one specialist noted, “is directly related to Beijing’s consistent and long term planning, which dates back to as early as the 1950s” (Tu, 2010). The country’s impressive collection of rare earth research laboratories “seems to be unique to China”, another study remarked, “with no other similar parallels anywhere else in the world” (Mancheri, et al., 2013). Former President Jiang Zemin summed up China’s rare earth policy in 1999: “Improve the developments and applications of Rare Earths and change resource advantage into economic superiority” (Hurst, 2010, p. 11).
The Baotou Research Institute of Rare Earths (BRIRE), run by Baotou Iron and Steel, was established in 1963 and is the largest rare earth R&D institution in the world. Current research focuses on metallurgy and new rare earth performan-ce materials, among other areas6. Several other large research laboratories —
fun-ded by the central government — are devoted to rare earth science and industrial applications. Examples are the State Key Laboratory of Rare Earth Chemistry and Physics, under the direction of the Chinese Academy of Sciences, and the State Key Laboratory of Rare Earth Materials Chemistry and Applications, associated with Beijing University’s College of Molecular Engineering. The General Research Ins-titute for Nonferrous Metals (GRINM) is another important center of rare earth research and a sponsor of spin-off companies like GRIREM Advanced Materials, specializing in rare earth industrial applications.
Wübekke (2013) observes that China’s rare earth mining and processing in-dustry was “backward” in the 1970s and could not even satisfy Chinese demands for flints, a crude alloy of REEs used in cigarette lighters. Innovations in separating REEs from mineral ores changed this situation and “enabled Chinese separation plants to achieve high-quality production capacity of 10,000 [metric tons] in the early 1980s” (p. 385). Tu (2010) calls attention to the sharp rise in REo production between 1978 and 1986, when annual production increased from around 1,000 metric tons (1,000t) to 11,860t.
China continued to invest “heavily in the complex technologies of rare earth refining and processing” in the 1990s, “discovering far cheaper processes that used hydrochloric instead of nitric acid and refining extraction to 99.999% purity — better by several percentage points than in America” (Foster, 2011). These advances — along with the elimination of rare earth processing capacity abroad — thrust
China into a position of technological leadership in the rare earth upstream. China, one report noted, “has almost exclusive patent ownership of those processes”
ployed in the separation of rare earth oxides and metals, “which have been much improved in the intervening 20 years” (Johnson, 2010). Pioneering rare earth che-mist xu Guangxian offered a sense of China’s competitive advantage upstream when he observed in 2010 that “production costs by overseas [REo] producers are 400 percent higher than China’s REo export prices” (Tu, 2010, p. 4).
State funds allocated to rare earths research increased substantially after the mid-1980s. Program 863, China’s foremost national technology project, was laun-ched in 1986 at the behest of weapons scientists emphasizing the need to develop advanced “dual-use” technologies with both military and civilian applications. A declassified US government report from 1999 expressed alarm at the program’s focus on rare earths and other “exotic materials” which “could advance the PRC’s development of materials, such as composites, for military aircraft and other wea-pons” (Cox Report, 1999).
China’s post-1980 modernization drive had an immediate effect on the rare earths industry by promoting a “shift in focus” from raw materials exports “towards an increased emphasis on Value Added products” (Mancheri et al., 2013, p. 20) A key objective of 863 is to generate “‘leapfrog’ development in key high-tech fields in which China enjoys relative advantages” to “fulfill strategic objectives in the implementation of [...] China’s modernization process”7.
Hurst (2010) notes the obvious relevance of such a policy to the rare earth industry: “Rare earth elements are an important strategic resource in which China has a considerable7 advantage due to the massive reserves in the country.”
Conse-quently, “a great deal of money has gone toward researching rare earths”; rare earths are crucial inputs “in each one of the areas in which Program 863 focuses on” (Hurst, 2010, pp. 6-7).
863, 973, and other high-technology projects support ongoing research at the Baotou Research Institute of Rare Earths (BRIRE), run by Baotou Iron and Steel. Though China “was late to join the race to develop novel rare earth materials... Western observers agree that China is catching up fast in areas such as fuel cells
and magnetic refrigeration, thanks in part to research efforts now happening here at BRIRE” (Stone 2009). An important area of research concerns hybrid and elec-tric vehicle technology. In 2008, BRIRE scientists filed international patents for a lanthanum-iron-boron alloy that was the “[rare earth] alloy with the highest cur-rent-discharge capacity”, discharging “twice as much electricity” as nickel-metal -hydride (NiMh) batteries, the patents for which are controlled by Western firms. Rare earth policies included the strategic acquisition of foreign technology. In 1995, two state-owned firms with close ties to Deng xiaoping purchased Magne-quench, a General Motors subsidiary that invented NdFeB magnets in the mid -1980s as a substitute for older samarium-based magnets. Control of Magnequench
was soon transferred to China Minmetals Corporation, a state-owned minerals and
metals producer. The deal allowed the Chinese to “bridge gaps in technology as well as to acquire a strong dominant position” in the global permanent magnet industry (Mancheri et al., 2013, p. 27).
Demand-Side Policies: the Green Technology Boom
Rapid demand growth for rare earth oxides, metals, and downstream produc-ts in China (Fourth Section) was largely a consequence of state technological ini-tiatives in electronics and green energy, two large industrial consumers of REEs and arguably the most important in terms of future demand. For reasons of space, we focus on the latter sector.
Driven by security-related concerns after the mid-1980s, government techno-logy policy focused increasingly on clean energy in the 2000s. This was sparked by the need to reduce dependence on coal-fired power plants as well as by a desire to create advantages for Chinese firms in new high-tech industries. The State Council’s
National Medium-to-Long Term Plan for Science and Technology Development,
published in the mid-2000s, argued China must “Strive for breakthroughs in re-newable energy, including wind energy, solar energy, and biomass energy”. New energy sources and energy conservation comprise three of seven “strategic emerging industries” highlighted in the Communist Party’s 12th Five-Year Plan (2011-2015),
in which the goal is to “enhance ability for industrial innovation” and improve “China’s status in the international division of labor”.
Rare earths play an important role in this technological drive. New materials, in fact, among which rare earths figure prominently, constitute a fourth “strategic emerging” industry in the most recent Five-Year Plan. The State Council (State Council, 2012) emphasizes the importance of building “high-tech rare earth appli-cation industries with high added value” and encouraging “the appliappli-cation of rare earth materials in the fields of information, new energy, energy conservation, envi-ronmental protection and health care”.
From 2007 to 2010, China became “the world’s largest investor in renewable energy projects”, spending an estimated $120-160 billion (E.C. Harris, 2010). “Chi-na has embarked on the greatest push for renewable energy the world has ever seen”, the BBC reported (Shukman, 2014). Installed wind power capacity in China increased from 1.2 gigawatts (GW) in 2005 to over 91 GW in 2013, making it the world leader in this category. “The Chinese government has also set a new ambi-tious target of 200 GW by 2020 and if the past is any indication, the target will certainly be achieved, and likely exceeded” (GWEC, 2013, p. 45).
Investments in solar energy have been equally impressive, and China is now the world’s largest producer of solar cells (osnos 2009). The China Development Bank is a key funder of solar power in China, lending almost US$ 50 billion after 2010 to solar photovoltaic cell manufacturers to finance expansion (Mazzucato, 2014).
in 2000”, has “surged past Japan, Germany, and the U.S., and now dominates the global market” (oremus, 2014). As recently as 2005, domestic wind turbine ma-nufacturers produced only 28% of turbines sold in China. By 2010, Chinese firms controlled 90% of the domestic market, leaving only 5% for large Western produ-cers like Vestas, GE, and Siemens (Bloomberg, 2014).
Access to abundant, low-cost REE supplies benefits China’s wind turbine ma-nufacturers. of several wind turbine technologies now in use, permanent magnet, direct-drive generators (suitable for large offshore projects) are the ones most re-liant on REEs, and it is precisely this segment in which Chinese manufacturers excel. Roughly half of China’s wind power installations use direct-drive generators, compared to 5%-10% in other countries (Constantinides, 2012). Germany’s Ener-con, one report notes, was “the long-time market leader in direct-drive turbines” but “lost its lead on an annual basis in 2010” to Goldwind, with xEMC Darwind, another Chinese manufacturer, not far behind. While Chinese manufacturers “com-prised just 3 percent of the global market for direct-drive turbines in 2008”, the report continues, “they accounted for more than 50 percent in 2010” (Wickless, 2011).
Domestic resources have also supported the development of Chinese solar power technology. In addition to rare earths, solar cells rely heavily on indium, gallium and tellurium. China is by far the world’s largest producer of indium and one of the largest if not the largest producer of gallium and tellurium8. Lifton
(2010) observes: “Those who want to invest in green technologies need to take note. China now dominates the production and use of the specialized technology metals critical for solar”.
Chinese firms have made progress in the production of electric vehicles (EVs) and energy-efficient lighting products. Though the electric car market has not grown as rapidly as hoped, the central government’s goal is to have five million electric cars on the road by 2020, an ambitious target equivalent to about 25 times the world’s electric car fleet at the end of 2013 (IEA, 2013, p. 6). China is already the world’s largest market for electric bicycles, with roughly 28 million units sold in 20139. In the late 1990s, annual electric bicycle sales numbered only in the tens
of thousands (Graber, 2013).
These and other “anticipated changes in both the energy and the transporta-tion sectors”, UNCTAD (2014) notes, “are expected to contribute to the expan-sion of Chinese demand of REEs in the future” (p. 21). Most EV and hybrid EV motors use rare earth permanent magnets, giving China a competitive edge. “In developing the new energy vehicles”, Fei (2012) notes, “China has four
advanta-8See Lifton (2010) and USGS minerals data, http://minerals.usgs.gov/minerals/pubs/commodity/indium/ mcs-2014-indiu.pdf.
ges [...]: local technology breakthrough achievements, low manufacturing cost for such key components as batteries, and a secure supply of lithium and rare earth resources” (p. 130).
In the mid-1990s, central authorities started using public procurement policy and subsidies to stimulate production of compact fluorescent lamps (CFLs), of which rare earth phosphors represent a large percentage of final cost. As a result, CFL production in China increased by a factor of 30 between 1996 and 2007, and Chinese firms now account for over 80% of global output. Chinese exports of CFLs increased from 58 million units in 1996 to 1.7 billion units in 2006 (Shuming et al., 2010, p. 16; Branigan, 2011; McKeown and Swire, 2008)
Export controls and regulatory policies
Rare earths have since 1990 constituted an “officially protected and strategic sector in China” with a complete ban on foreign investment in rare earth mining (Jepson, 2012, p. 15). Foreign companies are allowed to invest in rare earth sepa-ration, smelting, and processing, but only in the form of joint-ventures (JVs) with Chinese firms approved by the National Development and Reform Commission (NDRC) and the Ministry of Commerce (MoFCoM).
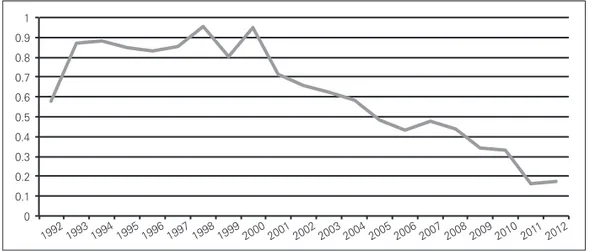
Export controls, designed to attract foreign investment and conserve resources for domestic industry, date from the early 2000s. Regulators began reducing the export rebate in 2000, eliminating it entirely in 2005 (Jing, 2011). They then cut the export quota from 65,609 metric tons (t) in 2005 to 30,184t in 2011 (Kings-north, 2012, p. 14), banned exports of rare earth concentrates in 2005, and impo-sed export duties in 2007. Initially set at 10%, export tax rates on oxides and metals rose to 15%-25% in 2012. The export regime for 2011 included a 25% tax on ferroalloys containing more than 10% of REEs. Authorities also reduced export licenses. In 2006, the central government issued export licenses for 47 Chinese domestic and 12 foreign-invested joint-venture rare earth companies. These fell to 22 domestic and 10 venture licenses in 2010 and to 22 domestic and 9 joint-venture licenses in 2011 (Morrison and Tang, 2012, p. 16).
These measures led to a sharp fall in REo exports in both absolute terms and as a percentage of total output (Figure 4). Though maintaining export quotas in 2012 at roughly the same level as the previous year, regulators for the first time distinguished between light rare earths and the more valuable heavy rare earths; light rare earths accounted for 87% of the quota.
Export controls provide a powerful incentive to relocate to China, as local firms benefit from lower costs and, more importantly, stable access to raw materials. Roskill (2014) notes that in April 2014 REo prices for domestic firms in China were on average 36% lower than the FoB price for REo exports. “Companies like Showa Denko and Santoku of Japan and Intematix of the United States”, the New
York Times reported in 2011, “are adding factory capacity in China this year instead
light-emi-tting diodes (LED), based its decision “not on costs but on reliable access to rare earths, without worrying about quotas or export taxes” (Bradsher, 2011).
Relocation to China in search of access to REEs appears to have been intense over the 2000s. Lamenting General Electric’s decision to relocate a US medical imaging equipment facility to China, one expert observed: “over the last decade nearly every major multinational relying on REE’s has moved its manufacturing facilities, established subsidiaries and suppliers in China to gain access to these materials...” (Kennedy, 2014). other examples of companies setting up shop in China in part to guarantee access to REEs include Germany’s osram (fluorescent bulbs) and Vakuumschmelze (permanent magnets) and Japan’s ACG Seimi Chemi-cal (Wübekke, 2013).
Japanese magnet makers are a particularly valuable target of Chinese export policies. As discussed in the Conclusion below, though Chinese firms dominate the magnet industry in terms of volume, Japanese firms produce or control patents for the most advanced magnets, like those used in hybrid cars and fighter jets. By luring Japanese firms to China, particularly in the form of joint ventures with local firms,
export controls may help China chip away at Japan’s technological edge.
These observations explain recent Japanese government efforts to impede mag-net firms from investing in China, efforts that were redoubled in 2010 after a ter-ritorial dispute with China over islands in the East China Sea. The conflict coinci-ded with an abrupt halt in rare earth exports to Japan, leading to accusations that China was using its control over REE supplies as a geopolitical weapon. The inci-dent had a powerful effect on the strategies of Japanese magnet firms, who quickly expressed interest in moving production facilities to China. Japanese authorities blocked this option. The high-performance magnet producer TDK “had considered building a neodymium factory in China with Showa Denko in 2012, but Japan’s Ministry of Economy, Trade and Industry pointed out the possibility of technology leaks, forcing a change of plans” (Nikkei, 2014).
Figure 4: Chinese REO Exports / REO Production, 1992-2011
0 0.1 0.2 0.3 0.4 0.5 0.6 0.7 0.8 0.9 1
1992 1993 1994 1995 1996 1997 1998 1999 2000 2001 2002 2003 2004 2005 2006 2007 2008 2009 2010 2011 2012
TDK overcame government resistance in 2013, announcing, a company press release informed, its decision to set up a “joint venture in China to ensure an even more stable supply of rare-earth materials [...] with the view to strengthening its business”10. In partnership with a Chinese firm, TDK plans to mass-produce high
-performance magnets for hybrid vehicles in China by 2015. “The performance and price of hybrids”, Nikkei’s Asian Review reported on June 6, 2014, “depends on high-performance magnets, and the rare earth metals used to make them [...] are disproportionately found in China. Using alloys with locally produced dysprosium will ensure a steady supply” (Nikkei, 2014).
CoNCLUSIoN
The evolution of China’s rare earth industry since the 1970s demonstrates that domestic supplies of raw materials can still play an important role in industrial development. State policies generated systematic technical progress in rare earth refining and downstream manufacturing, allowing Chinese firms to compete in markets that only 10 to 15 years ago were off limits to companies outside Japan and the West. Though this paper focused on rare earths, similar examples can perhaps be found with regard to Chinese production of lithium, indium, uranium and other resources vital to modern technologies.
Policymakers stimulated the development of China’s rare earth industry in three basicways. First, they adopted a long-run technological strategy involving public investments in rare earth processing and industrial applications. This allowed Chinese firms, from a position of significant backwardness, to dominate the world market for rare earth oxides and metals and catch up quickly in the production of magnets, phosphors, and other downstream goods. Second, state policies stimulated demand for rare earth downstream products within China itself by tying rare earths policy to broader technological goals in strategic indus-tries like electronics and clean energy. Third, officials used export controls and other regulatory policies to promote higher-value added production and attract foreign investment.
These policies transformed China from a low-cost exporter of REos into a huge consumer of these materials. As in most branches of advanced industry, howe-ver, downstream manufacturers in China still lag behind Japanese and Western firms in high-end markets. A Chinese consulting firm notes that while local produ-cers accounted for 76% of the growth of world sintered NdFeB output between 2002 and 2008, they accounted for only “58% of the global total output value of NdFeB permanent magnet materials”. Japanese producers, on the other hand, whi-le producing 21% of the output volume of NdFeB magnets, earned almost 40% of
global output value11. A similar situation prevails in segments of the phosphors
industry, where Chinese firms dominate manufacturing but US firms control the intellectual property rights (US DoE, 2011, p. 28). The patent situation, a Chinese source reports, “reflects the grim reality of application of rare earth industry facing China: most of the core technology patents of various types of rare earth materials” are controlled by foreign companies12.
The challenge for Chinese firms is to break into higher-end markets in electro-nics, green energy, defense and other strategic sectors, where patents are not entirely under Western control and technological standards are still evolving. In some cases this may already have happened, as evidenced by Chinese progress in high-speed computing and solar panels, as well as segments of the wind power market, where China’s control over REE supplies give its corporations advantages over Western producers. Further progress will depend on technological trends in China and, more importantly, the rest of the world. Just as the PRC harnesses its raw materials base to promote technical advance in strategic sectors, wealthy countries have responded by seeking non-Chinese sources of REEs and investing in technologies less reliant on rare earths (US DoE, pp. 2011, p. 19-21).
The outcome of this struggle will be decided over the next several years and decades. What seems clear, however, is that China is following a classic development strategy pioneered by other large industrial powers. Rather than content itself with natural resource exports, China uses its leverage over strategic raw materials as a source of geopolitical power and as a means of gaining competitive advantages in higher-value added industries.
REFERENCES
Auty, R. (1998) Resource-Abundance and Economic Development: Improving the Performance of Resource-Rich Countries, Helsinki: United Nations World Institute for Development Economics Research (UN/WIDER).
Bloomberg. (2014) “China’s Wind Turbine Makers Face Market Consolidation”, Bloomberg News, April 18.
Bowlus, W.B. (2010) Iron Ore Transport on the Great Lakes: The Development of a Delivery System to Feed American Industry. Jefferson, North Carolina and London: Macfarland.
Bradsher, K (2011).“Chasing rare earths, foreign companies expand in China”, New York Times, Au-gust 24.
Branigan, T. (2011) “China to phase out incandescent lightbulbs”, The Guardian, Nov. 4.
Bunker, S. & Ciccantell, P. (2007) East Asia and the Global Economy: Japan’s Ascent with Implications for China’s Future. Baltimore: Johns Hopkins University Press.
Brooks, D.H. (2007) “Infrastructure’s role in lowering Asia’s trade costs”. In Infrastructure’s Role in
Lowering Asia’s Trade Costs: Building for Trade, edited by D. H. Brooks and D. Hummels, Asian Development Bank; London and Massachusetts: Edward Elgar.
Chang, H. (2002) Kicking Away the Ladder: Development Strategy in Historical Perspective. London: Anthem Press.
Constantinides, S. (2012) “The demand for rare earth materials in permanent magnets”, Arnold Mag-netic Technologies Technical Papers and Presentations, http://www.arnoldmagMag-netics.com/Techni- http://www.arnoldmagnetics.com/Techni-cal_Papers_and_Presentations.aspx.
Cornell, D.H. (1993) Rare earths from supernova to superconductor, Pure and Applied Chemistry, 65, 12: 2453-2464.
Cox Report (submitted to the US House of Representatives by Representative Christopher Cox). US National Security and Military/Commercial Relations with the People’s Republic of China. Washington: US Government Printing ofice, 1999.
Deane, P. (1980) The First Industrial Revolution. Cambridge: Cambridge University Press. Deloitte Touche Tohmatsu Limited(2013). Global Manufacturing Competitiveness Index.
EC Harris Built Asset Consultancy (2010). “Research shows the UK lags behind in the global race for energy investment”, Energy and Manufacturing Autumn 2010, http://www.echarris.com, acces-sed october 8, 2014.
Eckes, A. (1979) The United States and the Global Struggle for Minerals. Austin and London: Univer-sity of Texas Press.
Fei, H. (2012) “China’s Policy Direction on Industrial Upgrading and Its Impacts on the World Econo-my”. In China: World Economy and Korea-China Economic Cooperation, edited by Chae, W. and Yang, P.S., Seoul: Korea Institute for International Economic Policy.
Findlay, R., o’Rourke, K.H. (2007) Power and Plenty: Trade, War, and the World Economy in the Second Millenium. Princeton and oxford: Princeton University Press.
Foster, P. (2011) “Rare earths: why China is cutting exports crucial to Western technologies”, Daily Telegraph, March 19.
Global Wind Energy Council – GWEC (2013) Global Wind Report: Annual Market Update 2013
available at http://www.gwec.net/.
Government Accountability ofice – GAo (2010), Rare Earth Materials in the Defense Supply Chain, report to the Committees on Armed Services of the Senate and House of Representatives, submit-ted April 14, 2010.
Goodrich, C. (1961) Government Promotion of American Canals and Railroads. New York: Columbia University Press.
Goodrich, C. (1970) “Internal Improvements Reconsidered”, The Journal of Economic History, 30, 2: 289-311.
Goonan, T.G. (2011) “Rare earth elements—end use and recyclability”, United States Geological Sur-vey (USGS), Scientiic Investigations Report 2011-5094.
Graber, H. (2013) “China’s electric bicycle boom: will the fashion last?” China Dialogue, published online, https://www.chinadialogue.net, Sept. 25.
Graedel, T.E., Harper, E.M., Nassar, N.T., Peck, B.K. (2013) “on the materials basis of modern society,
Proceedings of the National Academy of Sciences of the United States of America (PNAS), publi-shed ahead of print Dec. 2, 2013.
Grieger, G. “Trade in critical raw materials (CRMs): main challenges”, Library Brieing of the Europe-an Parliament, published Sept. 2, 2013.
Gschneider, K.A. (2011) “The Rare Earth Crisis—The Supply/Demand Situation for 2010–2015”, Ma-terial Matters, 6, 2: 32-37.
Hayes-Labruto, L., Schillebeeckx, S.J.D., Wordkman, M., Shah., N. (2013) “Contrasting perspectives on China’s rare earths policies: Reframing the debate through a stake holder lens”, Energy Policy, 63: 55-68.
Humphries, M. (2013) Rare Earth Elements: The Global Supply Chain. Washington: Congressional Research Service.
Hurst, C. (2010) China’s Rare Earths Industry: What can the West Learn? Washington: Institute for the Analysis of Global Security.
International Energy Agency – IEA (2013) Global Electric Vehicles Outlook 2013 Electric Vehicles Initiative.
Irwin, D.A. (2000) “How Did the United States Become a Net Exporter of Manufactured Goods”, Working Paper 7638, National Bureau of Economic Research.
Jepson, N. (2012) “A 21st century scramble: South Africa, China and the rare earth metals industry”, occasional Paper no. 113, Governance of Africa’s Resources Programme, South African Institute of International Affairs.
Jing, Y.C. (2011) “China’s Rare Earth Industry: are golden times coming?” In Resolve Falters As Glob-al Prospects Worsen: The 9th GTA Report, Global Trade Alert, edited by S. J.Evenett, Centre for Economic Policy Research, http://www.globaltradealert.org/9th_GTA_Report.
Johnson, C. (2010) “Rare earth supply chain: industry’s common cause”, Electronic Engineering Times, 1590: 20, http://www.eetimes.com/document.asp?doc_id=1264071.
Kelly, A. (2014) “The political development of scientiic capacity in the United States”, Studies in American Political Development, 28. Cambridge University Press, April 2014: 1–25.
Kennedy, J. (2014) “China’s rare earth monopoly and its formidable impact on U.S. national defense”, posted online Jan. 29 at Investor Intel, http://investorintel.com/.
Kingsnorth, D. (2012) “The Global Rare Earths Industry: A Delicate Balancing Act”, Centre for Rese-arch in Energy and Minerals ReseRese-arch (CREME) and Industrial Minerals Company of Australia (IMCoA), presentation to Deutsche Rohstoffagentu, Berlin, April 16.
Landes, D. (1969) The Unbound Prometheus: Technical Change and Industrial Development in West-ern Europe from 1750 to Present. Cambridge: Cambridge University Press.
Lifton, J. (2010) “The east is green: China’s focus on high tech raw materials for solar and other alter-nate energy technologies”, Technology Metals Research, published online August 26, http://www. techmetalsresearch.com/, accessed June 6, 2014.
Liu, x. and Liu, J. (2012) “Science and technology and innovation policy in China”, In Brics and De-velopment Alternatives: Innovation Systems and Policies, edited by J.E. Cassiolato and V. Vitori-no, London: Anthem Press.
Mancheri, N., Sundaresan, L., Chandrashekar, S. (2013) Dominating the Word: China and the Rare Earth Industry. Bangalore: National Institute of Advanced Studies.
Mazzucato, M. (2014) The Entrepreneurial State: Debunking Public vs. Private Sector Myths. London and New York: Anthem Press.
McKeown, A., Swire, N. (2008) “Strong Growth in Compact Fluorescent Bulbs Reduces Electricity Demand”, WorldWatch Institute Vital Signs, http://vitalsigns.worldwatch.org/.
Milward, A.S. and Saul, S.B. (1979) The Economic Development of Continental Europe: 1780–1870. London: George Allen & Unwin.
Morrison, W.M. & Tang, R. (2014) China’s Rare Earth Industry and Export Regime: Economic and Trade Implications for the United States. Washington: Congressional Research Service, 2012. Ni-kkei, “TDK to make magnets for hybrids in China”, Nikkei Asian Review, June 6, 2014. oremus, W. (2014) “The world’s dumbest trade war”, Slate, Feb. 19, http://www.slate.com/articles/. osnos, E. (2009) “Green giant: Beijing’s crash program for clean energy”, New Yorker, December 21,
http://www.newyorker.com/reporting/2009/12/21/091221fa_fact_osnos.
oster, S. (2010) “Businesses push G-20 on rare earth”, Wall Street Journal, Eastern Edition, November 6. Patti, C. (2012) “origin and evolution of the Brazilian nuclear program, 1947-2011”, Nuclear Prolife-ration International History Project, Woodrow Wilson Center, published online November 15, 2012, http://www.wilsoncenter.org/.
Perez, C. (2002) Technological Revolutions and Financial Capital, Massachusetts: Edward Elgar. Power, E. (1955) The Wool Trade in English Medieval History, oxford: oxford University Press, 1955. Roskill Information Services (2014), “What does the WTo ruling mean for the Chinese rare earth
in-dustry?” Roskill Brieing Paper, June, http://www.roskill.com.
Sachs, J., Warner, A. (1995) “Natural Resource Abundance and Economic Growth”, NBER Working Papers, Working Paper 5398.
Schacht, H. (1937) “Germany’s colonial demands”, Foreign Affairs, 15, 2: 223-234.
Shukman, D. (2014) “China on world’s biggest push for wind power”, BBC News, January 8, http:// www.bbc.com/news/science-environment-25623400, accessed october 8, 2014.
State Council of the People’s Republic of China (2012). Situation and Policies of China’s Rare Earth Industry, Beijing: Information ofice of the State Council.
Stijns, J.C. (2005) “Natural resource abundance and economic growth revisited”, Resources Policy, 30: 107-130.
Stone, R. (2009) “As China’s Rare Earth R&D Becomes Ever More Rareied, others Tremble”, Science, 325: 1336-7.
Thompson, K. (2013) “There is no substitute”, Popular Mechanics, 190, 1: 60-93.
Tu, J. (2010) “An economic assessment of China’s rare earths policy”, China Brief, 20, 22: 2-6, James-town Foundation.
United Nations Conference on Trade and Development (UNCTAD). (2014) Commodities at a Glance: Special Issue on Rare Earths, New York and Geneva: UNCTAD.
United States Department of Energy - US DoE – (2011) 2011 Critical Materials Strategy, http://energy. gov/epsa/initiatives/department-energy-s-critical-materials-strategy, 2011.
Shuming, H., Jing, W., quan, L. (2010) Quality Control and Market Supervision of Compact Fluores-cent Lamps in China, report funded by the United States Agency for International Development, published April 2.
Wickless, A. (2011) “Direct-drive wind turbines: Can the Chinese keep their lead?” Asian Power, publi-shed online August 2, http://asian-power.com/.
Wright, G. (1990) “The origins of American industrial success, 1879-1940”, American Economic Review, 80, 4: 651-668.
Wright, G. (2001) Resource-based growth then and now”, prepared for World Bank project Patterns of Integration in the Global Economy, June.
Wright, G. & Czelusta, J. (2004) “Mineral resources and economic development”, Stanford Center for International Development, Stanford University.
Wubbeke, J. (2013) “Rare earths in China: policies and narratives of reinventing an industry”, Re-sources Policy, 38: 384-394.