0103 - 5053 $6.00+0.00
Article
*e-mail: [email protected]
Thermoanalytical and Solution Stability Studies of Hexamethylenedithiocarbamates
Valéria D. Benedini,a Patrícia A. Antunes,b Éder T. G. Cavalheiro*,a and Gilberto O. Chiericea
a
Instituto de Química de São Carlos, Universidade de São Paulo, CP 780, 13560-970 São Carlos-SP, Brazil
b
Universidade do Oeste Paulista, Rua José Bongiovani, 700, 19050-680 Presidente Prudente-SP, Brazil
Estudos termogravimétricos e calorimétricos exploratórios diferenciais de hexametile-noditiocarbamatos de níquel(II), cobre(II), zinco(II) e cádmio(II) foram realizados sob atmosferas dinâmicas de ar e nitrogênio, para avaliar as etapas e os produtos de decomposição térmica. Esses produtos, quando cristalinos, foram caracterizados por difratometria de raios X, sendo predominantemente constituídos por sulfetos e óxidos metálicos sob N2 e ar, respectivamente. Usando espectrofotometria na região do ultravioleta, também foram determinados o pKa = 3,6 ± 0,2 para o ácido hexametilenoditiocarbâmico em força iônica igual a 0,50 mol dm-3 (KCl) a
25,0 °C e os parâmetros cinéticos de decomposição em diferentes valores de pH (klim = 2,21 × 10⁻² s-1 e t
½ lim = 156 s).
Thermogravimetric and differential scanning calorimetric investigation of the thermal behavior of nickel(II), copper(II), zinc(II) and cadmium(II) hexamethylenedithiocarbamates were performed under nitrogen and air atmospheres in order to investigate the steps and products of thermal decomposition. When obtained in a crystalline form, the decomposition products were identified by their X-ray diffraction patterns. Metal sulfides and oxides were the major residues under nitrogen and air atmospheres, respectively. Spectrophotometric measurements in the ultraviolet region were used to estimate the pKa = 3.6 ± 0.2 for the haxamethylenedithiocarbamic acid at 0.50 mol dm-3 ionic strength (KCl) at 25.0 °C and the kinetic parameters of decomposition at different
pH values (klim = 2.21 × 10⁻² s-1 and t½ lim = 156 s).
Keywords: hexamethylenedithiocarbamate, thermogravimetry, differential scanning calorimetry, decomposition rate constant
Introduction
Dithiocarbamates (DTC) are products of the reaction between a primary or secondary amine and carbon dissulfide in basic media. Their versatility and applicability was discussed by Kitson.1 The interest in
the solution stability of dithiocarbamates has been renewed by the utilization of such compounds as coadjutants in the treatment of AIDS,2,3 but they have
also been suggested for tuberculosis4 and cancer5
treatment in the past. These applications demand enough chemical stability for an effective action in the biological medium.
The applications of this class of compounds are not limited to medicine and their use in agriculture, industry, analytical and organic chemistry, as well as their physicochemical properties, are summarized in several
review articles.6-15 From these works it is known that
dithiocarbamates obtained from cyclic amines are more stable than the aliphatic derivatives.
The stability of dithiocarbamates in solution is strongly dependent on the pH, as discussed by several authors.16-22
However, it was the work of Chakrabarti and co-workers19-22
that led to the proposition of a decomposition intermediate whose stability is related to the presence of a water molecule in its structure.
Considering that the decomposition of dithiocarbamates is very fast in acidic media, a spectrophotometric method based on diode-array measurements has been proposed23
in order to reach a more accurate determination of the pKa of dithiocarbamic acids. A correlation between the infrared spectroscopy data of the coordination nature of cyclic DTC complexes and its effect on the thermal decomposition of such compounds has also been presented.24,25
seven member heterocyclic amine, whose structure is represented in Figure 1.
Among many other applications, hex complexes have widely been used in the determination of several metals using different strategies and techniques for pre-concentration. Examples of such applications, presented during the last 35 years, include the recent description of the profitable use of Co(hex)3,26-33 Fe(hex)
333-37 and its
mixtures with Fe2O3•xH2O38-42 and Pb(hex)
243-46 as a colloidal
precipitate collector in the flotation preconcentration of Cd, Cu, Fe, Ni, Pb, Zn, Tl, Cr and Mn, allowing determinations at the ng dm-3 range in several water samples.
These complexes have also been used to pre-concentrate metal ions in columns. After this step, the complexes are eluted and inserted in HPLC systems, allowing separations and simultaneous quantifications.47-52 They have also been
employed in separation and co-precipitation53-60 and in the
less recent applications with solid61-64 and liquid phase
extractions65-75 followed by determination by atomic
spectroscopic techniques of several elements.
Studies regarding the standard enthalpy of formation of hexamethyleneaminium hexamethylenedithiocarbamate,76
dye-sensitized photolysis77-79 and crystal structures of ligand
and complexes80,81 can also be found.
Thermal analysis of mixed-ligand nickel hexa-methylenedithiocarbamate complexes with triphenyl and tributylphosphine,82 as well as of lanthanide complexes
with hexamethylenedithiocarbamate,83,84 have been
described. Recently, the thermal behavior of the ammonium and hexamethyleneaminium salts of hexa-methylenedithiocarbamate was also reported.85
The solution stability of the hexamethylenedithio-carbamate proved to be important in medical appli-cations. A representative example is the patent presented by the French Roussel-Uclaf company86 regarding the
use of this DTC as a protector of hepatic cells. The compound is taken orally or by a bloodshot as an alkaline cation salt solution. In addition, the thermal behavior is another important feature in industrial and agricultural application of this dithiocarbamate, as related to thermal stability and residues generated during thermal decomposition.7
Despite the importance of the solution and thermal stability for hex applications, few studies regarding these issues have been reported. In the present work, the pKa
value of the hexamethylenedithiocarbamic acid (Hhex) was determined in ionic strength I = 0.50 mol dm-3 by
spectrophotometry in the ultraviolet region, and used to estimate the decomposition rate of hexamethylenedi-thiocarbamate (hex) at different pH values using a method based on diode-array measurements of the absorbance.23
Additionally, the thermal behavior of M(hex)2 (M = nickel(II), copper(II), zinc(II) and cadmium(II)) solid state complexes was evaluated, as these compounds are important examples of hex complexes with industrial and agricultural applications.
Experimental
All reagents were of analytical grade and used without further purification. The water employed in all expe-riments was deionized before use.
Hexamethyleneaminium-hexamethylenedithiocarbamate (HMA-hex) - synthesis and characterization
The HMA-hex salt was obtained by dissolving 0.4 mol of hexamethyleneimine in 50 dm3 of ethanol/water 1:1
(v/v) in an erlenmeyer. The mixture was kept in an ice bath
and protected from the light. Nitrogen was bubbled into the solution for 5 min and then 0.2 mol of carbon disulfide was slowly added to the reaction mixture. The white solid thus obtained was filtered, washed with cold ethanol and then dissolved in a minimum amount of ethanol/water 1:1 (v/v) at 35 °C, protected from the light. The solution was frozen and the white needle-like crystals were dried in a vacuum oven at 35 °C for 8 h and characterized as:
Hexamethylenedithiocarbamate complexes - synthesis and characterization
The metal complexes were obtained by direct reaction of the HMA-hex solution and CdCl2•2H2O, CuCl2•H2O, NiCl2•6H2O and ZnCl2 solutions in a glove bag (Cole-Parmer, USA) under N2. The resulting precipitates, with characteristic colors, were filtered off, washed with water and then with ethanol. They were finally dried in a vacuum oven at 35 °C for 8 h and characterized as:
Buffer solutions
The McIlvaine buffer solutions with ionic strength adjusted to 0.50 mol dm-3 (KCl) were prepared according
to the procedure described by Elving et al.87 The pH values
of these buffers were accurately measured with a glass electrode previously calibrated with KCl solutions of ionic strength 0.50 mol dm-3 and hydrogen ion concentration 1.00
× 10-2 and 1.00 × 10⁻⁴ mol dm-3 (HClO
4), corresponding to
pH 2.00 and 4.00, respectively.88
Equipment
The characterization of the complexes was performed by IR vibrational spectroscopy (KBr pellets) in a Nicolet 5SXC spectrophotometer. Flame atomic absorption spectroscopy was carried out in a Hitachi Z-8100 spectrophotometer and C, N, H contents were determined by elemental analysis using a Fisons EA 1108 CNHS-O instrument.
Thermogravimetric (TG) curves were recorded in a DuPont 9900 thermoanalyser coupled with a TGA 951 Thermogravimetric Module, under a gas flow of 90 dm3
min-1 (N
2 or air) in a platinum crucible. A heating rate of
10 °C min-1 and samples of about 7 mg at atmospheric
pressure were employed. The differential scanning calorimetric (DSC) curves were recorded in a DuPont 9900 thermoanalyser coupled with a DSC 910 Calorimetric Module under a gas flow of 90 dm3 min-1 (N
2 or air), in
covered aluminum pans with a central pin hole, at a heating rate of 10 °C min-1 and using samples of about 5
mg at atmospheric pressure. The cell was previously calibrated for temperature and energy (ΔH) using indium metal (99.9+%) as standard.
Intermediates of the thermal decomposition process were generated in an oven at the same temperature and atmosphere in which they appeared in the TG curves. After 15 min of heating, they were cooled down and kept in a desiccator under vacuum. The X-ray patterns of the crystalline residues were recorded in a VEB-Karl Zeiss Jena URD6 diffracto-meter. The results were compared with standard data from the International Centre for Diffraction Data.89
A diode-array Hewlett-Packard HP 8451A spectro-photometer and quartz cells, 1.00 cm path length, were used in the spectrophotometric measurements. The pH values were measured with a Corning IA 250 coupled to a Metrohm EA 121 combined glass electrode.
Procedure for pKa determination
The spectrophotometric method used for pKa
determination was described earlier.23,90 All the
spectro-photometric measurements were carried at 25.0 ± 0.1 °C, using the buffered solution as a blank. Stock HMA-hex solutions (1.0 × 10⁻² mol dm-3) were used in the preparation of working solutions, with concentrations ranging from 3.34 × 10⁻⁵ to 1.67 × 10⁻⁶ mol dm-3 in pH 2.13 and 8.40. A 1.0 × 10⁻⁴ mol dm-3 HMA-hex solution was used in the determination of the maximum absorption wavelength of the acidic and basic forms, in pH ranging from 2.78 to 4.10. In order to minimize the decomposition of the compounds, the solutions were prepared directly in the cells, by adding an appropriate volume of the stock solution of HMA-hex to the buffer solution and reaching a final volume of 3.00 dm3.
Results and Discussion
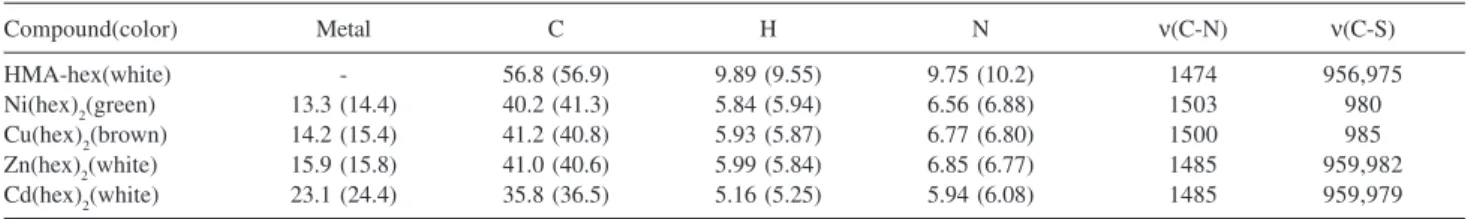
The products are listed in Table 1 and the formulae given are in agreement with elemental analyses and thermogravimetric data. The hex structure is presented in Figure 1. All complexes are anhydrous. The split IR absorption band around 1000 cm-1 indicated that the ligand
presents a monodentate behavior in Cd(hex)2 and Zn(hex)2, while a single absorption band in this region suggests a bidentate behavior in Ni(hex)2 and Cu(hex)2, according to Sharma7 and Nakamoto.91 This is in total agreement
with our previous findings for other cyclic DTC complexes with the same metal cations.24,25,90
The characteristic C–N stretching vibrational mode is observed at 1474-1503 cm-1 and is less intense than that
observed for alkyl DTC derivatives due to the low double bond character caused by the rigid ring system.92
Table 1.Percentages of metal, carbon, hydrogen and nitrogen found (calculated) and main infrared absorption bands (cm-1) for the
hexamethylelinedithiocarbamates studied in this work
Compound(color) Metal C H N ν(C-N) ν(C-S)
HMA-hex(white) - 56.8 (56.9) 9.89 (9.55) 9.75 (10.2) 1474 956,975
Ni(hex)2(green) 13.3 (14.4) 40.2 (41.3) 5.84 (5.94) 6.56 (6.88) 1503 980
Cu(hex)2(brown) 14.2 (15.4) 41.2 (40.8) 5.93 (5.87) 6.77 (6.80) 1500 985
Zn(hex)2(white) 15.9 (15.8) 41.0 (40.6) 5.99 (5.84) 6.85 (6.77) 1485 959,982
pKa determination
The use of diode array data for pKa determination is convenient, since the decomposition of DTC is very fast in acidic media.19-23 The decomposition rate depends on
the amine substituents. The procedure considers that the total absorbance at a given wavelength is due to the sum of the absorbances of the protonated (Hhex) and free (hex) forms of the DTC:
AA = ε
A,Hhex[Hhex] + εA,hex[hex] (1)
AB = ε
B,Hhex[Hhex] + εB,hex[hex] (2)
in which AA and AB are the absorbances in the wavelengths A and B, respectively, ε
A,Hhex and εA,hex are the molar
absorptivities of the protonated and free forms in the wavelength A, and [Hhex] and [hex] are the concentrations of the protonated and free forms, respectively. The absorptivity coefficients can be obtained from the slopes of A versus [hex] plots, at the maximum wavelengths, in
acidic and basic media. On solving equations (1) and (2), it is possible to determine the [hex]/[Hhex] ratio. Then, measuring the absorbances at different pH values, the pKa can be determined by the Henderson-Hasselbach equation:
(3)
The maximum absorption wavelength of the protonated (Hhex) form was observed at 276 nm. The free form presented two maxima at 260 and 283 nm. For best resolution, 260 nm (basic, ε = 1.22 x 104 cm-1 mol dm-3) and 276 nm (acidic, ε = 1.06 × 104 cm-1 mol dm-3) were used in the pK
a determination.
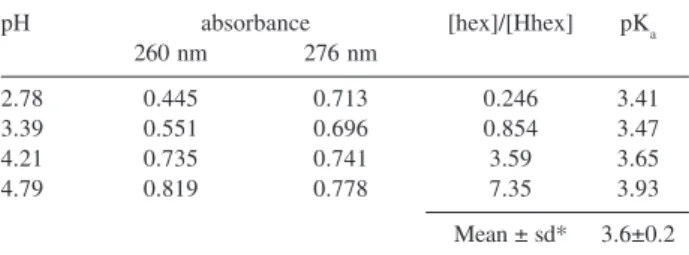
The results are summarized in Table 2 and a pKa value of 3.6±0.2 was obtained. Values of pKa around 3.29 were previously reported using a conventional spectrophotometric21
method at 25 °C and a 0.01 mol dm-3 ionic strength.
An evaluation of these differences can be performed considering the changes in spectral shape when the pH is changed from 2.8 to 4.1 (Figure 2). According to Vandebeek et al.,21 the acidic form of a DTC presents
Table 2. Results of the pKa determination for Hhex (I = 0.50 mol dm-3, 25 °C)
pH absorbance [hex]/[Hhex] pKa
260 nm 276 nm
2.78 0.445 0.713 0.246 3.41
3.39 0.551 0.696 0.854 3.47
4.21 0.735 0.741 3.59 3.65
4.79 0.819 0.778 7.35 3.93
Mean ± sd* 3.6±0.2 *sd = standard deviation (n=4).
only one peak in the UV region, while the basic form presents two peaks. Figure 2 shows that from pH 3.9 two peaks are clearly observed, evidencing the presence of a significant amount of the basic form. At pH 2.8 only one peak is observed, suggesting the presence of a significant amount of the acidic form.
The results also suggest the following order of acidity for cyclic dithiocarbamate derivatives such as pyrrolidine (pyr), piperidine (pip), morpholine (mor) and hexa-methylenedithiocarbamates (hex) (in brackets the pKa value and the reference in which it appears):
Hpyr (3.14)23 > Hpip (3.51)23≈ Hmor (3.56)90≈ Hhex (3.6)this work
Decomposition kinetics
The decomposition of HMA-hex was followed by the absorbance decay of the 286 nm peak at different pH values. The lnA/A0 versus time plots showed a linear
dependence, suggesting a pseudo-first order kinetics with slope equal to kap.
Chakrabarty and co-workers19-22 investigated the
decomposition of dithiocarbamates. According to these authors, the rate of decomposition in basic media is dependent on the pH ([H+]<<K
a), but in sufficiently acidic solutions
([H+]>>K
a) it becomes constant (kap≈ klim), according to:
(4)
in which kap is the apparent rate constant from the ln A/A0
versus time plots, klim is the limiting rate constant at low
pH and K
a is the acidic dissociation constant.
The results obtained for hex are presented in Table 3. These data led us to conclude that hex presents an intermediate stability between the analogous
Figure 2. Changes in the UV-Vis spectral shape of a 1.0 × 10⁻⁴ mol dm-3
piperidinedithiocarbamate, pip (t½lim = 10 s) and the 5 membered ring pyrrolidine derivative, pyr (t½lim = 1620 s).23 Chakrabati and co-workers20,21 attributed this
difference to the ability of pyr and hex to interact with a water molecule in the decomposition intermediate, due to the configuration of the 5 and 7 membered rings.
The low stability of the anion in acidic medium can explain the large deviations between the measurements in Table 3.
Thermal decomposition of solid state complexes
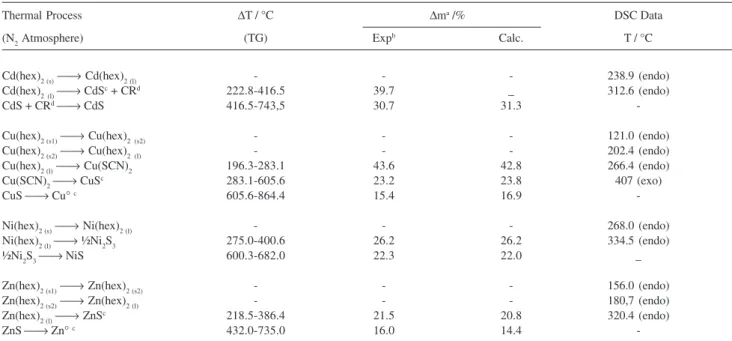
Thermal processes, residues formed, mass losses and temperature ranges observed in each step of the TG/DTG and DSC curves are given in Table 4 under nitrogen and Table 5 under air dynamic atmospheres. Crystalline intermediates were characterized by X-ray diffraction patterns and results were compared with literature data.89
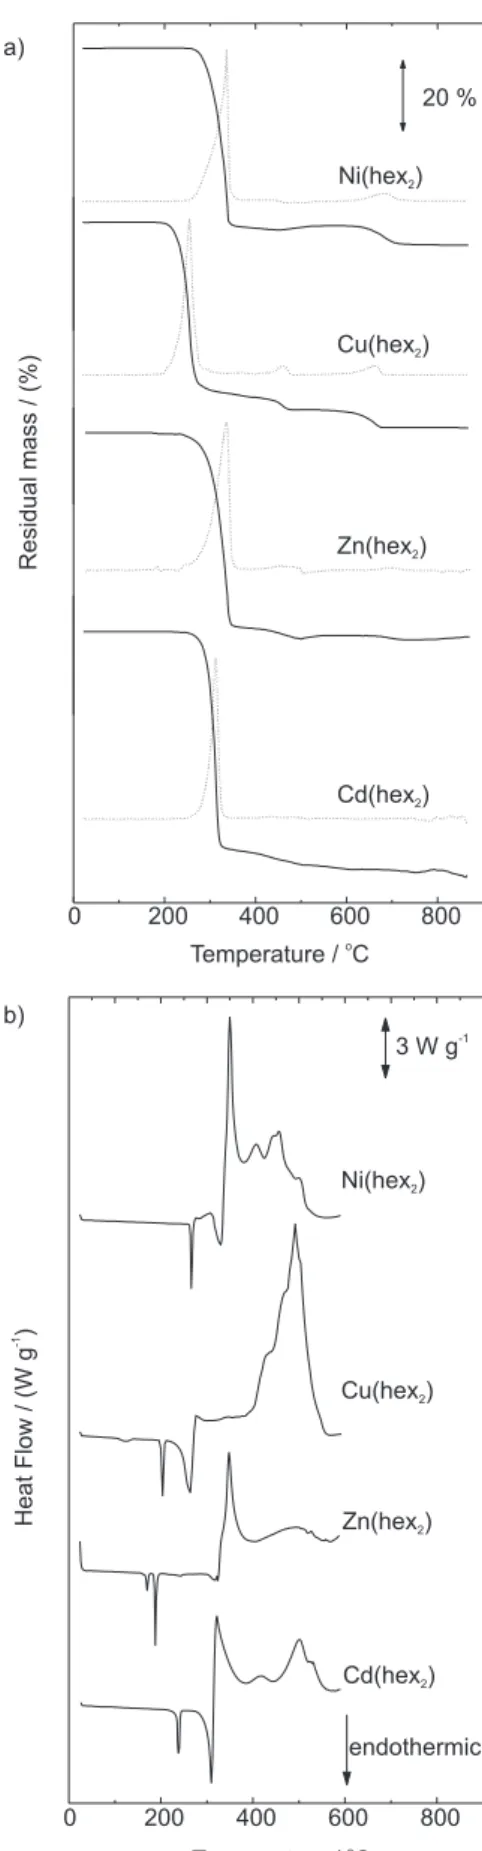
TG/DTG and DSC curves are presented in Figure 3 under
N2 and in Figure 4 in air. DSC curves are limited to 600 °C because aluminum pans were used.
As described earlier,85 the HMA-hex salt showed
melting followed by complete volatilization between 110-163 and 90-170 °C under nitrogen and air dynamic atmospheres respectively (curves not presented). The IR spectra of the HMA-hex salt and of the condensed product confirmed the volatilization phenomena.
Crystalline changes were detected for the copper and the zinc complexes, represented by endothermic peaks in the DSC curves in both atmospheres. Melting points were checked by the use of a capillary tube immerse in a glycerin bath, in order to differentiate them from the crystalline changes. X-ray diffraction analysis was performed in order to characterize the crystalline residues, when available; otherwise the nature of the residues has been assigned by stoichiometric calculations. The results are presented in Table 6 and are compared with literature data.89 The thermal behavior
of the complexes is discussed below.
Thermal decomposition under nitrogen
Thermoanalytical curves are presented in Figure 3. According to TG/DTG and DSC data, there is no evidence for the presence of hydration water in the solids. Melting was observed for Cu(hex)2, Cd(hex)2, Ni(hex)2 and Zn(hex)2, and it was confirmed in a capillary glass tube
Table 4. Thermal degradation data under nitrogen, from thermogravimetry, showing the thermal process, the interval of temperature (ΔT), mass losses (Δm) experimental (exp) and calculated (calc), or residue and from differential scanning calorimetry, indicating the temperature of the peak (T), and the endothermic (endo) or exothermic (exo) nature of the process
Thermal Process ΔT / °C Δma /% DSC Data
(N2 Atmosphere) (TG) Expb Calc. T / °C
Cd(hex)2 (s)⎯→ Cd(hex)
2 (l) - - - 238.9 (endo)
Cd(hex)2(l)⎯→ CdSc + CRd 222.8-416.5 39.7 _ 312.6 (endo)
CdS + CRd⎯→ CdS 416.5-743,5 30.7 31.3
-Cu(hex)2 (s1)⎯→ Cu(hex)
2(s2) - - - 121.0 (endo)
Cu(hex)2 (s2)⎯→ Cu(hex)
2(l) - - - 202.4 (endo)
Cu(hex)2 (l)⎯→ Cu(SCN)
2 196.3-283.1 43.6 42.8 266.4 (endo)
Cu(SCN)2⎯→ CuSc 283.1-605.6 23.2 23.8 407 (exo)
CuS ⎯→ Cu° c 605.6-864.4 15.4 16.9
-Ni(hex)2 (s)⎯→ Ni(hex)
2 (l) - - - 268.0 (endo)
Ni(hex)2 (l)⎯→ ½Ni
2S3 275.0-400.6 26.2 26.2 334.5 (endo)
½Ni2S3⎯→ NiS 600.3-682.0 22.3 22.0 _
Zn(hex)2 (s1)⎯→ Zn(hex)
2 (s2) - - - 156.0 (endo)
Zn(hex)2 (s2)⎯→ Zn(hex)
2 (l) - - - 180,7 (endo)
Zn(hex)2 (l)⎯→ ZnSc 218.5-386.4 21.5 20.8 320.4 (endo)
ZnS ⎯→ Zn° c 432.0-735.0 16.0 14.4
-athe mass losses refer to the starting material; brelative to residue in relation to the starting material; ccharacterized by X-ray diffraction pattern – see Table
6; dCR = carbonaceous residue.
Table 3.HMA-hex decomposition kinetic data at different pH values and at an ionic strength of 0.50 mol dm-3 (KCl)
pH [H+] / (10-3 mol dm-3) k
ap/10-3 s-1 t½/s klim/(10-2 s-1) t½ lim/s
2.10 7.94 62.87 11 6.48 10.7
2.75 1.78 1.98 350 0.225 308
3.98 0.105 0.770 900 0.257 270
4.92 0.0120 0.880 7880 1.88 36.8
Figure 3. TG (solid)/DTG(dashed) (a) and DSC (b) curves under ni-trogen flow of 90 dm3 min-1, sample mass ca. 7mg, heating heat 10 °C
min-1, platinum sample holder (TG/DTG) and aluminum (DSC).
Figure 4. TG (solid)/DTG(dashed) (a) and DSC (b) curves under air flow of 90 dm3 min-1, sample mass ca. 7mg, heating heat 10 °C min-1,
test. Zn(hex)2 and Cu(hex)2 apparently melted after a crystalline transition, as suggested by the peak shape and the absence of mass loss associated with the process. XRD measurements were not performed before and after the peak in order to confirm these physical changes.
Sulfides were the main residues around 400 °C, after the decomposition of the complexes. Metallic Cd, Cu and Zn were found in the further decomposition steps of the inorganic residue, while NiS remained stable as the final decomposition product in the temperature range investigated.
Only in the Cu(hex)2 case, Cu(SCN)2 was detected as the intermediate in decomposition, as suggested by Sharma.7 This is in agreement with previous findings for
other cyclic dithiocarbamate derivatives.23-25,90
Thermal decomposition in air
The thermoanalytical curves recorded in air are presented in Figure 4. For Cd, Ni and Zn complexes, the respective sulfides were produced after the first
Table 5. Thermal degradation data under air, from thermogravimetry, showing the thermal process, the interval of temperature (ΔT), mass losses (Δm) experimental (exp) and calculated (calc), or residue and from differential scanning calorimetry, indicating the temperature of the peak (T), and the endot-hermic (endo) or exotendot-hermic (exo) nature of the process
Thermal Process ΔT / °C Δma /% DSC Data
(Air Atmosphere) (TG) Exp.b Calc. T / °C
Cd(hex)2 (s) ⎯→ Cd(hex)2 (l) - - - 238.4 (endo)
Cd(hex)2 (l) ⎯→ CdSc 227-617.8 31.3 31.2 309.6, 416.5 (endo)
321.7, 501.7 (exo)
CdS ⎯→ ½Cd2OSO4 680.0-794.6 34.0 36.5
½Cd2OSO4⎯→ decomposition products >800 - -
-Cu(hex)2 (s1)⎯→ Cu(hex)
2 (s2) - - - 123.5 (endo)
Cu(hex)2 (s2)⎯→ Cu(hex)
2 (l) - - - 204.0 (endo)
Cu(hex)2 (l) ⎯→ ½Cu2S(CN)2c 187.2-387.9 32.0 - 264.5 (endo)
½Cu2S(CN)2 ⎯→ ½Cu2OSO4 387.9-476.7 27.1 29.0 492.0 (exo)
½Cu2OSO4⎯→ CuOb 568.4-681.3 19.3 19.8
Ni(hex)2 (s)⎯→ Ni(hex)
2 (l) - - - 260.0 (endo)
Ni(hex)2 (l) ⎯→ ½Ni2S3 244.4-430.5 26.2 28.3 308.0 (endo), 349.3 (exo)
½Ni2S3 ⎯→ ½Ni2OSO4 467.6-517.3 28.2 29.0 407.0, 456.3, 502.4 (exo)
½Ni2OSO4⎯→ ½ Ni
2O3 621.1-729.5 23.4 20.3
-Zn(hex)2 (s1) ⎯→ Zn(hex)2 (s2) - - - 162.4 (endo)
Zn(hex)2 (s2)⎯→ Zn(hex)
2 (l) - - - 185.0 (endo)
Zn(hex)2 (l)⎯→ ZnSc 206.5-380.0 23.5 22.2 316.5 (endo), 348.0 (exo)
ZnS ⎯→ ZnO 390.6-729.5 19.7 19.5
-athe mass losses refer to the starting material; brelative to residue in relation to the starting material; ccharacterized by X-ray diffraction pattern – see Table 6.
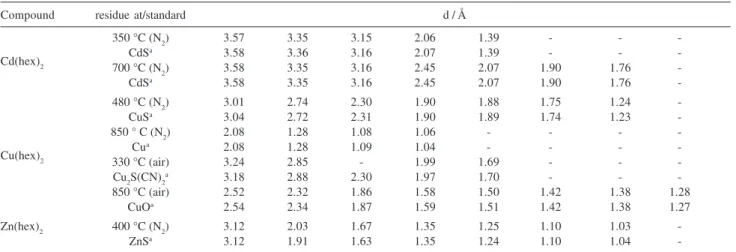
Table 6.X-ray diffraction data for the residues at different temperatures, compared with literature standardsa
Compound residue at/standard d / Å
350 °C (N2) 3.57 3.35 3.15 2.06 1.39 - -
-Cd(hex)2 700 °C (NCdSa 3.58 3.36 3.16 2.07 1.39 - -
-2) 3.58 3.35 3.16 2.45 2.07 1.90 1.76
-CdSa 3.58 3.35 3.16 2.45 2.07 1.90 1.76
-480 °C (N2) 3.01 2.74 2.30 1.90 1.88 1.75 1.24
-CuSa 3.04 2.72 2.31 1.90 1.89 1.74 1.23
-850 ° C (N2) 2.08 1.28 1.08 1.06 - - -
-Cu(hex)2 330 °C (air)Cua 3.242.08 1.282.85 1.09- 1.041.99 1.69- -- -- -
-Cu2S(CN)2a 3.18 2.88 2.30 1.97 1.70 - -
-850 °C (air) 2.52 2.32 1.86 1.58 1.50 1.42 1.38 1.28
CuOa 2.54 2.34 1.87 1.59 1.51 1.42 1.38 1.27
Zn(hex)2 400 °C (N2) 3.12 2.03 1.67 1.35 1.25 1.10 1.03
-ZnSa 3.12 1.91 1.63 1.35 1.24 1.10 1.04
decomposition step and were converted to oxide (Zn) or oxysulfates (Cd and Ni) by further heating of the residue (see Table 5). The detection of oxysulfates as decomposition intermediates is in agreement with previous results.24 The copper complex decomposed in
a different way, generating Cu2S(CN)2, oxysulfate and finally the oxide, according to the X-ray diffraction patterns of the residues.89 Crystalline changes and
melting processes were also observed, in agreement with the data obtained under N2 and reported in the previous section.
Results indicated that the following stability order can be established, according to the temperature in which decomposition starts: Ni(hex)2 > Cd(hex)2 > Zn(hex)2 > Cu(hex)2.
Conclusions
The Hhex is the weaker acid when compared to the series of cyclic DTC derived from pyrrolidine, piperidine and hexamethyleneamine, respectively 5, 6 and 7-membered aminic rings. The limiting half life (t1/2lim) suggests that hex is more stable than piperidinedithiocarbamate (pip) and morpholinedithiocarbamate (mor) and much less stable than pyrrolidinedithiocarbamate (pyr).23,90
The thermal analytical studies revealed that sulfides were the main residues obtained under nitrogen atmosphere, which were reduced to the elementary metals in the case of the copper(II) and zinc(II) complexes. Oxysulfates were observed in air as intermediates of the decomposition of Ni(hex)2, Cu(hex)2 and Cd(hex)2, while oxides were obtained as final decomposition products. The nickel(II) complex was the most stable in this series.
References
1. Kitson, T.; Education in Chemistry 1985, 43.
2. Rabbi, M.F.; Finnegan, A.; Al-Hartli, L.; Stong, S.; Roebuck K.A.; Journal of Acquired Immune Deficiency Syndromes and
Human Retrovirology 1998, 19, 321.
3. Topping, R.M.; Jones, M.M.; Med. Hipothesys 1989, 27, 55.
4. Weuffen, A.; Kewitsch, A.; Arch. Exp. Veterinaermed. 1967, 21, 1049.
5. Powell, A.K.; Brit. J. Cancer 1954, 8, 529.
6. Hill, J. O.; Chirawongaram, S.; J. Thermal Anal. 1994, 41, 511.
7. Sharma, A.K.; Thermochim. Acta 1986, 104, 339.
8. Magee, R.J.; Hill, J.O.; Rev. Anal. Chem. 1985, 8, 5.
9. Bond, A.M.; Martin, R.L.; Coord. Chem. Rev. 1984, 54, 23.
10. Sengupta, S.K.; Kumar, S.; Termochim. Acta 1984, 72, 349.
11. Hill, J.O.; Magee, R.J.; Rev. Inorg. Chem. 1981, 3, 141.
12. Coucovanis, D.; Progr. Inorg. Chem. 1979, 26, 301.
13. Coucovanis, D.; Progr. Inorg. Chem. 1970, 11, 233.
14. Hulanicki, A.; Talanta 1967, 14, 1371.
15. Thorn, G.D.; Ludwig, R.A.; The Dithiocarbamates and Related
Compounds, Elsevier: Amsterdam, 1962.
16. Castro, E.A.; Cortes, R.; Santos, J.G.; Vega, J.C.; J. Org. Chem.
1982, 47, 3774.
17. De-Filippo, D.; Deplano, P.; Devillanova, F.; Trogu, E.F.; Verani
G.; J. Org. Chem. 1973, 38, 560.
18. Usatenko, Y.I.; Barkalov, U.S.; Tulypa, F.M.; J. Anal.
Chem.-USSR. 1970, 25, 1458.
19. Aspila, K.I.; Chakrabarti, C.L.; Sastri, V.S.; Anal. Chem. 1973, 45, 363.
20. Joris, S.J.; Aspila, K.I.; Chakrabarti, C.L.; J. Phys. Chem. 1970,
74, 860.
21. Vandebeek, R.R.; Joris, S.J.; Aspila, K.I.; Chakrabarti, C.L.;
Can. J. Chem. 1970, 48, 2204.
22. Aspila, K.I.; Sastri, V.S.; Chakrabarti, C.L.; Talanta 1969, 16, 1099.
23. Cavalheiro, E.T.G.; Chierice, G.O.; J. Braz. Chem. Soc. 1997, 8, 53.
24. Cavalheiro, E.T.G.; Ionashiro, M.; Marino, G.; Breviglieri, S.T.; Chierice, G.O.; J. Braz. Chem. Soc. 1999, 10, 65.
25. Cavalheiro, E.T.G.; Ionashiro, M.; Marino, G.; Breviglieri, S.T.; Chierice, G.O.; Transit. Metal Chem. 2000, 25, 69.
26. Bundalevska, J.M.; Koyuncu, I.; Ay, O., Cundeva; K.; Akcin, G.; Stafilov, T.; J. Environ. Sci. Health, Part A: Toxic/Hazard.
Subst. Environ. Eng. 2005, 40, 1045.
27. Kojuncu, Y.; Bundalevska, J.M.; Ay, U.; Cundeva; K.; Stafilov, T.; Akcin, G.; Sep. Sci. Technol. 2004, 39, 2751.
28. Ay, U.; Cundeva; K.; Stafilov, T.; Zajkova, V.P.; Pavlovska, G.;
Anal. Lett. 2004, 37, 695.
29. Cundeva; K.; Stafilov, T.; Pavlovska, G.; Karadjova, I.; Arpadjan, S.; Int. J. Environ. Anal. Chem. 2003, 83, 1009.
30. Pavlovska, G.; Cundeva; K.; Stafilov, T.; Zendelovska, D.; Sep.
Sci. Technol. 2003, 38, 1111.
31. Pavlovska, G.; Cundeva; K.; Stafilov, T.; Anal. Lett. 2002, 35,
2347.
32. Pavlovska, G.; Stafilov, T.; Cundeva; K.; Fresenius. J. Anal.
Chem. 2001, 369, 670.
33. Stafilov, T.; Cundeva; K.; Pavlovska, G.; Int. J. Environ. Anal.
Chem. 2001, 80, 269.
34. Stafilov, T.; Pavlovska, G.; Cundeva; K.; Zendelovska, D.; Paneva, V.; J. Environ. Sci. Health, Part A: Toxic/Hazard. Subst.
Environ. Eng. 2001, 360, 735.
35. Zendelovska, D.; Pavlovska, G.; Cundeva; K.; Stafilov, T.;
Talanta 2001, 54, 139.
36. Zendelovska, D.; Cundeva; K.; Stafilov, T.; Mikrochim. Acta
2000, 135, 55.
37. Cundeva; K.; Stafilov, T.; Pavlovska, G.; Microchem. J. 2000, 65, 165.
38. Stafilov, T.; Zendelovska, D.; Pavlovska, G.; Cundeva; K.;
39. Pavlovska, G.; Cundeva; K.; Stafilov, T.; Croatia Chemica Acta
2001, 74, 121.
40. Stafilov, T.; Pavlovska, G.; Cundeva; K.; Turk. J. Chem. 2000, 24, 303.
41. Stafilov, T.; Pavlovska, G.; Cundeva; K.; Michrochem. J. 1998, 60, 32.
42. Pavlovska, G.; Stafilov, T.; Cundeva; K.; Fresenius. J. Anal.
Chem. 1998, 361, 213.
43. Paneva, V.Z.; Cundeva; K.; Stafilov, T.; Spectrochim. Acta, Part B 2005, 60, 403.
44. Cundeva; K.; Pavlovska, G.; Stafilov, T.; J. Serb. Chem. Soc.
2001, 66, 709.
45. Pavlovska, G.; Cundeva; K.; Stafilov, T.; Sep. Sci. Technol.
2000, 35, 2663.
46. Cundeva; K.; Stafilov, T.; Pavlovska, G.; Spectrochim. Acta,
Part B 2000, 55, 1081.
47. Ichinoki, S.; Okamoto, Y.; Ishikuma, H.; Fujii, Y.; J. Liq.
Chromatogr. Relat. Technol. 2003, 26, 2797.
48. Shijo, Y.; Yoshida, H.; Kitamura, T.; Yoshimoto, E.; Uehara,
N.; Anal. Sci. 1996, 12, 761.
49. Ichinoki, S.; Yamazaki, M.; Omura, M.; Nagai, R.; Bunseki
Kagaku 1996, 45, 837.
50. Falter, R.;Scholer, H.F.; Fresenius J. Anal. Chem. 1995, 353, 34.
51. Ichinoki, S.; Yamazaki, M.; J. Chromatogr. Sci. 1991, 29, 184.
52. Ichinoki, S.; Yamazaki, M.; Anal. Chem. 1985, 57, 662.
53. Frigge, C.; Jackwerth, E.; Anal. Chim. Acta 1993, 271, 299.
54. Buhler, A.; Jackwerth, E.; Fresenius J. Anal. Chem. 1992, 343,
362.
55. Fang, Z.L.; Dong, L.P.; J. Anal. At. Spectrom. 1992, 7, 439.
56. Fang, Z.L.; Sperling, M.; Welz, B.; J. Anal. At. Spectrom. 1991, 6, 301.
57. Frigge, C.; Jackwerth, E.; Anal. Chim. Acta 1991, 242, 99.
58. Byrko, V.M.; Vizhenskii, V.A.; Molchanova, T.P.; J. Anal. Chem. USSR 1987, 42, 251.
59. Yamamoto, Y.; Nishino, Y.; Ueda, K.; Talanta 1985, 32, 662.
60. Yamamoto, Y.; Sugita, M.; Ueda, K.; Bull. Chem. Soc. Jpn.
1982, 55, 742.
61. Tokahoglu, S.; Kartal, S.; Elci L.; Bull Kor. Chem. Soc. 2002, 23, 693.
62. Alexandrova, A.; Arpadjan, S.; Anal. Chim. Acta 1995, 307, 71.
63. Alexandrova, A.; Arpadjan, S.; Analyst 1993, 118, 1309.
64. Wommel, S.; Calmano, W.; Acta Hydrochimica et
Hydrobiologica1992, 265.
65. Dapaah, A.R.K.; Takano, N.; Ayame, A.; Anal. Chim. Acta 1999, 386, 281.
66. Dapaah, A.R.K.; Ayame, A.; Anal. Chim. Acta 1998, 360, 26.
67. Dapaah, A.R.K.; Ayame, A.; Anal. Sci. 1997, 13, 405.
68. Miyazake, A.; Sampei, T.; Tao, H.; Nagase, T.; Nippon Kagaku
Kaishi 1992, 307.
69. Tao, H.; Miyazake, A.; Bamsho, K.; Unezaki, Y.; Anal. Chim. Acta 1984, 156, 159.
70. Tsalev, D.L.; Petrova, V.P.; Dokladi Na BolgarskataAkademiya
Na Naukite 1979, 32, 911.
71. Dornemann, A.; Kleist, H.; Analyst 1979, 104, 1030.
72. Tsalev, D.L.; Dokladi Na BolgarskataAkademiya Na Naukite
1979, 32, 779.
73. Berndt, H.; Jackwerth, E.; Fresenius J. Anal. Chem. 1978, 290,
369.
74. Busev, A.I.; Tereshchenko, A.P.; Naidina, V.P.; J. Anal. Chem. USSR 1976, 31, 944.
75. Busev, A.I.; Byrko, V.N.; Tereshchenko, A.P.; Novikova, N.N.; Naidina, V.P.; Terentev, P.B.; Zhurnal Analiticheskoi Khimii
1970, 25, 665.
76. Alekseev, T.A.; Tresvyat, P.A.; Treshch, A.P.; Russ. J. Phys.
Chem. 1971, 45, 1669.
77. Yamase, T.; Kokado, H.; Inoue, E.; Bull. Chem. Soc. Jpn. 1972, 45, 726.
78. Yamase, T.; Kokado, H.; Inoue, E.; Bull. Chem. Soc. Jpn. 1970, 43, 669.
79. Yamase, T.; Kokado, H.; Inoue, E.; Bull. Chem. Soc. Jpn. 1970, 43, 934.
80. Zvonkova, Z.V.; Yakovenk, V.I.; Soviet Physics Crystalography
1968, 13, 134.
81. Zvonkova, Z.V.; Poveteva, Z.P.; Vozzenni, V.M.; Gluskova, V.P.; Jakovenk, V.I.; Khvatkin, A.N.; Acta Crystallographica S 1966, 21, A155 Part 7S.
82. Pavlicek, M.; Travnicek, Z.; Pastorek, R.; Marek, J.; Transition
Met. Chem. (Dordrecht, Neth.) 2003, 28, 260.
83. Dahiya, K.K.; Kaushik, N.K.; Thermochim. Acta1989, 141,
69.
84. Dahiya, K.K.; Kaushik, N.K.; Indian J. Chem., Sect. A: Inorg.,
Bio-inorg., Phys., Theor. Anal. Chem. 1988, 27, 449.
85. Ramos, L.A.; Cavalheiro, E.T.G.; Chierice, G.O.; J. Therm.
Anal. Calorim. 2005, 79, 349.
86. Roussel-Uclaf (ROUS); FR2081589-A5; FR2081589-A, 1970 (AN 1972: 501408).
87. Elving, P.J., Morkowitz, J.M.; Rosenthal, I.; Anal. Chem. 1956, 28, 1179.
88. Cavalheiro, E.T.G.; Plepis, A.M.G.; Chierice, G.O.; Neves, E.F.A.; Polyhedron 1987, 9, 1717.
89. International Centre for Diffraction Data. Power Diffraction File (CD-ROM). Newton Square, ICDD, 1994.
90. Antunes, P.A.; Breviglieri, S.T.; Chierice, G.O.; Cavalheiro, E.T.G.; J. Braz. Chem. Soc. 2001, 12, 473.
91. Nakamoto, K.; Infrared and Raman Spectra of Inorganic and
Coordination Compounds, 3rd ed.; John Wiley: New York, 1977.
92. Preti, C.; Tosi, G.; Zanini, P.; J. Mol. Struct. 1979, 53, 35.
Received: September 19, 2005 Published on the web: May 16, 2006