WIND SPEED AND DIRECTION CHARACTERIZATION IN TANGARÁ DA SERRA, MATO
GROSSO STATE, BRAZIL
RIVANILDO DALLACORT, PATRÍCIA SIMONE PALHANA MOREIRA, MIRIAM HIROKO INOUE,
DIONEI JOSÉ SILVA, ILIO FEALHO CARVALHO, CRISTIANO SANTOS
Universidade do Estado de Mato Grosso (UNEMAT)
[email protected], [email protected], [email protected], [email protected],
[email protected], [email protected]
Received May 2009 – Acepted February 2010
ABSTRACT
The aim of this work was to determine the predominant winds speeds and directions in the Tangará da Serra region, locate in Southwest of Mato Grosso State, Brazil. So that, it was used meteorological time series from 2003 to 2008, collected through an Universal Anemometer, installed 10 meters above the ground surface in the Automatic Weather Station by the INMET - Meteorology National Institute at the Mato Grosso State University - UNEMAT (14º39` S, 57º25` W and 321,5 m). The predominant winds directions were characterized by the frequency analysis of daily observations from each month of the year. The months that showed higher speeds were: May, June, July, August and September. March showed the lower average and the lower maximum speeds. In all months, the diurnal winds were higher than the nocturnal ones, the strongest winds had occurred during the warmer hours of the day, i.e. from 13:00 to 17:00 h (local time). The monthly maximum gusts had varied from 15.1 m s-1 in June to 30.7 m s-1 in August. In most months of the year there is a predominance of winds from the Northeast (NE), except August and September period, when the winds predominant directions is from the South (S).
Keywords: Alto Paraguay, winds, daytime and nigh
RESUMO: CARACTERIZAÇÃO DA VELOCIDADE E DA DIREÇÃO DOS VENTOS EM TANGARÁ DA SERRA, MATO GROSSO, BRASIL
Objetivou-se neste trabalho determinar a velocidade e a direção dos ventos predominante na região de Tangará da Serra, localizada no Sudoeste do Estado de Mato Grosso. Para isso, foram utilizados dados meteorológicos de 2003 a 2008, coletados com auxílio de um Anemômetro, tipo Universal, instalado a 10 metros acima da superfície do solo, na Estação Meteorológica do INMET (Instituto Nacional de Meteorologia), na Universidade do Estado de Mato Grosso – UNEMAT (Latitude 14º39’; Longitude 57º25’53” e Altitude de 321,5 metros). A direção predominante dos ventos foi caracterizada por meio de análise na freqüência das observações diárias, para cada um dos doze meses do ano. Os meses que apresentaram velocidades mais elevadas foram maio, junho, julho, agosto e setembro. Março apresentou as mais baixas velocidades médias e máximas. Nos doze meses do ano, os ventos diurnos foram mais elevados que os noturnos, os ventos mais fortes ocorreram durante as horas mais quentes do dia, ou seja, das 13 às 17 horas. As rajadas máximas mensais variaram de 15,1 m s-1 em junho a 30,7 m s-1 em agosto. Na maior parte do ano há predominância de ventos provenientes do Nordeste (NE), com exceção do período de agosto e setembro, quando a direção predominante é de ventos vindos do Sul (S).
1. INTRODUCTION
The wind is one of the most important meteorological elements and it has many applications in several research areas, this is still shortly studied, especially in the Mato Grosso State, Brazil. Among those several applications of the wind direction and speed, it is highlighted here its important contribute in the smoke and soot scattering from the sugar-cane straw burning, specially in regions that has some sugar cane factories that has this practice of burning in this culture aiming to facilitate the harvest. Studies about the winds show great applicability: on the evaluation of the winds energy generation potential; on the atmospheric pollution transport and scattering from several sources; on the industries measurement and installation; on the building construction; and also on the agriculture, because the
winds importance in the lowers pollination process.
Studies of winds directions contribute on many activities: winds-break installations, aiming to protect plants from the direct winds action; assistance on industrial installations in urban areas, in way that it´s not affect the residential areas; contribute also to the thermal comfort subject in the architecture and building constructions studies that aim better ventilated constructions, according to the doors and windows positions, faced or not the predominant winds directions; the winds are also important in the subjects connected to the water economy,
because its inluence on the evapotranspiration and water heat
and steam transference (Galvani et al., 1999).
The winds can perform a physical strength on plants, carry particles and matter as salts, pollen, soil, seeds and fungi spores (Gliessman, 2001). The winds-breaks location, useful in the combined agriculture, depends mainly on the winds predominant directions knowledge and it is also a factor that often causes disturbers or harmful impact on the agroecosystem.
The knowledge about the winds behavior in a given region performs a fundamental role on the factors related to the air pollution understanding. The weather conditions enable establish a connection between the polluter source and the receptor, having as reference the pollutants transport and scattering (Torres e Martins, 2005). The pollutants scattering and removal phenomenon are given by the regional atmosphere faces (winds and precipitation states, speeds and directions) and by the local climatic aspects (heat isles and air circulation), in consonance to the surface characteristics (Martins, 1996).
The winds occur by the different pressure between two points, going toward the one that has the lower pressure, and the wind direction is changed as it go far from the surface, hence the lower attrition caused by the altitude (Pereira et al., 2002). Studying the winds directions and speeds in Pelotas-RS, Silva et al. (1997) concluded that in all months of the year occur great incidences of winds toward Northeast (NE). Leite e Filho (2006)
analyzing the average speed and the winds direction in Ponta Grossa – PR concluded that the Northeast (NE) direction was the one of larger occurrence, followed by the Northwest (NW) and East (E) direction.
The Tangará da Serra region, South (SW) of Mato Grosso State, is economically agricultural, it has predominance of large areas of sugar cane cultivation. To this region, aim this work to characterize the winds predominant speeds and directions, as its hour variability behavior.
2. MATERIALS AND METHODS
The hourly data of the winds directions and speeds, collected in the 2003 to 2008 period, through a Anemometer installed 10 meters above the ground surface, that was made available by the INMET – National Meteorological Institute. Those data were collected by the INMET Automatic Weather Station located in the Mato Grosso State University – UNEMAT (14º39’ S; 57º25’ W e 321,5 m), localizada em terreno plano, em local totalmente aberto, com ampla visão do horizonte.
The region is located between two hills (Serra Tapirapuã and Serra of Parecis). The Serra of Parecis is the watershed
of the Amazon basin and the Plata Basin. As classiication of
Köppen, the region’s climate is tropical humid megathermic (Aw), with high temperatures, rain in summer and drought in winter. The local soil is type Oxisol clay texture. The annual average temperature, precipitation and air relative humidity are, respectively, of 24.4oC 1.500 mm and 70% to 80%.
It was calculated the average, maximum and gusts speeds to the six years of the collected data and later it was made descriptive statistics analysis of this data. The predominant
winds directions were deined by the number of observations of its forward a speciied direction in each month. This element was deined by the frequency analyses of the hour observations,
to each months of the year, using the follow equation:
N
n
x
f
(
)
=
(1)in which “f(x)” correspond to the winds occurrence frequency
toward a speciied direction (x); “n” is the number of occurrence
of a specified direction and “N” is the total number of observations.
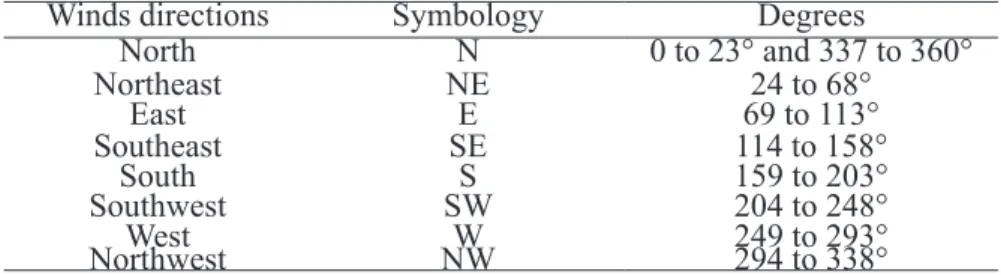
Using the wind rose, it was speciied the eight winds
directions, according to the symbology and the degrees adopted to each of the directions (Table 1).
To obtain the average diurnal and nocturnal speeds, it
was deined as day the period between 07:00 and 18:00 hours, and the night was deined by the periods between the 19:00 and
3. RESULTS AND DISCUSSION
About the winds average speeds, the months that presents the larger values were: May, June, August and September, 3.1; 3.0; 3.3; 3.5; and 3,2 m s-1, respectively (Figure 1). The months with lower speeds were February (2.6 m s-1) and March (2.5 m s-1). August had presented the higher average (3.5 m s-1). To the average speeds, the lower standard deviations was observed in March and June (1.3 m s-1), and the higher deviation occurred in September (1.8 m s-1). Souza e Granja (1997) had studied the winds behavior to the Campo Grande city, MS, and they concluded that March also had presented the speed minimum value, that was 2.1 m s-1; to Dourados city, MS, the month that had presented the higher speed was September, that had 3.6 m s-1.
The maximum absolute monthly speed registered in the period was observed in August, that had 6.0 m s-1. In March the maximum absolute monthly speed (4.8 m s-1) was the lowest, similar the average. In the maximum speeds the standard deviations varied between 2.8 m s-1 in June and 3.0 m s-1 in September. Silva et al. (1997), in winds behavior studies, done in Pelotas city, RS, had observed that the maximum speeds in all months of the year occurred between 0 and 10 m s-1.
The Figure 2 presents the diurnal and nocturnal average speeds values along the six years of collected data. It points that
along the diurnal period the winds have presented higher speed than the nocturnal period. The higher diurnal speed was observed in July, August and September have presented the averages 3.7; 3.9; 3.6 m s-1, respectively. The higher speeds observed to the nocturnal winds was in July, August and September, 2.9; 3.02 e 2.8 m s-1, respectively. The annual average speed to the observed period was 3.4 ms-1 to the diurnal period and 2.5 m s-1 to the nocturnal period.
In average percentage terms, the winds at night was 23.2% lower than the daytime, the month of January showed the greatest difference 35.7% and the month of May the smallest difference between the speeds of the daytime and night winds.
The tendency to the diurnal winds higher than the nocturnal winds, it was because the soil heating along the day, that heats the air, that ascends, and this space is occupied for a colder air. So that it occur a thermal gradient that, then, originates a pressure gradient causing the displacement of the air from the higher pressure zone to the lower pressure zone. At night, as this gradient is lower, the winds speeds is also lower (Senambi, 2004).
Munhoz e Garcia (2008), studying the diurnal and nocturnal speed average in Ituverava, SP, concluded that in the warmer months (September to February) the diurnal winds were higher than the nocturnal ones between 36% and 55%. In the colder months (March to August) the difference reduces, but the
Table 1 - Winds directions, adopted symbology and direction in degrees.
Winds directions Symbology Degrees
North N 0 to 23° and 337 to 360°
Northeast NE 24 to 68°
East E 69 to 113°
Southeast SE 114 to 158°
South S 159 to 203°
Southwest SW 204 to 248°
West W 249 to 293°
Northwest NW 294 to 338°
diurnal winds still were higher than the nocturnal ones between 31% and 53%. The annual average speed was 2.2 m s-1 (diurnal period) and 1.3 m s-1 (nocturnal period). To the study in Tangará da Serra, MT, the annual average values were higher than the observed values to the Ituverava city, SP, given the diurnal annual average 3.4 m s-1, and the nocturnal annual average 2.5 m s-1.
According to the Figure 3, the winds strongest gusts had occurred in August (30 m s-1), October (26.9 m s-1) and November (25.4 m s-1). Most of strongest winds occurred along the warmer period of the day, from 13:00 to 17 hours, placed in the months January to April, June, and August to November. Heldwein et al. (2003) had studied the occurrence of strong
winds in Santa Maria, RS, and veriied that days that have
strong winds gusts occur in the Spring and the weaker ones in Autumn. Along the day, the winds gusts hour average is higher
in the warmer hours of the day. This behavior was kept along all months, presenting the higher standard deviations in August and September, months in which were observed the strongest gusts.
The Table 1 presents the winds directions in February, March, June, July, October, November and December in which occur the winds predominance from the Northeast (NE). In January, April, August and September, the NE was always the second predominant direction. The exception was May, in which winds predominant direction was from the Southeast (SE) and in second place was South (S), so that May presents an inversion in the winds direction compared to the other months.
In April the Northeast (NE) and South (S) directions were in second place with the same percentage (19%), in August the Northeast (NE) and East (E) directions were in second place (18%). The percentile of the winds occurrence from the
Table 1. Winds monthly predominant directions (in %) in Tangará da Serra, MT, in the 2003 to 2008 period.
Predominant wind direction
Month N (%) NE (%) E (%) SE (%) S (%) SW (%) W(%) NW (%)
Jan. 30 22 9 10 7 4 7 11
Feb. 21 25 12 14 12 5 4 7
Mar. 19 23 14 19 13 4 3 5
Apr. 13 19 14 25 19 4 2 4
May 9 16 16 28 26 3 1 1
June 11 24 23 21 15 3 2 1
July 12 24 18 18 20 4 1 3
Aug. 11 18 18 15 27 6 2 3
Sept. 12 16 10 15 26 10 5 6
Oct. 17 21 12 17 15 5 4 9
Nov. 20 25 12 18 12 4 3 6
Dec. 27 29 13 13 6 2 3 7
Northeast (NE) direction varied between 16% in May and September and 29% in December. The winds that come from the North (N) direction were predominant only in January with 30%. In April and May the winds predominant direction was from Southeast (SE) with 25% and 28%, respectively.
In August and September the winds predominant direction was from South (S) with 27% and 26%, respectively. The directions that have presented the lowers percentiles were Northwest (NW), West (W) and Southwest (SW). To the Northwest (NW) direction there was a variation from 1% in May and July to 11% in January. To the West (W) direction, the higher percentile was observed in January (7%) and the lower in May and July, only 1% in both months. The Southwest (SW) direction has varied between 2% and 10% in December and September, respectively.
The second winds predominant direction was from North (N) with percentiles varying between 9% in May and 30% in January. Although the winds from the North (N) direction were predominant only in January, while in February, March, October, November and December, this direction was the second predominant (Table 1).
Studying the winds behavior in Ponta Grossa city, PR,
Leite e Filho (2006) had veriied that in the months of the year
the winds predominant direction was from Northeast (NE) with occurrence percentiles varying between 59.8% in August and 41.42% in February.
The Northeast (NE) winds predominance direction was also observed by other researchers in others related regions. Silva et al. (1997) have studied the winds behavior in the
Pelotas city, RS, and have veriied a great incidence of winds
coming from the Northeast (NE) direction, that although it is not predominant in Autumn, Summer and Spring, it showed a high frequency in this seasons, being always the second predominant
direction, and not differing from the irst predominant in more
than 7%. Souza e Granja (1997), have studied the winds monthly behavior to Campo Grande city, MS, and they have concluded that the winds predominance were from East (E), and occurrence of North (N) direction in January and December, and such annual values were occurrences of 24% East (E), 19.8% North (N), 12.2% Northeast (NE), and 9.2% with no winds.
4. CONCLUSION
There is a predominance of winds from the Northeast and North in mostly of year, excepted by the April with predominance Southeast, May with predominance Southeast and South, August and September period, in which the winds predominant direction is from South (S), and the average speeds are higher. In August the winds had its higher speed in both night and day time. The stronger gusts were observed in the end of the Winter and in the Spring, in which the stronger winds occur in the warmer hours of the day. March had presented the lowest averages in both periods of the day. The winds directions that presented the lowest percentiles were from Northwest (NW), West (W) and Southwest (SW).
5. REFERENCES
GALVANI, E; KLOSOWSKI, E. S; CUNHA, A. R., MARTINS, D. Caracterização da direção predominante do vento em Maringá, PR. Revista Brasileira de Agrometereologia, Santa Maria, v.7, n.1, p. 81-90, 1999.
GLIESSMAN, S. R. Agroecologia; processos ecológicos em agricultura sustentável. 2. ed. -Porto Alegre; Ed. Universidade/ UFRGS, 2001.
HELDWEIN, A. B; STRECK, N. A; BURIOL, G. A; SANDRI, M. A; TRENTIN, G; SPOHR, R. B; SILVA, J. C; ALBERTO, C. M; FARIA, N. S. Freqüência de ocorrência
de ventos fortes em Santa Maria, RS. Revista Brasileira de Agrometeorologia, Santa Maria, v. 11, n. 2, p. 285-291, 2003. LEITE, M. L; FILHO, J. S. V. Avaliação da velocidade média
e direção predominante do vento em Ponta Grossa, PR, Revista Brasileira de Agrometereologia, v 14, n.2, p.157-167, 2006.
MARTINS, L. A. A Temperatura do Ar em Juiz de Fora – MG:
Inluência do Sítio e da Estrutura Urbana. – Departamento de Geograia, Instituto de Geociências e Ciências Exatas/
UNESP – Rio Claro, 1996, 168p. Dissertação (Mestrado
em Geograia).
MUNHOZ, F. C; GARCIA, A. Caracterização da velocidade e direção predominante dos ventos para a localidade de Ituverava, SP, Revista Brasileira de Meteorologia, v.23, n.1, 30-34, 2008.
PEREIRA, A. R; ANGELOCCI, L. R; SENTELHAS, P. C. Agrometeorologia: Fundamentos e aplicações práticas. Guaíba: Livraria e Editora Agropecuária, 2002. 478 p.
SENAMBI – Serviço Nacional de Meteorologia e Hidrologia Del Peru. Aprendendo Meteorologia. In: http://www. senambi.gob.pe.pefaprediendo/apen_meteo.htm. 2004 SILVA, J. B; ZANUSSO, J. T; SILVEIRA, D. L. M; SCHONS, R.
L; LARROZA, E. G. Estudo do comportamento dos ventos em pelotas, RS. Revista Brasileira de Agrometereologia, Santa Maria, v. 5, n. 2, p. 227-235, 1997.
SOUZA, A de; GRANJA, S. C. Estimativas dos parâmetros “c” e “k” do modelo de WEIBULL e da direção dos ventos para Campo Grande e Dourados, MS, Brasil. Revista Brasileira de Agrometeorologia, Santa Maria, v. 5, n. 1, p. 109-114, 1997.
TORRES, F. T. P; MARTINS, L. A. Fatores que inluenciam na
concentração do material particulado inalável na cidade de
Juiz de Fora, MG. Caminhos de geograia - revista on line