J. Braz. Chem. Soc. vol.27 número5
Texto
Imagem
Documentos relacionados
The comparison of results from Figure 3 and Table 1 allowed the selection of phosphate buffer (pH 6.8):ACN (96:4) as the mobile phase composition and either Ace or Symmetry
This study aimed to evaluate the application of different enzymes (pectinase, cellulase and protease) in extraction of sunflower oil, comparing its quality with the oil obtained by
Prior to each UV-Vis spectrophotometric titration, the potentiometric cell was calibrated to evaluate the pH of the solution based on the concentration scale from
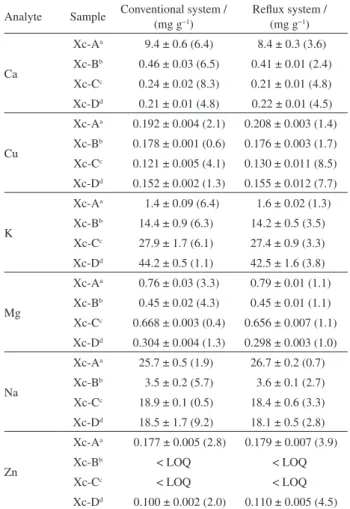
The precision of the proposed procedure is excellent because the relative standard deviation of recovery values ranges between 2.43 and 3.88% for all measurements, including
energy cost for two different applied current densities as a function of the TOC removal for EP and PAEP experiments. Low current densities incur lower energy costs once
After determining the first critical rotor speed, the operating parameters such as rotor speed, dispersed phase and continuous phase flow rate varied to investigate the effect of
The models suggest that lead contained in PCBs selectively migrates to the mixture according to its composition, allowing to predict contamination which may occur with this metal
Selenium concentrations determined using the developed procedure were compared with those obtained using microwave-assisted acid digestion of bovine semen due to the lack
