Common Variation Associated with Breast Cancer
Prognosis
Sajjad Rafiq1, Sofia Khan4, William Tapper1, Andrew Collins1, Rosanna Upstill-Goddard1, Susan Gerty2, Carl Blomqvist5, Kristiina Aittoma¨ki6, Fergus J. Couch3, Jianjun Liu7, Heli Nevanlinna4., Diana Eccles8
*.
1Genetic Epidemiology and Bioinformatics Research Group, Human Genetics, Faculty of Medicine, University of Southampton, Southampton General Hospital, Hants,
United Kingdom,2Clinical Trials Unit, Faculty of Medicine, University of Southampton, Hants, United Kingdom,3Department of Laboratory Medicine and Pathology,
Mayo Clinic, Rochester, Minnesota, United States of America,4Department of Obstetrics and Gynaecology, University of Helsinki and Helsinki University Central Hospital,
Helsinki, Finland,5Department of Oncology, Helsinki University Central Hospital, Helsinki, Finland,6Department of Clinical Genetics, Helsinki University Central Hospital,
Helsinki, Finland,7Human Genetics, Genome Institute of Singapore, Singapore,8Cancer Sciences Division, University of Southampton, School of Medicine, Southampton
General Hospital, Hants, United Kingdom
Abstract
Objective:Genome wide association studies (GWAs) of breast cancer mortality have identified few potential associations. The concordance between these studies is unclear. In this study, we used a meta-analysis of two prognostic GWAs and a replication cohort to identify the strongest associations and to evaluate the loci suggested in previous studies. We attempt to identify those SNPs which could impact overall survival irrespective of the age of onset.
Methods:To facilitate the meta-analysis and to refine the association signals, SNPs were imputed using data from the 1000 genomes project. Cox-proportional hazard models were used to estimate hazard ratios (HR) in 536 patients from the POSH cohort (Prospective study of Outcomes in Sporadic versus Hereditary breast cancer) and 805 patients from the HEBCS cohort (Helsinki Breast Cancer Study). These hazard ratios were combined using a Mantel-Haenszel fixed effects meta-analysis and a p-value threshold of 561028 was used to determine significance. Replication was performed in 1523 additional patients from the POSH study.
Results:Although no SNPs achieved genome wide significance, three SNPs have significant association in the replication cohort and combined p-values less than 5.661026. These SNPs are; rs421379 which is 556 kb upstream of ARRDC3 (HR = 1.49, 95% confidence interval (CI) = 1.27–1.75, P = 1.161026), rs12358475 which is between ECHDC3and PROSER2 (HR = 0.75, CI = 0.67–0.85, P = 1.861026), and rs1728400 which is betweenLINC00917andFOXF1.
Conclusions:In a genome wide meta-analysis of two independent cohorts from UK and Finland, we identified potential associations at three distinct loci. Phenotypic heterogeneity and relatively small sample sizes may explain the lack of genome wide significant findings. However, the replication at three SNPs in the validation cohort shows promise for future studies in larger cohorts. We did not find strong evidence for concordance between the few associations highlighted by previous GWAs of breast cancer survival and this study.
Citation:Rafiq S, Khan S, Tapper W, Collins A, Upstill-Goddard R, et al. (2014) A Genome Wide Meta-Analysis Study for Identification of Common Variation Associated with Breast Cancer Prognosis. PLoS ONE 9(12): e101488. doi:10.1371/journal.pone.0101488
Editor:Xiaoping Miao, MOE Key Laboratory of Environment and Health, School of Public Health, Tongji Medical College, Huazhong University of Science and Technology, China
ReceivedDecember 13, 2013;AcceptedJune 9, 2014;PublishedDecember 19, 2014
Copyright:ß2014 Rafiq et al. This is an open-access article distributed under the terms of the Creative Commons Attribution License, which permits unrestricted use, distribution, and reproduction in any medium, provided the original author and source are credited.
Funding:This research was supported in part by National Institutes of Health grant CA128978, and grants from the Komen Foundation for the Cure and the Breast Cancer Research Foundation (BCRF) to F.J.C. The POSH study is supported by Breast Cancer Campaign grant number 2010NovPR62. Funding for the POSH study was also provided by The Wessex Cancer Trust and Cancer Research UK (grant refs A7572, A11699, C22524). The Helsinki study was financially supported by the Helsinki University Central Hospital Research Fund, Academy of Finland (132473), the Finnish Cancer Society, The Nordic Cancer Union, and the Sigrid Juselius Foundation. The funders had no role in study design, data collection and analysis, decision to publish, or preparation of the manuscript.
Competing Interests:The authors have declared that no competing interests exist. * Email: [email protected]
.These authors contributed equally to this work.
Introduction
Although the incidence of breast cancer has been relatively stable since 2003, at 157 new cases per 100,000, it remains the most common cancer in the UK and accounts for 31% of new cancer cases in women. The latest age-standardised survival rate for breast cancer in England is predicted to be 85% at 5 years,
improved, the response to treatment and longevity of patients is often unpredictable even between those with similar tumours and general health. More recently tumour genomic profiling experi-ments have suggested cancer molecular signatures may give more accurate prognostic information [2–4]. These signatures may predict outcome better than conventional histopathology based risk algorithms but are not in routine clinical use [5].
Familial studies suggest a genetic component for breast cancer prognosis [6,7]. The familial contribution to prognosis may arise as a result of the background genotype affecting acquired tumour characteristics which influence prognosis. Indeed high penetrance predisposition genes which lead to the consistent development of specific breast tumour sub-types have been identified [8,9]. Low penetrance risk SNPs tend to be associated with either ER positive or ER negative breast cancer but often not both [10–14]. In addition there may be pharmacogenomic effects of background genotype on response to cancer treatment. It is anticipated that genome wide association studies (GWAs) with sufficient sample size and genetic coverage may lead to novel insights into common inherited genetic variants which influence prognosis.
In the past few years several GWAs of breast cancer survival have been reported. These studies have had limited success and none of them have identified variants that are associated at genome wide levels of significance [15–19]. While small sample sizes are likely to be of one of the main factors responsible for the modest levels of significance and lack of concordance between the GWAs; small effect sizes, incomplete genetic coverage, and phenotypic heterogeneity could also contribute and need to be addressed.
In this study, we used a meta-analysis to combine evidence from two GWAs consisting of 536 patients from the POSH cohort (Prospective study of Outcomes in Sporadic versus Hereditary breast cancer) and 805 patients from the HEBCS cohort (Helsinki Breast Cancer Study). A further 1523 patients from the POSH cohort were used to validate the most significant SNPs. With a combined sample size of 2864 participants, this analysis has 81% power to detect effects of modest sizes (HR$1.25, p = 0.05) and with relatively rare SNPs (MAF = 10%). The cohorts used in this analysis have a high incidence of breast cancer related mortality and well documented tumour and treatment data which make them ideal for the purpose of exploring genetic factors influencing
prognosis. In addition, these cohorts are similar in terms of their patient recruitment from regional medical centres, duration of prospective follow-up, and documentation of breast cancer related mortality.
Materials and Methods
All participants from POSH and Helsinki gave written informed consent, all were female. The POSH study received approval from the South and West Multi-centre Research Ethics Committee (MREC 00/6/69). The Helsinki breast cancer study received approval from the Ethical Committee of the Departments of Oncology and Obstetrics and Gynaecology, Helsinki University Central Hospital.
Breast cancer patients and genotyping
Breast cancer cases were selected from the POSH study and the Helsinki breast cancer family Study (HEBCS). POSH study participants were diagnosed with invasive breast cancer and were aged forty or younger at diagnosis, the mean age at diagnosis in this cohort is 36 years. Recruitments to the POSH cohort were made between January 2000 and January 2008 from oncology clinics across the UK and the majority (98%) of patients presented symptomatically. The recruitment, data collection and follow up procedures for the POSH study participants are described in detail elsewhere [20].
The HEBCS samples were collected in Helsinki, Finland and are representative of breast cancer case series at the recruitment centre during the collection periods (unselected sporadic and familial cases collected between 1997 and 2004). All of the cases used in the meta-analysis had histopathological and survival data. Detailed information on the patient series and data collection has previously been published [21]. The mean age at diagnosis was 56.8 years.
Stage 1 discovery dataset
In stage-1, 574 participants from the POSH study were selected for the discovery phase of the analysis aimed at hypothesis generation [20]. In keeping with a recent GWAS which identified five new breast cancer susceptibility loci by enriching cases by recruiting individuals with family history of breast cancer [22],
Table 1.Clinical characteristics of Study participants from the discovery and replication sets.
Study
Number of breast cancer deaths
Total number of Breast cancer patients
Estrogen Receptor (ER) status-Negative (%)
Average age at Diagnosis (±SD)
Follow-up time
in years (±SD) N-stage M-stage T-stage POSH stage-1
(Discovery)
236 536 370 (69.2%) 35.7 (3.8) 4.1 (2.0) N0–248
N1–262 NA-26
M0–481 M1–50 NA-5
T1–227 T2–207 T3–20 T4–31 NA-51 HEBCS
(Discovery)
301 805 230 (30.0%)
NA-39
56.8 (12.4) 7.2 (2.9) N0–338
N1–446 NA-21
M0–740 M1–57 NA-8
T1–390 T2–304 T3–50 T4–47 NA-14 POSH stage-2
(Replication)
221 1415 362 (23.7%) 35.8 (3.5) 5.2 (1.7) N0–705
N1–810 NA-8
M0–1506 M1–18 NA-1
T1–692 T2–494 T3–49 T4–34 NA-254 HEBCS: Helsinki Breast Cancer Study; NA = not available, HER2 = Human Epidermal Growth Factor Receptor 2, N-stage = metastasis to lymph node, M-stage = metastasis. doi:10.1371/journal.pone.0101488.t001
Role of SNPs in Breast Cancer Prognosis
with lead SNP at a locus) and their association estimates (adjusted for ER-status).
Lead SNP Chr Position Alleles MAF
POSH stage-1 pre meta-analysis HR (95% CI)
HEBCS pre meta-analysis HR (95% CI)
POSH stage-1 and HEBCS meta-analysis
HR (95% Confidence Intervals)
POSH stage-1 and HEBCS meta-analysis
p-value Genes
rs12026014 1 39060495 G/A 0.39 0.70 (0.57–0.86) 0.80 (0.68–0.95) 0.76 (0.69–0.84) 2.8461025 POU3F1: LOC400750
rs12735344 1 111559848 G/T 0.22 0.71 (0.58–0.89) 0.75 (0.61–0.88) 0.74 (0.67–0.82) 3.4661025 CCNT2P1
rs1149185 1 111546531 C/T 0.50 1.51 (1.26–1.80) 1.21 (1.03–1.42) 1.34 (1.22–1.46) 2.1461026 C1orf103: TMEM77
rs1578790 1 111575921 G/T 0.50 1.47 (1.23–1.77) 1.16 (0.99–1.36) 1.28 (1.16–1.52) 3.3161025 C1orf103: TMEM77
rs11723068 4 7797435 G/A 0.12 1.99 (1.51–2.64) 1.23 (0.99–1.54) 1.48 (1.18–1.99) 9.8361026 AFAP1
rs7441398 4 63653135 G/T 0.13 1.43 (1.14–1.79) 1.43 (1.14–1.79) 1.43 (1.16–1.85) 1.2261025 LPHN3: LOC644548
rs10457678 6 139122240 A/G 0.24 1.39 (1.15–1.72) 1.30 (1.10–1.55) 1.34 (1.21–1.47) 9.3861026 ECT2L
rs1525677 7 110302695 T/C 0.31 1.31 (1.09–1.58) 1.31 (1.10–1.56) 1.31 (1.18–1.44) 2.7461025 IMMP2L
rs13274039 8 8111659 A/G 0.28 1.15 (0.96–1.39) 1.41 (1.05–1.47) 1.29 (1.17–1.41) 2.9261025 FLJ10661: PRAGMIN
rs12358475 10 11848792 G/A 0.23 0.73 (0.59–0.90) 0.71 (0.58–0.86) 0.72 (0.65–0.80) 6.7761026 ECHDC3: C10orf47
rs2921923 10 55662089 A/G 0.49 1.40 (1.16–1.68) 1.26 (1.09–1.49) 1.32 (1.20–1.44) 4.7361026
PCDH15
rs10777864 12 97838685 A/C 0.40 0.79 (0.65–0.95) 0.74 (0.62–0.88) 0.76 (0.63–0.89) 3.2861025 RMST
rs1499384 14 43049048 A/G 0.04 1.10 (0.76–1.59) 1.87 (1.44–2.42) 1.56 (1.35–1.78) 3.5661025 LRFN5: FSCB
rs8060556 16 6868511 C/T 0.23 1.29 (1.04–1.59) 1.43 (1.17–1.74) 1.36 (1.14–1.69) 2.9561025 RBFOX1
rs1728400 16 86434446 C/A 0.38 1.37 (1.15–1.64) 1.25 (1.06–1.47) 1.30 (1.13–1.55) 1.4061025 LOC732275: FOXF1
rs8045253 16 86437767 T/C 0.34 1.28 (1.07–1.52) 1.32 (1.11–1.57) 1.30 (1.18–1.43) 2.8261025 LOC732275: FOXF1
rs9978224 21 41309823 G/A 0.29 1.26 (1.03–1.54) 1.38 (1.16–1.65) 1.33 (1.13–1.61) 2.6161025 TMPRSS3
rs421379 5 91275313 G/A 0.08 1.98 (1.46–2.70) 1.24 (0.91–1.68) 1.55 (1.25–1.93) 7.361025 ARRDC3
doi:10.1371/journal.pone.0101488.t002
Role
of
SNPs
in
Breast
Cancer
ONE
|
www.ploson
e.org
3
December
2014
|
Volume
9
|
Issue
sample selection for stage-1 utilised an ‘‘extreme phenotype’’ approach, this included selection of triple negative cases genotyped in a collaboration aimed at risk associated SNPs in triple negative breast cancer [11] and a second group enriched for exceptionally short survival genotyped as described previously [23]. We observed 236 breast cancer specific deaths in the POSH discovery set patients.
In HEBCS, 805 cases were selected from the patient series described earlier [22], including 423 unselected cases collected between years 1997 and 2000 as well as 140 cases collected between years 2001 and 2004, with 242 additional familial cases. The GWAS series was specifically enriched for cases with reduced survival, in the form of distant metastasis or death at the time of the initiation of the study in 2008, resulting in 301 breast cancer specific deaths at the time of analysis.
Stage-2 replication Samples
A further 1523 breast cancer patients from the POSH study [20] unselected for any survival differential were used for replication in stage-2. At stage 2, there were 293 breast cancer specific deaths.
Genome wide genotyping
Genotyping of 574 POSH phase-1 breast cancer cases was conducted using the Illumina 660-Quad SNP array. Genotyping was conducted in two separate batches at two locations. The Mayo Clinic (Rochester, Minnesota, USA) genotyped 274 triple negative breast cancers (negative for ER, PR and HER2) [11]. The remaining 300 POSH patients were genotyped at the Genome Institute of Singapore (GIS), National University of Singapore; these were selected based on either short duration of breast cancer specific survival (,2 years) or long duration of breast cancer specific survival (.4 years). In order to ensure complete harmonisation of genotype calling, the intensity data from GIS and MAYO were combined and the genotyping module of Illumina’s Genome Studio software was used to generate genotypes. A GenCall threshold of 0.15 was selected and the HumanHap660 annotation file was used. Of the 300 samples genotyped in Singapore, 3 were excluded from analysis because they had sample call rates lower than 95%. No individuals among the two hundred and seventy four triple negative cohort genotyped at the Mayo clinic were excluded from analysis based on poor call rate. The genotyping accuracy for SNPs genotyped by GIS and Mayo were over 99%.
Genotyping of the HEBCS samples was conducted using the Illumina 550 platform as previously described [24]. SNP quality control (QC) measures were implemented using Plink. The initial sample size of 832 was reduced to 805, following quality control measures to remove patients with; unidentified affectation status and gender discordance (n = 6), familial relationships and poor SNP call rate (,95% n = 18), and missing phenotype information (n = 1). Genotypes were determined using the Genome Studio, a GenCall threshold of 0.15, and the HumanHap550-duo v3 annotation file.
Further quality control of the genotypic data from POSH and HEBCS was used to exclude rare SNPs with a MAF#0.01, and SNPs with significant deviation from Hardy-Weinberg equilibrium (HWE) p-value#0.0001. To select SNPs for generation of pairwise identity by state (IBS) estimates, we used plink to perform genome wide linkage disequilibrium (LD)-based pruning with an r2cut-off of 0.5 and a window of 50 SNPs. Multi-dimensional scaling (MDS) plots were generated on the basis of a square matrix of IBS values between all pairs of individuals. To act as a reference, individuals with known African, Asian, and Caucasian ancestry from
Table 3. Replication of most significant associations from the discovery set meta-analysis in the replication samples. Lead SNP Chr Position Alleles MAF Stage-2 replication HR (95% Confidence Interval)
Stage-2 replication p-values
All
stages
meta-analysis HR (95% Confidence
Interval) All stages meta-analysis p-value p-value for Q-statistic Genes rs7441398 4 63653135 G/T 0 .13 1.12 (0.90–1.39) 0.28 1.31 (1.15–1.49) 3.3 6 10 2 5 0.21 LPHN3: LOC644548 rs1525677 7 110302695 T/C 0.31 1.08 (0.92–1.27) 0.35 1.22 (1.10–1.34) 0.0001 0.18 IMMP2L rs12358475 1 0 11848792 G/A 0 .23 0.82 (0.67–1.00) 0.05 0.75 (0.67–0.84) 1.8 6 10 2 6 0.57 ECHDC3: C10orf47 rs2921923 10 55662089 A/G 0 .49 1.03 (0.88–1.21) 0.69 1.20 (1.10–1.33) 0.0001 0.04 PCDH15 rs10777864 1 2 97838685 A/C 0 .41 0.91 (0.77–1.07) 0.25 0.82 (0.74–0.90) 8.0 6 10 2 5 0.22 RMST rs8060556 16 6868511 C /T 0.23 1.01 (0.84–1.22) 0.75 1.22 (1.09–1.36) 0.001 0 .04 RBFOX1 rs1728400 16 86434446 C/A 0 .38 1.16 (0.99–1.37) 0.07 1.25 (1.13–1.39) 5.6 6 10 2 6 0.39 LOC732275: FOXF1 rs8045253 16 86437767 T/C 0.34 1.04 (0.88–1.23) 0.65 1.17 (1.05–1.31) 0.003 0 .04 LOC732275: FOXF1 rs421379 5 91275313 G/A 0 .08 1.41 (1.11–1.8) 0.005 1 .49 (1.27–1.75) 1.1 6 10 2 6 0.09 ARRDC3 Results are presented for those SNPs which remained associated in the same d irection in the validation set as in the d iscovery set (adjusted for ER-sta tus). doi:10.1371/journal.pone. 0101488.t003
Role of SNPs in Breast Cancer Prognosis
HapMap were also used for the MDS analysis [25]. The MDS analysis excluded 35 cases from POSH and no cases from Helsinki whose genotypes did not concur with a European ancestry.
Statistical Analysis
We used GenABEL [26] in R.2.14.0 environment to perform survival analysis using post-QC genome wide SNP data. Follow-up time was calculated as the difference between the date of diagnosis of breast cancer and the date of death due to breast cancer or the date of last follow-up if still alive and right-censored at 10 years. Distant disease free interval was calculated as the time from diagnosis to occurrence of metastasis. We excluded patients with contralateral or ipsilateral cancers for testing association with distant disease free interval. All the Cox-proportional hazard models were adjusted for ER-status. Kaplan-Meier plots were generated using STATA v11.0 and IBM SPSS statistics 19. Mantel-Haenszel Fixed effects meta-analysis was performed using the metan module in STATA v11.0 [27]. For multivariate models we used ER-status, metastasis stage (0 or 1), nodal stage (1 = no nodes positive, 2 = 1–3 nodes positive, 3 = more than 3 nodes positive) and tumour size (centimetres) as covariates.
Cochran’s Q-statistic and the resultant p-value was used to detect heterogeneity in association estimates between POSH and HEBCS. Genome wide meta-analysis was performed using MetABEL [28].
Genome wide imputation and meta-analysis
We imputed genome wide SNP information in POSH and HEBCS based on European phase 1 and release version 3 haplotypes. The reference haplotypes are derived from the 1000 genomes project which is the most comprehensive catalogue of human genetic variation including SNP, Indels and CNVs. Quality control measures applied to imputed data included excluding SNPs with HWE p-value,161026, MAF ,5%; and
genotyping call rate ,90% and individuals call rate ,90%. Genome wide survival analysis of imputed information was performed in R-2.14.0 using GenABEL. Meta-analysis of results from GenABEL was performed using MetABEL. For imputing data we used MACH (http://www.sph.umich.edu/csg/abecasis/ MACH/index.html). We used VCFtools - v0.1.9.0 to generate plink format files from output files generated by MACH. The reference haplotypes for 1000 genomes project were downloaded from MACH software’s download page. We used Phase I version 3 European reference haplotypes for imputation analysis.
Manhattan and Regional plots
Manhattan and QQ-plots were generated in R using the plot command. Regional plots were generated using LocusZoom [29].
Sample size calculations
Sample size calculations were performed in R.2.14.2 using survSNP package. The event rate used for power calculations was 0.29 and a two-sided alpha of 0.05 was applied.
Gene Expression variation by SNP
We used Genevar 3.2.0 to study variation in expression levels by SNP genotypes available from the MuTHER pilot project while using NCBI Build 36 Ensembl 54 as reference [30]. Twin pairs were divided into two groups of unrelated individuals. Expression data from Lymphoblastoid cell lines are reported here. In addition we used SNP and CNV annotation database (scandb) [31] that uses the lymphoblastoid cell line expression data derived from 90 HapMap CEU samples in trios [32].
Prediction of transcription factor binding site changes The putative changes on transcription factor binding sites caused by the variants were predictedin silicowith MatInspector Figure 1. Manhattan plot of results from genome wide meta-analysis of POSH stage-1 and HEBCS hazard ratios and 95% confidence intervals.The 25 most associated SNPs are highlighted in green.
within Genomatix software suite v2.5 (Genomatix Software GmbH) [33].
Results
POSH stage-1 and HEBCS meta-analysis
Genome wide genotype data were available from 536Caucasian participants of the POSH study and 805 Caucasian participants of the HEBCS study. A total of 475,141 SNPs with observed genotypes were available for meta-analysis in both the studies after excluding SNPs based on QC criteria. In stage-1 we used fixed-effects meta-analysis to pool hazard ratio estimates from the 536 POSH and 805 Helsinki breast cancer patients (Table 1). In the two study meta-analysis we found five SNPs which were associated at p-values lower than 9.961026
(Table 2, Figure 1). The 25 most associated loci were selected for replication in POSH stage-2 patients. For loci with more than one SNP associated with survival, the most significant SNP and any other SNP(s) from the same locus which were not in high LD with the lead SNP (r2,0.6) were selected for follow up in stage-2 (Table 3).
Replication testing in POSH stage-2 samples
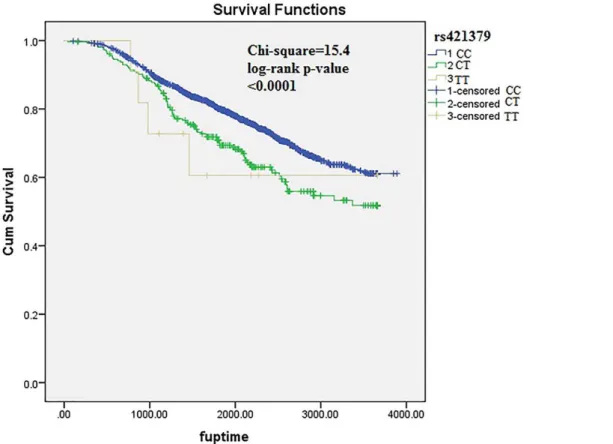
A total of 18 SNPs with independent association signals were tested for replication in POSH stage-2 validation samples (n = 1523). One SNP demonstrated high duplicate error rate (. 8%) and was excluded from analysis. Of the 18 SNPs which were formally tested for replication, two demonstrated replication signals in the validation cohort. Nine of the eighteen SNPs which were tested for replication were observed to be associated in the same direction as in the POSH and HEBCS meta-analysis. In the stage-1 and stage-2 meta-analysis the strongest association signal was observed at rs421379. The minor allele of rs421379 is found to be associated with a higher risk of breast cancer related death (HR (95% CI) = 1.49 (1.27–1.75), p = 1.161026) (Figure 2). The p-value for Cochran’s heterogeneity test Q-statistic was not indicative of heterogeneity in meta-analysis estimate (p = 0.09). This variant was previously identified as the most significantly associated variant in a two stage GWAs for breast cancer survival in early onset cases from POSH. A weak replication signal in HEBCS allowed this SNP to be identified as the most strongly associated variant in this study too (Figure 2). The second most significant variant was located at 10p14, where the minor allele of rs12358475 was associated with protective effect on breast cancer mortality (HR (95% CI) = 0.75 (0.67–0.75), p = 1.861026) (Figure 3). We observed another strong association with rs1728400 which is 113.6 kb upstream of the FOXF1 locus (Table 3). In addition, the three SNPs (rs421379, rs12358475 and rs1728400) were also associated with distant disease free survival in the same direction as those observed for overall survival times, although none of these reached a genome wide level of significance (Table 4).
Genome wide imputation and meta-analysis
Following quality control of imputed data we had 7105428 SNPs available (maf$5%) in POSH stage-1 patients and 7353135 SNPs available (maf$5%) in the HEBCS study. In the two study analysis we had close to 6.5 million SNPs available for meta-analysis. We did not identify any novel SNPs as associated with survival at p-values smaller than those observed using genotyped SNPs. Table 4. Associations of the most significantly associated SNPs from the discovery set s with disease free survival (adjusted for ER-status). Lead SNP Chr Position Alleles MAF Stage 2 1 a ssociation (95% Confidence Interval) HEBC associations Stage-2 association (95% Confidence Interval) All stages meta-analysis p-value p-value for Q-statistic rs7441398 4 63653135 G/T 0 .13 1.41 (1.12–1.77) 1.11 (0.88–1.42) 1.07 (0.91–1.26) 0.01 0.15 rs1525677 7 110302695 T/C 0.31 1.21 (1.0–1.45) 1.14 (0.96–1.35) 1.05 (0.88–1.24) 0.02 0.56 rs12358475 1 0 11848792 G/A 0 .23 0.83 (0.67–1.02) 0.78 (0.65–0.94) 0.86 (0.70–1.05) 0.001 0.77 rs2921923 10 55662089 A/G 0 .49 1.42 (1.19–1.71) 1.31 (1.12–1.52) 1.08 (0.91–1.27) 3.9 6 10 2 6 0.08 rs10777864 1 2 97838685 A/C 0 .41 0.80 (0.66–0.96) 0.72 (0.60–0.85) 1.07 (0.91–1.26) 0.005 0.003 rs8060556 16 6868511 C /T 0.23 1.20 (0.97–1.48) 1.30 (1.07–1.57) 0.94 (0.77–1.15) 0.03 0.06 rs1728400 16 86434446 C/A 0 .38 1.27 (1.07–1.52) 1.21 (1.03–1.41) 1.17 (0.99–1.38) 5.7 6 10 2 5 0.81 rs8045253 16 86437767 T/C 0.34 1.27 (1.07–1.51) 1.26 (1.07–1.48) 0.90 (0.75–1.06) 0.009 0.006 rs421379 5 91275313 G/A 0 .08 1.69 (1.24–2.30) 1.04 (0.76–1.43) 1.32 (0.90–1.93) 0.003 0.10 Results are presented for those SNPs which remained associated in the same d irection in the replication set as in the discovery set. doi:10.1371/journal.pone. 0101488.t004
Role of SNPs in Breast Cancer Prognosis
Figure 2. Kaplan-Meier plots depicting breast cancer related survival in response to rs421379 genotypes in pooled POSH stage-1, HEBCS and POSH stage-2 samples.
doi:10.1371/journal.pone.0101488.g002
Figure 3. Kaplan-Meier plots depicting breast cancer related survival in response to rs12358475 genotypes in pooled POSH stage-1, HEBCS and POSH stage-2 sample.
Gene Expression variation by SNP in publically available database
We queried the Genevar 3.2.0 and SNP and CNV annotation database (scandb) to identify Cis or Tran’s eQTL effects resulting from rs12358475, rs421379 and rs1728400. No associations of rs12358475 and rs1728400 with expression of any nearby genes were noticed in Genevar. In scandb too there were no strong trans-effect associations observed with rs12358475 and rs1728400. In Scandb we observed that rs421379 had impact on expression of
ABCD1(p = 1610–5) andRAB34(p = 9610–5).
Univariate associations of most associated SNPs with N-stage, M-N-stage, T-stage and ER-status
In univariate analysis we did not observe any strong associations of rs12358475 with ER-status, N-stage, M-stage and T-stage. A nominally significant association with N-stage did not survive correction for multiple testing (Table 5). The SNP rs1728400 demonstrated weak associations with M-stage and T-stage (Table 5). No significant association of rs421379 with any of the clinical variables were observed.
Strength of association of SNPs most associated with survival in multivariate models
In pooled analysis involving the discovery and replication samples we observed a slight decrease in the strength of association at the rs421379 and rs12358475 variants. A prominent decline in association statistics at the rs1728400 variant was observed. The HR’s for rs421379 and rs12358475 after adjusting for N-stage, M-stage, ER-status, and tumour size were 1.41 (1.15–1.72), p = 0.001 and 0.85 (0.75–0.97), p = 0.01. The observed HR for rs1728400 was 1.04 (0.94–1.15) p = 0.46.
Discussion
In this study we report a genome wide meta-analysis for identifying genetic variants associated with breast cancer related mortality. In combined meta-analysis involving 2864 individuals the strongest associations that we have identified locate to three SNPs at chromosomes 5, 10 and 16. We have previously discussed the potential biochemical pathways by which rs421379 could impact survival times [19]. It is important to note that the previous GWAs study that we had undertaken was performed exclusively in early onset cases alone. As such the findings from the current study are potentially important as these suggest a wider role for this variant in altering survival times in older breast cancer patients. We did not observe any significant effect of rs12358475 and rs421379 on clinical factors associated with breast cancer mortality suggesting that fluctuations in levels of clinical variables could be a by-product of disease rather than being driving factors.
rs12358475 is intergenic between ECHDC3 (64 kb down-stream) and C10orf47 (16 kb updown-stream), and 113 kb upstream of
UPF2.ECHDC3encodes enoyl CoA hydratase domain contain-ing 3 which has been described as a new inhibitor of mitochondrial fatty acid oxidation [34]. Although the clinical significance of this protein is not clear, it has been found to be differentially expressed in different breast cancer subtypes in mouse models [35].
ECDHC3has also been shown to be differentially expressed in
acute coronary syndrome [36].UPG2is involved in both mRNA nuclear export and mRNA surveillance and initiates nonsense-mediated mRNA decay (NMD) [37]. rs12358475 is predicted to disrupt a binding site for transcription factorsETS1 andNFAT.
ETS-1 is overexpressed in human breast cancer and this is indicative of poorer prognosis [38–40].
Table
5.
Associations
of
SNPs
with
nominal
replication
signals
with
clinical
characteristics
associated
with
breast
cancer
in
a
pooled
set
of
discovery
and
replication
cohorts.
N-Stage
M-Stage
Estrogen
Receptor
status
(0
=
positive,
1
=
negative)
T-stage
SNP
Odds Ratio
95%
Confidence
Interval
p-value
Odds Ratio
95%
Confidence
Interval
p-value
Odds Ratio
95%
Confidence
Interval
p-value
Odds Ratio 95% Confidence Interval
p-value
rs12358475
0
.88
0.78–0.99
0.04
0.94
0.70–1.27
0.70
1.09
0.96–1.24
0.16
0
.96
0.85–1.08
0.49
rs421379
1
.06
0.83–1.35
0.65
1.25
0.93–1.67
0.14
1.09
0.89–1.34
0.39
0
.98
0.77–1.25
0.88
rs1728400
1.09
0.96–1.22
0.17
1.30
0.99–1.70
0.05
1.07
0.9501.21
0.29
1
.11
0.99–1.24
0.05
N-stage
=
metastasis
to
lymph
node,
M-stage
=
metastasis
stage
and
T-stage
=
Tumour
stage.
doi:10.1371/journal.pone.
0101488.t005
Role of SNPs in Breast Cancer Prognosis
rs1728400 lies close to theFOXF1 locus which is a putative
tumour suppressor gene. This variant has previously been associated with oesophageal adenocarcinoma along with other SNPs close to rs1728400 which demonstrated even stronger associations [41]. As such if rs1728400t has a replicable impact on breast cancer prognosis then it could act via a different set of transcription factors than those activated in oesophageal carcino-ma.
Although the study reported here is not the largest study undertaken for identifying common variants associated with breast cancer mortality [15,16], it has several methodological strengths. It is the first study to Meta-analyse associations of common genetic variants with breast cancer related mortality on a genome wide level across two independent prospective studies of breast cancer patients. Further both POSH and HEBCS are prospective studies of breast cancer patients who were recruited in similar clinical settings and both cohorts have relatively high breast cancer specific mortality. As such, heterogeneity between causes of death is reduced in the meta-analysis. With respect to potential tumour phenotypic heterogeneity both studies were not selected for specific breast tumour sub-types so this remains a potential methodological problem if the effect of SNPs relates to a particular tumour sub-type or a particular modality of treatment.
It was encouraging to note that 9 off the 18 SNPs which we had marked for replication testing were associated in the same direction as in the discovery set. Furthermore 4 of the 18 SNPs which were tested for replication had previously been identified as amongst the top 50 associations in GWAs of breast cancer mortality in early onset patients. rs11723068, rs11491815, rs421379 and rs1578790 were the first, fourth, eighteenth and 20thmost strongly associated SNPs among the top 50 association [19].
Although previous studies have not described any SNPs as irrevocably associated with survival at genome wide levels of significance [15,18], we attempted to test associations of the most significant SNPs from these studies. None of the 10 SNPs which Azzato et al [15] tested for replication in the SEARCH study were associated at p-values#0.05 in the POSH and HEBCS meta-analysis results. The strongest replication signal we identified was with rs17299684 (HR = 1.15, p = 0.07). Similarly the two SNPs highlighted by Shu et al [18] as potentially associated with survival in the Chinese population, were not associated in our meta-analysis (rs3784099, HR = 0.94, P = 0.37 and rs9934948, HR = 1.09, P = 0.32). The association of SNP rs3803662 (TOX3), highlighted by Fasching et al [16], as potentially associated with breast cancer specific survival did not replicate in our meta-analysis (HR = 0.90, p = 0.09). The lone SNP
highlighted by Azzato et al [17], as associated with survival in ER-negative patients was not available in the genome wide genotyped or imputed data, further no proxies at r2
$0.6 were identified based on HapMap phase 3 data. So unfortunately replication of this SNP could not be tested in our study.
Future studies with a similar ascertainment framework but with larger sample size, detailed tumour sub-type phenotyping and similar treatment modalities will be required to allow sub-type specific patient cohorts to be used for discovery and validation. A more detailed search for variants with MAF ,0.05 may be necessary to fully comprehend the extent of intrinsic host genetic factors in determining breast cancer prognosis.
The main strengths of this study are the high genetic coverage achieved by using the Illumina 550 K and Illumin660 K chips in the Helsinki and POSH studies respectively. In addition we have also performed comprehensive imputation of common genetic variation (maf .= 5%) based on the LD patterns in the 1000 genomes project. We had sufficient statistical power to detect genetic variants which were associated with survival at HR$1.23 while studying SNPs with maf$10%. Future studies using well annotated collaborative samples will be needed to perform sub-type specific analysis and replication to detect small effect sizes. Such a strategy has the potential to identify multiple genetic variants which are associated at HRs lower than 1.20. However a trade-off between the increases in effect sizes that may result from studying associations in specific homogeneous sub-groups may mitigate smaller sample sizes.
Supporting Information
Checklist S1 PRISMA Checklist. (DOC)
Acknowledgments
We would like to thank Drs. Kirsimari Aaltonen, Dario Greco, Xiaofeng Dai, Pa¨ivi Heikkila¨ and Karl von Smitten, as well as Tuomas Heikkinen, M.Sc. for their help with the HEBCS patient samples and data, and research nurses Hanna Ja¨ntti and Irja Erkkila¨ for their assistance in the HEBCS data collection and management. The authors thank Nikki Graham (DNA bank) and the staff of the Southampton CRUK Centre Tissue Bank.
Author Contributions
Conceived and designed the experiments: DE HN AC SR WT. Performed the experiments: SR SK RUG SG KA FJC JL. Analyzed the data: SR SK WT. Contributed reagents/materials/analysis tools: FJC JL DE HN SG KA CB. Wrote the paper: SR SK HN DE.
References
1. Office for national statistics website. Available: http://www.statistics.gov.uk/ hub/index.html. Acessed 2014 Mar 17.
2. van ’t Veer LJ, Dai H, van de Vijver MJ, He YD, Hart AA, et al. (2002) Gene expression profiling predicts clinical outcome of breast cancer. Nature 415: 530– 536.
3. Buyse M, Loi S, van’t Veer L, Viale G, Delorenzi M, et al. (2006) Validation and clinical utility of a 70-gene prognostic signature for women with node-negative breast cancer. Journal of the National Cancer Institute 98: 1183–1192. 4. Paik S, Shak S, Tang G, Kim C, Baker J, et al. (2004) A multigene assay to
predict recurrence of tamoxifen-treated, node-negative breast cancer. N Engl J Med 351: 2817–2826.
5. Sotiriou C and Pusztai L (2009) Gene-expression signatures in breast cancer. N Engl J Med 360: 790–800.
6. Lindstrom LS, Hall P, Hartman M, Wiklund F, Gronberg H, et al. (2007) Familial concordance in cancer survival: a Swedish population-based study. Lancet Oncol 8: 1001–1006.
7. Hartman M, Lindstrom L, Dickman PW, Adami HO, Hall P, et al. (2007) Is breast cancer prognosis inherited. Breast Cancer Res Tr 9.
8. Lakhani SR, Reis-Filho JS, Fulford L, Penault-Llorca F, van der Vijver M, et al. (2005) Prediction of BRCA1 status in patients with breast cancer using estrogen receptor and basal phenotype. Clin Cancer Res 11: 5175–5180.
9. Wilson JR, Bateman AC, Hanson H, An Q, Evans G, et al. (2010) A novel HER2-positive breast cancer phenotype arising from germline TP53 mutations. J Med Genet 47: 771–774.
10. Garcia-Closas M, Couch FJ, Lindstrom S, Michailidou K, Schmidt MK, et al. (2013) Genome-wide association studies identify four ER negative-specific breast cancer risk loci. Nat Genet 45: 392–398, 398e391–392.
11. Haiman CA, Chen GK, Vachon CM, Canzian F, Dunning A, et al. (2011) A common variant at the TERT-CLPTM1L locus is associated with estrogen receptor-negative breast cancer. Nat Genet 43: 1210–1214.
12. Stacey SN, Manolescu A, Sulem P, Thorlacius S, Gudjonsson SA, et al. (2008) Common variants on chromosome 5p12 confer susceptibility to estrogen receptor-positive breast cancer. Nat Genet 40: 703–706.
14. Chen W, Zhong R, Ming J, Zou L, Zhu B, et al. (2012) The SLC4A7 variant rs4973768 is associated with breast cancer risk: evidence from a case-control study and a meta-analysis. Breast Cancer Res Treat 136: 847–857. 15. Azzato EM, Pharoah PD, Harrington P, Easton DF, Greenberg D, et al. (2010)
A genome-wide association study of prognosis in breast cancer. Cancer Epidemiol Biomarkers Prev 19: 1140–1143.
16. Fasching PA, Pharoah PD, Cox A, Nevanlinna H, Bojesen SE, et al. (2012) The role of genetic breast cancer susceptibility variants as prognostic factors. Hum Mol Genet 21: 3926–3939.
17. Azzato EM, Tyrer J, Fasching PA, Beckmann MW, Ekici AB, et al. (2010) Association between a germline OCA2 polymorphism at chromosome 15q13.1 and estrogen receptor-negative breast cancer survival. J Natl Cancer Inst 102: 650–662.
18. Shu XO, Long J, Lu W, Li C, Chen WY, et al. (2012) Novel genetic markers of breast cancer survival identified by a genome-wide association study. Cancer Res 72: 1182–1189.
19. Rafiq S, Tapper W, Collins A, Khan S, Politopoulos I, et al. (2013) Identification of inherited genetic variations influencing prognosis in early-onset breast cancer. Cancer Res 73: 1883–1891.
20. Eccles D, Gerty S, Simmonds P, Hammond V, Ennis S, et al. (2007) Prospective study of Outcomes in Sporadic versus Hereditary breast cancer (POSH): study protocol. BMC Cancer 7: 160.
21. Fagerholm R, Hofstetter B, Tommiska J, Aaltonen K, Vrtel R, et al. (2008) NAD(P)H: quinone oxidoreductase 1 NQO1*2 genotype (P187S) is a strong prognostic and predictive factor in breast cancer. Nature genetics 40: 844–853. 22. Turnbull C, Ahmed S, Morrison J, Pernet D, Renwick A, et al. (2010) Genome-wide association study identifies five new breast cancer susceptibility loci. Nature genetics 42: 504–507.
23. Rafiq S, Tapper W, Collins A, Khan S, Politopoulos I, et al. (2013) Identification of inherited genetic variations influencing prognosis in early onset breast cancer. Cancer research.
24. Li J, Humphreys K, Heikkinen T, Aittomaki K, Blomqvist C, et al. (2011) A combined analysis of genome-wide association studies in breast cancer. Breast Cancer Res Treat 126: 717–727.
25. (2003) The International HapMap Project. Nature 426: 789–796. genabel website. Available: http://www.genabel.org/. Accessed 2013 Dec 9. 26. Harris RJ, Bradburn MJ, Deeks JJ, Harbord RM, Altman DG, et al. (2008)
metan: fixed- and random-effects meta-analysis. Stata Journal 8: 3–28. 27. Downey L, Livingston RB, Koehler M, Arbushites M, Williams L, et al. (2010)
Chromosome 17 polysomy without human epidermal growth factor receptor 2 amplification does not predict response to lapatinib plus paclitaxel compared with paclitaxel in metastatic breast cancer. Clin Cancer Res 16: 1281–1288. 28. Pruim RJ, Welch RP, Sanna S, Teslovich TM, Chines PS, et al. (2010)
LocusZoom: regional visualization of genome-wide association scan results. Bioinformatics 26: 2336–2337.
29. Nica AC, Parts L, Glass D, Nisbet J, Barrett A, et al. (2011) The architecture of gene regulatory variation across multiple human tissues: the MuTHER study. PLoS genetics 7: e1002003. scandb Website. Available: http://www.scandb. org/newinterface/about.html. Accessed 2013 Dec 9.
30. Gamazon ER, Zhang W, Konkashbaev A, Duan S, Kistner EO, et al. (2010) SCAN: SNP and copy number annotation. Bioinformatics 26: 259–262. 31. Cartharius K, Frech K, Grote K, Klocke B, Haltmeier M, et al. (2005)
MatInspector and beyond: promoter analysis based on transcription factor binding sites. Bioinformatics 21: 2933–2942. Hashimoto T, Shindo Y, Souri M and Baldwin GS (1996) A new inhibitor of mitochondrial fatty acid oxidation. J Biochem 119: 1196–1201.
32. Herschkowitz JI, Zhao W, Zhang M, Usary J, Murrow G, et al. (2012) Comparative oncogenomics identifies breast tumors enriched in functional tumor-initiating cells. Proceedings of the National Academy of Sciences of the United States of America 109: 2778–2783.
33. Silbiger VN, Luchessi AD, Hirata RD, Lima-Neto LG, Cavichioli D, et al. (2013) Novel genes detected by transcriptional profiling from whole-blood cells in patients with early onset of acute coronary syndrome. Clin Chim Acta 421: 184–190.
34. Lykke-Andersen J, Shu MD, Steitz JA (2000) Human Upf proteins target an mRNA for nonsense-mediated decay when bound downstream of a termination codon. Cell 103: 1121–1131. Lincoln DW, 2nd and Bove K (2005) The transcription factor Ets-1 in breast cancer. Front Biosci 10: 506–511. 35. Verschoor ML, Wilson LA, Singh G (2010) Mechanisms associated with
mitochondrial-generated reactive oxygen species in cancer. Can J Physiol Pharmacol 88: 204–219.
36. Buggy Y, Maguire TM, McGreal G, McDermott E, Hill AD, et al. (2004) Overexpression of the Ets-1 transcription factor in human breast cancer. Br J Cancer 91: 1308–1315.
37. Levine DM, Ek WE, Zhang R, Liu X, Onstad L, et al. (2013) A genome-wide association study identifies new susceptibility loci for esophageal adenocarcino-ma and Barrett’s esophagus. Nat Genet 45: 1487–1493.
38. Lincoln DW 2nd, Bove K (2005) The transcription factor Ets-1 in breast cancer. Front Biosci 10: 506–511.
39. Verschoor ML, Wilson LA, Singh G (2010) Mechanisms associated with mitochondrial-generated reactive oxygen species in cancer. Can J Physiol Pharmacol 88: 204–219.
40. Buggy Y, Maguire TM, McGreal G, McDermott E, Hill AD, et al. (2004) Overexpression of the Ets-1 transcription factor in human breast cancer. Br J Cancer 91: 1308–1315.
41. Levine DM, Ek WE, Zhang R, Liu X, Onstad L, et al. (2013) A genome-wide association study identifies new susceptibility loci for esophageal adenocarcino-ma and Barrett’s esophagus. Nat Genet 45: 1487–1493.
Role of SNPs in Breast Cancer Prognosis