www.atmos-chem-phys.net/10/6551/2010/ doi:10.5194/acp-10-6551-2010
© Author(s) 2010. CC Attribution 3.0 License.
Chemistry
and Physics
Impacts of HONO sources on the photochemistry in Mexico City
during the MCMA-2006/MILAGO Campaign
G. Li1,2, W. Lei1, M. Zavala1, R. Volkamer3,4, S. Dusanter5, P. Stevens5, and L. T. Molina1,2 1Molina Center for the Energy and the Environment, La Jolla, CA 92037, USA
2Massachusetts Institute of Technology, Cambridge, MA 02139, USA
3Department of Chemistry, University of Colorado at Boulder, Boulder, CO 80309, USA
4Cooperative Institute for Research in the Environmental Sciences (CIRES), University of Colorado at Boulder, Boulder, CO 80309, USA
5Center for Research in Environmental Science, School of Public and Environmental Affairs, and Department of Chemistry, Indiana University, Bloomington, IN 47405, USA
Received: 14 January 2010 – Published in Atmos. Chem. Phys. Discuss.: 11 February 2010 Revised: 9 June 2010 – Accepted: 6 July 2010 – Published: 16 July 2010
Abstract. The contribution of HONO sources to the photo-chemistry in Mexico City is investigated during the MCMA-2006/MILAGO Campaign using the WRF-CHEM model. Besides the homogeneous reaction of NO with OH, four ad-ditional HONO sources are considered in the WRF-CHEM model: secondary HONO formation from NO2 heteroge-neous reaction with semivolatile organics, NO2reaction with freshly emitted soot, NO2heterogeneous reaction on aerosol and ground surfaces. The WRF-CHEM model with the five HONO sources performs reasonably well in tracking the observed diurnal variation of HONO concentrations. The HONO sources included are found to significantly improve the HOx (OH+HO2) simulations during daytime and the partition of NO/NO2 in the morning. The HONO sources also accelerate the accumulation of O3concentrations in the morning by about 2 h and subsequently result in a noticeable enhancement of O3concentrations over the course of the day with a midday average of about 6 ppb. Furthermore, these HONO sources play a very important role in the formation of secondary aerosols in the morning. They substantially en-hance the secondary organic aerosol concentrations by a fac-tor of 2 on average in the morning, although they contribute less during the rest of the day. The simulated particle-phase nitrate and ammonium are also substantially enhanced in the morning when the four HONO sources are included, in good agreement with the measurements. The impact of the HONO sources on the sulfate aerosols is negligible because of the in-efficient conversion of H2SO4from SO2reacting with OH.
Correspondence to:G. Li (lgh@mce2.org)
1 Introduction
Nitrous acid (HONO) plays an important role in the photo-chemistry of the troposphere, especially in the polluted ur-ban atmosphere, because HONO is a significant photochem-ical precursor of the hydroxyl radphotochem-ical (OH), the key oxidant in the degradation of most air pollutants (e.g., Jenkin et al., 1988; Calvert et al., 1994; Aumont et al., 2003; Stemmler et al., 2006; Volkamer et al., 2007). Photolysis of HONO by sunlight in the wavelength range from 300 to 405 nm leads to the production of NO and OH (e.g., Stutz et al., 2000): HONO+hv→NO+OH (300nm< λ <405nm) (R1) Therefore, the formation and photolysis of HONO could en-hance the production of ozone (O3) and other secondary pol-lutants, particularly in the early morning when other OH sources are less important in the polluted atmosphere (Lam-mel and Perner, 1988; Harrison et al., 1996; Kurtenbach et al., 2001).
A wide range of HONO concentrations in the atmosphere have been reported, with maximum at night and minimum during daytime (Kleffmann et al., 2006). For example, a maximum of 15 ppb was observed in Los Angeles (Winer and Biermann, 1994) and 10 ppb was measured in Milan, Italy (Febo et al., 1996). High values of HONO (100– 400 ppt) are also detected during the day in urban areas (e.g., Febo et al., 1996) and rural regions (53–110 ppt) (e.g., Staffelbach et al., 1997; Zhou et al., 2002; Acker et al., 2005).
daytime and nighttime HONO concentrations (Aumont et al., 1999; Stafelbach et al., 1997). Recently, gas-phase produc-tion of HONO has been observed during the photolysis of differentortho-nitrophenols (Bejan et al., 2006; Kleffmann, 2007), with a noontime HONO production of 100 pptv h−1 in the urban regions. In addition, the gas-phase photolysis of methyl-substituted nitroaromatics is also proposed to pro-duce HONO (Kleffmann, 2007). Although HONO formation mechanism in the atmosphere is still poorly understood at present, it is well established that heterogeneous conversion processes of nitrogen dioxide (NO2) on different surfaces are involved in the troposphere (Febo et al., 1987; Svensson et al., 1987; Saliba et al., 2000; Kleffmann et al., 1998; Lammel and Cape, 1996). In the stratosphere, when the temperature is below 230 K, heterogeneous reactions of HONO on sulfate aerosols have been observed with an uptake coefficient rang-ing from 0.03 to 0.1, dependent on the sulfuric acid content (Zhang et al., 1996). However, considering the high temper-ature in the troposphere, the heterogeneous loss of HONO on sulfate aerosols cannot constitute a potentially important HONO sink. Direct emissions from vehicles may also play a role in atmospheric HONO levels, depending on vehicle en-gines and traffic distributions, with a molar emission ratio of HONO/NOxranging from 10−4to 10−2(Kurtenbach et al., 2001).
Based on the surface measurements of various radical pre-cursors, Winer and Biermann (1994) investigated the relative contribution of HONO to OH sources, showing that HONO was a major source of OH during the morning in the polluted Los Angeles atmosphere. Using observations with Differ-ential Optical Absorption Spectroscopy (DOAS), Alicke et al. (2002, 2003) found that photolysis of HONO produced up to 34% of the total OH formed over 24-h period during BERLIOZ in Germany. Volkamer et al. (2007) also showed that photo-induced HONO sources made an important con-tribution to the OH level in the early morning during the MCMA-2003 field campaign in Mexico City.
Modeling results reported in the literature indicate that the contribution of HONO to the atmospheric photochemistry depends on multiple conditions, such as NOxconcentration, season, etc. In the pioneering modeling study by Harris et al. (1982) using a trajectory model, various levels of HONO were included in the early morning at the beginning of the simulations. The initial HONO input was found to remark-ably enhance the production rate of O3but not significantly influence the maximum O3 yield, except under high NOx conditions. Using a box model, Jenkin et al. (1988) found that the photolysis of HONO in the early morning led to a 50% increase of OH at 0600 GMT, a 14% increase in the daily maximum OH and a 16% increase in net photochemi-cal O3production when a heterogeneous HONO source was added. Similar results were also obtained by Kotamarthi et al. (2001) using a box model, showing that HONO formation on aerosols substantially influenced O3, OH, and HO2 con-centrations in the polluted planetary boundary layer (PBL).
Furthermore, employing a photochemical trajectory model, Clapp and Jenkin (2001) suggested that direct emission of HONO may have an important impact on the level of oxi-dant (O3+NO2), especially under more polluted conditions. Based on the simulations with a chemical transport model, Lei et al. (2004) concluded that heterogeneous conversion of NO2 to HONO on the surfaces of soot aerosol acceler-ated the O3production by about 1 h in the morning and led to a noticeable increase of 7 ppb on average in the daytime O3 level. However, in the simulations performed by Au-mont et al. (1999) using a two-layer box model, the photoly-sis of HONO did not contribute significantly to summertime O3concentrations of polluted air masses. Furthermore, Au-mont et al. (2003) conducted simulations with a two-layer box model to verify the impact of HONO photolysis on the NOx/HOx/O3 chemistry in the polluted boundary layer. Three HONO sources were added in their simulations, in-cluding direct emissions of HONO, NO2heterogeneous pro-duction of HONO on the ground surface and the aerosol sur-face. Their simulation results varied with the season: HONO sources were found to slightly influence the NOx/HOx/O3 concentration profiles during summer, but the photolysis of HONO appeared to be a significant source of OH during win-ter.
As an important contributor of OH in the polluted atmo-sphere, HONO sources potentially affect the formation of secondary aerosols by enhancing the VOC oxidation due to the increased OH level. However, few studies have been con-ducted to investigate the impacts of HONO sources on the formation of secondary aerosols in the polluted atmosphere. During the MCMA-2006 field campaign as part of the MI-LAGRO (Megacity Initiative: Local and Global Research Observations) project in March 2006, an extensive data set was obtained, including highly time-resolved ambient gas phase species and aerosols (Molina et al.,2008; 2010), which provides a unique opportunity to investigate the impacts of HONO sources on the photochemistry in a polluted urban area. The objective of the present study is to examine the relative importance of different HONO sources and evaluate their contributions to the HOx/NOx/O3 chemistry and sec-ondary aerosols using the WRF-CHEM model based on the measurements taken during MCMA-2006 field campaign. The WRF-CHEM model and the model configuration are de-scribed in Sect. 2. Results of the modeling experiments and comparisons are presented in Sect. 3. The discussion and summary are given in Sect. 4.
2 Model description
2.1 WRF-CHEM Model
atmospheric research needs. A detailed description of the WRF model can be found in the WRF web-site http://www. wrf-model.org/index.php.
Additionally, a chemical model is also fully implemented into the WRF model (WRF-CHEM) (Grell et al., 2005; Tie et al., 2007). Based on the framework of the cur-rent WRF-CHEM model and the available emissions in-ventory in Mexico City (Song et al., 2010), a new flexi-ble gas phase chemical module has been developed and im-plemented into the WRF-CHEM model, which can be uti-lized with different chemical mechanisms, including CBIV, RADM2, and SAPRC. The chemistry is solved by an Eule-rian backward Gauss-Seidel iterative technique with a num-ber of iterations, inherited from NCAR-HANK (Hess et al., 1999). The short-lived species, such as OH and O (1D), are assumed to be in steady state. The solution is iterated until all species are within 0.1% of their previous iterative values. For the aerosol simulations, the CMAQ/models3 (version 4.6) aerosol module developed by US EPA (Envi-ronmental Protection Agency), which is designed to be an efficient and economical depiction of aerosol dynamics in the atmosphere, has also been incorporated into the WRF-CHEM model (Binkowski and Roselle, 2003). In this aerosol component, the particle size distribution is represented as the superposition of three lognormal sub-distributions called modes. The processes of coagulation, particle growth by the addition of mass, and new particle formation are included. In addition, the wet deposition also follows the method used in the CMAQ/Models3. Surface deposition of chemical species is parameterized following Wesely (1989). The photolysis rates are calculated using the FTUV (Tie et al., 2003; Li et al., 2005). Anthropogenic emissions used in the WRF-CHEM model are constructed from the official emissions inventory for the MCMA-2006 (Song et al., 2010). Biogenic emissions are estimated using the MEGAN v2.04 model (Model of Emissions of Gases and Aerosols from Nature) developed by Guenther et al. (2006, 2007); the on-line biogenic emissions calculation is turned off. In the present study, the SAPRC 99 gas phase chemical mechanism is employed according to the available emission inventory in Mexico City.
2.2 Parameterization of HONO Sources
In addition to the homogeneous reaction of NO with OH, four sources of HONO are included: secondary HONO for-mation from NO2heterogeneous reaction with semivolatile organics, NO2 reaction with freshly emitted soot, NO2 het-erogeneous reaction on aerosols and ground surface.
With regard to the secondary HONO formation from NO2 heterogeneous reaction with semivolatile organics, we fol-low the results of a recent experimental study performed by Gutzwiller et al. (2002) and assume that a fraction of 0.023 of the NOxemitted is heterogeneously converted to HONO. It is worthy to note that the fraction suggested by Gutzwiller et al. (2002) was obtained from diesel exhaust. It might be
more appropriate to use the value of 244 mg of secondary HONO formation per kg of diesel fuel burnt as suggested by Gutzwiller et al. (2002). However, in their experiment, the semivolatile organics in diesel exhaust react with NO2on time scales of hours, much longer than the time scale of the NO2to HONO conversion on freshly soot particles, which is in the order of one minute (Kalberer et al., 1999). Therefore, using the fraction of NOxor diesel fuel burnt to calculate the HONO formation is a highly parameterized method based on the experiment of Gutzwiller et al. (2002). In Mexico City, diesel vehicles contribute almost all the organic aerosol emis-sions (Zavala et al., 2009) and very high levels of organic aerosols have been observed (Aiken et al., 2009), indicating a large amount of semivolatile organics are emitted from diesel vehicles, which could participate in the conversion of NO2 from other sources, such as gasoline engines and biomass burning. Considering the emission contributions from diesel engines and the variation in the fraction of NO2in NOx emis-sions in Mexico City, the fraction of 0.023 used in the study is likely an upper limit for the HONO formation from NO2 heterogeneous reaction with semivolatile organics. Further-more, it is necessary to emphasize that further studies need to be conducted to more appropriately parameterize the NO2 reaction with semivolatile organics.
Ammann et al. (1998) found an efficient conversion of NO2 to HONO on suspended soot particles with a reac-tion probability ranging from 1.1×10⁻² to 3.3×10⁻⁴, but they did not conclude whether the conversion process is catalytic or not. Subsequently, Kalberer et al. (1999) con-cluded that the NO2 to HONO conversion on soot parti-cles rapidly saturates because of consumption of the reac-tive sites. They suggested an upper limit for HONO for-mation of 1018HONO molecules mg−1freshly emitted soot. However, Arens et al. (2001) estimated that the total HONO formation potential of soot particles was about 1.3×10¹⁷ HONO molecules mg−1 of diesel soot, and suggested that the reaction between NO2and diesel soot particles does not provide a significant secondary HONO source in the atmo-sphere. We employ the value of 1.3×10¹⁷ HONO mg−1of freshly emitted soot to calculate the conversion of NO2 to HONO based on the black carbon emissions in the WRF-CHEM model, considering that the reaction rate of NO2with freshly emitted soot is dramatically reduced after the first seconds (Kalberer et al., 1999), which is less than the chem-ical integration time step in simulations.
Several heterogeneous reactions on different surfaces in-volving NO2 as a reactant have been proposed as potential contributors to HONO formation in the troposphere (Febo et al., 1987; Svensson et al., 1987; Saliba et al., 2000; Kleff-mann et al., 1998; Lammel and Cape, 1996):
2NO2+H2O→HONO+HNO3 (R2)
NO+NO2+H2O→2HONO (R3)
However, most laboratory studies suggest that the reaction of NO2to HONO is first order in NO2 concentration, thus the HONO formation can be parameterized by the following reactions (Aumont et al., 2003):
NO2→HONO, ka (R5)
NO2→HONO, kg (R6)
Where,kaandkgare the first order rate constants for aerosol
and ground surface reactions, respectively.
For the reaction on aerosols, the first order rate constantka
is estimated by
ka=
1 4vNO2(
S
V)ra (R7)
wherevNO2 is the mean molecular speed of NO2, S/V is
the surface to volume ratio, andrais the reactive uptake
co-efficient. We use a low value ofra= 1×10⁻⁶in the
night-time (Aumont et al., 2003) and increase it to 5×10⁻⁶ in the daytime with the assumption that aerosols are mixed or covered with organic compounds, humid acids, soot or dust, which dramatically enhance the HONO formation when the sunlight is available (George, 2005; Stemmler et al., 2007; Monge et al., 2010; Ndour et al., 2008). With regard to the NO2 reaction on ground surface, the rate constant is calcu-lated by
kg=
1 8vNO2(
S
V)rg (R8)
where rg is the reactive uptake coefficient of ground
sur-face. According to tunnel measurements and experiments by Kurtenbach et al. (2001), we use a value ofrg= 1×10⁻⁶
at the nighttime. Stemmler et al. (2006) showed that NO2 is effectively reduced to HONO on light activated surfaces containing humic acids, soils or selected synthetic aromatic compounds. The dust and soot particles deposited on the ground surface also enhance the HONO production when the sunlight is available (Ndour et al., 2008; Monge et al., 2010). A relatively large uptake coefficient of 2×10⁻⁵is suggested, with dependence on the light intensity. When the sunlight is available and the light density is less than 400 W m−2, the uptake coefficient is set to 2×10⁻⁵. When the light density is more than 400 W m−2, the uptake coefficient of 2×10⁻⁵ is scaled by a factor defined as (light density)/400. We use an effective surface of 1.7 m2 per geometric surface in the model surface layer to calculate the surface to volume ratio (Vogel et al., 2003).
2.3 Model configuration
Two three-day episodes from 24 to 26 and from 27 to 29 March 2006 are selected in the present study, representing typical “O3-Convection South” and “O3-Convection North” meteorological conditions in Mexico City, respectively (de
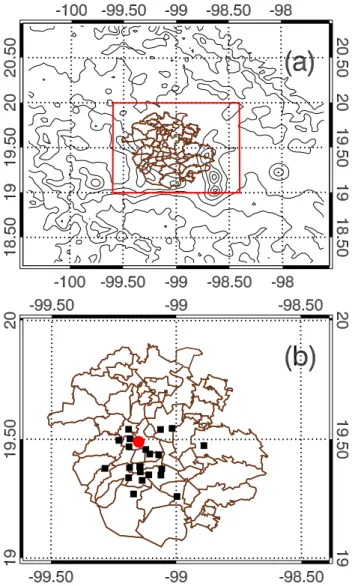
Fig. 1. WRF-CHEM simulation domain. Black squares represent the RAMA (Mexico City Ambient Air Monitoring Network) sites and red filled circle is the T0 super site at the Instituto del Petroleo (IMP) laboratories (Mexico, DF).
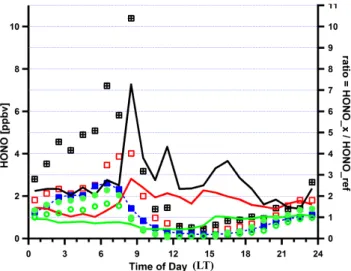
Fig. 2. Comparison of HONO measurements from three LP-DOAS instruments during two field campaigns in the MCMA. (open circles) HONO mean concentration during MCMA-2003 from DOAS#2 at 70 m above ground; (solid circles) MCMA-2003 mean from DOAS#1 at 18 m above ground; (solid squares with dashed line) reference case: MCMA-2006 mean, excluding data from the model period (24–29 Apri), data measured 16 m above ground; (open squares) mean during the model period (24–29 April); (crossed squares) data from 29 April 2006. Also shown on the right scale are ratios of HONO concentrations for data sub-sets: (green line) MCMA-2003 average of two DOAS instruments, divided by reference case; (red line) model period divided by refer-ence case; (black line) 29 April 2006 divided by the referrefer-ence case.
Two case simulations are performed in this study. In the homogeneous case (hereafter referred to as H-case), only the gas phase reaction of NO with OH is considered as the HONO source. For the enhanced case (hereafter referred to as E-case), the four HONO sources described in Section 2.2 are included together with the gas phase reaction. We com-pare the model results from the H-case and E-case with mea-surements obtained at the T0 urban supersite (Table 1). In addition, based on the E-case, several experimental studies have been performed to verify the HONO contribution from the photolysis of different ortho-nitrophenols and evaluate the sensitivity of HONO sources to the input parameters.
3 Results
3.1 HONO measurements
Figure 2 compares diurnal profiles of HONO concentra-tions measured by LP-DOAS during the MCMA-2003 and MCMA-2006 field campaigns. Two LP-DOAS instruments were deployed at a mean height of 16 m and 70 m above ground at CENICA during MCMA-2003 (Volkamer et al., 2007). During MCMA-2006, the LP-DOAS was located at about 14 m above ground at T0. Mean diurnal profiles are
shown for the entire campaign duration for the two instru-ments from MCMA-2003, and for different data subsets for MCMA-2006. We define the reference case as the mean di-urnal profile calculated from measurements for all MCMA-2006 campaign days except the modeling period. If measure-ments are compared at a comparable mean height of the LP-DOAS light path above ground, the mean HONO diurnal pro-files during MCMA-2003 and the reference case agree within 10% at night. Somewhat larger differences are observed dur-ing daytime, with up to 50% lower daytime HONO observed during MCMA-2003 compared to the reference case. Ver-tical concentration gradients can explain up to 40% lower HONO at 70 m compared to 16 m above ground at night dur-ing MCMA-2003; this is consistent with HONO formation on urban surfaces as it has been invoked in other studies (Olaguer et al., 2009). The onset of convective vertical mix-ing of air shortly after sunrise quickly reduced any vertical concentration gradients of HONO in the early morning, and no evidence for vertical gradients was observable 2–3 h after sunrise during MCMA-2003. Figure 2 shows that on a mean basis the combination of horizontal and vertical HONO gra-dients can explain a variability of up to 50% in HONO be-tween the reference case and the MCMA-2003 data.
During the period from 24–29 April 2006 HONO was sys-tematically higher than could be explained based on typi-cal concentration gradients. While nighttime HONO agreed reasonably well with that observed in the reference scenario (with the exception of April 29), significantly higher HONO was observed primarily during daytime. The mean daytime HONO during 24–29 April was 2–3 times higher than dur-ing the rest of the MCMA-2006 field campaign, and 4–5 times higher than during MCMA-2003. Differences were particularly large on 29 April when nighttime HONO was 2-3 times higher, and daytime HONO was up to 7 times higher than observed during the reference scenario. The largest en-hancement in daytime HONO over the reference case was observed in the mid-morning, but differences persisted for most of the day. This modeling paper does not attempt to explain why periods of enhanced daytime HONO are ob-served in the MCMA. Rather, the focus is on the study of the role that such periods can play to accelerate the forma-tion of secondary pollutants such as ozone and secondary aerosol formation within the MCMA. However, it should be emphasized that no events of elevated daytime HONO were observed during MCMA-2003 (Volkamer et al., 2007), and for the most part of MCMA-2006. The frequency with which events of enhanced daytime HONO occur within the MCMA is presently not well established.
3.2 HONO simulations
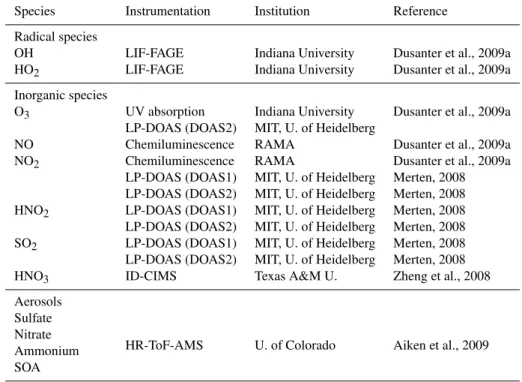
Table 1.Species used for comparison with simulations at T0.
Species Instrumentation Institution Reference
Radical species
OH LIF-FAGE Indiana University Dusanter et al., 2009a HO2 LIF-FAGE Indiana University Dusanter et al., 2009a
Inorganic species
O3 UV absorption Indiana University Dusanter et al., 2009a LP-DOAS (DOAS2) MIT, U. of Heidelberg
NO Chemiluminescence RAMA Dusanter et al., 2009a
NO2 Chemiluminescence RAMA Dusanter et al., 2009a
LP-DOAS (DOAS1) MIT, U. of Heidelberg Merten, 2008 LP-DOAS (DOAS2) MIT, U. of Heidelberg Merten, 2008 HNO2 LP-DOAS (DOAS1) MIT, U. of Heidelberg Merten, 2008 LP-DOAS (DOAS2) MIT, U. of Heidelberg Merten, 2008 SO2 LP-DOAS (DOAS1) MIT, U. of Heidelberg Merten, 2008 LP-DOAS (DOAS2) MIT, U. of Heidelberg Merten, 2008
HNO3 ID-CIMS Texas A&M U. Zheng et al., 2008
Aerosols Sulfate
HR-ToF-AMS U. of Colorado Aiken et al., 2009 Nitrate
Ammonium SOA
Fig. 3.Simulated and observed HONO at T0 during 24–29 March 2006. The black dots denote the observation, and the red and blue lines represent the simulations in the E-case and H-case, respec-tively.
the HONO concentrations are underestimated by a factor of 10 on average compared with the observations, particularly during nighttime. The simulation results are fairly consistent with previous studies, which show that the pure gas phase reaction fails to explain the observed high HONO concentra-tions (Aumont et al., 1999; Stafelbach et al., 1997; Vogel et al., 2003). Additionally, the ROx(OH+HO2+RO2) modeling study for T0 performed by Dusanter et al. (2009b) using a box model has also demonstrated a systematic underpredic-tion of the measured HONO concentraunderpredic-tions during daytime if only the homogeneous gas-phase reaction is considered as
the HONO source. Moreover, the simulated peak HONO concentrations in the H-case occur at 09:00 LT (local time), one or two hours later than the observed value.
When the four additional sources of HONO are consid-ered in the E-case, the WRF-CHEM model tracks reasonably well the HONO diurnal variability compared with the mea-surement. For example, the occurrence of peak HONO con-centrations is well replicated, and the accumulation of night-time HONO concentrations and the rapid falloff of morn-ing HONO concentrations are also reproduced. However, the E-case frequently underestimates the HONO levels dur-ing the afternoon, particularly on 28 and 29 March indicat-ing either unawareness of unknown sources or uncertainties from meteorological field simulations. For example, Zhou et al. (2002) speculated that the photolysis of HNO3might con-tribute significantly to the missing daytime HONO sources. In the simulations of Vogel et al. (2003), although the di-rect emission of HONO and the NO2heterogeneous reaction on aerosol and ground surfaces were included, the simulated daytime HONO concentrations were also underestimated by 30–50% compared with the observations. An artificial pho-tolytic HONO source had to be introduced in order to im-prove the HONO simulations during daytime.
Fig. 4. Simulated and observed photolysis rate of HONO at T0 during 24–29 March 2006. The black dots denote the observation and the red represents the simulations in the E-case.
ortho-nitrophenols (Bejan et al., 2006; Kleffmann, 2007), because all nitrophenols are represented by one lumped species (NPHE) in the SAPRC 99 mechanism and the ab-sorption cross section ofortho-nitrophenols is not available yet. In order to evaluate possible HONO contribution from the photolysis of differentortho-nitrophenols, we have con-ducted a sensitivity study in the E-case, assuming that all nitrophenols are photolyzed to form HONO and the photol-ysis frequency is interpolated fromJ[NO2] as suggested by Bejan et al. (2006). The study provides an upper limit of HONO production from the photolysis of different ortho -nitrophenols. The enhancement of HONO concentrations from the photolysis of nitrophenols is less than 3 ppt on aver-age during daytime, which is probably due to the low level of predicted nitrophenols (less than 0.3 ppb) in the simulation. Therefore, the photolysis ofortho-nitrophenols is less likely to be a significant HONO source in Mexico City.
Meteorological conditions play also a key role in air pollu-tion simulapollu-tions principally through determining the disper-sion or accumulation of pollutant emisdisper-sions and also influ-encing their lifetime via changing chemical processes (Bei et al., 2008). Convections were active during the period from 24 to 29 March (de Foy et al., 2009), which may signifi-cantly influence the HONO simulation in the WRF-CHEM model. The frequent cumulus cloud formation and develop-ment remarkably affect the photolysis rates of HONO. Fig-ure 4 presents the comparison of the observed and simulated photolysis rates of HONO at T0. The photolysis rates for HONO were directly measured using a spectroradiometer at T0 (Volkamer et al., 2007). The reduction of HONO pho-tolysis rates due to clouds is salient in the afternoon during the two episodes, particularly on 28 and 29 March. However, unfortunately, the WRF-CHEM model frequently fails to re-solve the formation and development of cumulus clouds us-ing 3-km horizontal resolution. Therefore, in the afternoon, the WRF-CHEM model often overestimates the HONO pho-tolysis rates, and likely underestimates HONO
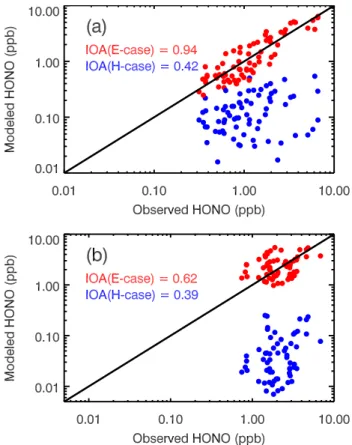
concentra-Fig. 5.Comparison between simulated and observed HONO at T0 during(a)daytime and(b)nighttime. The red and blue dots repre-sent the simulations in the E-case and H-case, respectively.
tions during that time. Moreover, the uncertainties in the parameterization of HONO sources used in the study also influence the HONO simulations.
Figure 5a and b present the comparisons between simu-lated and observed HONO concentrations (hourly averaged) during nighttime and daytime. In order to further evaluate the performance of the HONO simulation in the H-case and E-case against the measurements at T0, an “index of agree-ment” (IOA) to describe the relative difference between the model and observation is calculated during nighttime and daytime (Willmott and Wicks, 1980). IOA is defined as:
IOA=1−
N
P
i=1
(pi−oi)2
N
P
i=1
(|pi−o| + |oi−o|)2
(R9)
wherepiandoi are the simulated and observed variable,
HONO simulations, with IOA of 0.62. In contrast, irregard-less of daytime or nighttime, the small IOA in the H-case shows the failure of the homogeneous source to interpret the observed high levels of HONO.
The most important HONO source in the E-case is the secondary HONO formation from NO2 reaction with semivolatile organics, contributing about 75% of the HONO concentrations near the ground level during daytime. When a large reactive uptake coefficient is used during daytime, the ground surface also plays an important role in the HONO formation, providing 18% of the HONO concentrations in the surface level. The contribution from the reaction of NO2 with the freshly emitted soot is small, less than 2%. The model simulations conducted by Aumont et al. (1999), which considered the deactivation of fresh soot surfaces, also showed that the NO2+soot reaction is not a significant atmo-spheric source of HONO (Arens et al., 2001). The simu-lated maximum aerosol surface to volume ratio (S/V) ex-ceeds 1.0×10⁻³m−1, due to the high pollution in Mexico City. We have used a relatively higher NO2reaction proba-bility on aerosol surfaces during daytime, but the contribu-tion of HONO at the aerosol surface is still negligible com-pared to the ground surface, which is in good agreement with the results obtained by Vogel et al. (2003).
Near the ground level, the contribution of HONO from the homogeneous source in the E-case is about 5% during day-time, which is inconsistent with the results presented by Du-santer et al. (2009b). Using a box model constrained by mea-surements at T0, they calculated the loss rate of HONO from photolysis to be 11.4×10⁶molecule cm−3s−1while the pro-duction rate from OH+NO is 6.5×10⁶molecule cm−3s−1on average between 08:40 a.m. and 18:40 LT. They concluded that the homogeneous source accounts for more than 50% of the HONO formation rate during this time period. In the WRF-CHEM model, HONO is transported and dispersed due to its relatively long lifetime ranging from half an hour in the early morning to around 10 min at noontime. Particularly, HONO is efficiently mixed in the PBL by the vertical tur-bulent exchange. The HONO sources of secondary HONO formation from NO2reaction with semivolatile organics and NO2reactions with the freshly emitted soot and ground sur-face are all included in the sursur-face level in the WRF-CHEM model, hence the three sources play a dominant role in the ground level. If the three sources are assumed to be dis-tributed in the PBL, and considering that the simulated mean PBL height between 08:40 and 18:40 LT is about 1.5 km and the height of the model ground level is about 50 m, the ho-mogeneous source contributes more than 50% to the HONO production, comparable to the box model results from Du-santer et al. (2009b).
As the most important HONO source in the surface level, the NO2reaction with the semivolatile organics is highly pa-rameterized in the simulations, using a fraction of 0.023 of the NOxemitted to calculate the HONO formation. Based on the experiment of Gutzwiller et al. (2002), the semivolatile
organics in diesel exhaust react with NO2within hours un-der the condition of sufficient water content. Consiun-dering the massive emissions of semivolatile organics from diesel ve-hicles in Mexico City and the high relative humidity due to convective activities during the simulation period, the frac-tion of 0.023 used is reasonable, which is demonstrated by the comparison of the simulations in the E-case with the ob-servations at T0. However, the parameterization of the NO2 reaction with the semivolatile organics in the study might not be fit for moderately polluted areas where the emissions of semivolatile organics are not high enough. Further studies are needed to directly parameterize the NO2 reaction with semivolatile organics in models. The uncertainty of the ef-fective surface used in the WRF-CHEM model may also considerably influence the simulated HONO levels because the ground surface plays an important role in the HONO for-mation in the surface layer. In addition, the HONO forma-tion from NO2 reaction with freshly emitted soot remains highly uncertain, ranging from 1.3×10¹⁷ to 1018 HONO molecules mg−1freshly emitted soot and also depending on the water content (Kalberer et al., 1999; Arens et al., 2001).
We have performed three experimental studies to evaluate the sensitivities of HONO concentrations to the parameters in the above three sources based on the E-case. In the first study, we used a fraction of 0.013 of the emitted NOxto parame-terize NO2reaction with semivolatile organics in the E-case. The simulated HONO concentrations are decreased by about 0.67 ppb or 34% on six-day average at T0 when the fraction of the emitted NOxis reduced from 0.023 to 0.013. In the second study, when only the effective surface is increased 50% in the E-case, the HONO concentrations are increased by 0.16 ppb or 8% on average at T0, and the simulations in the afternoon are improved but overestimations frequently occur in the morning. When the value of 1018HONO mg−1 of freshly emitted soot is used to calculate the conversion of NO2to HONO in the E-case, the HONO concentrations are enhanced by about 0.13 ppb or 7% on average at T0, and the NO2-soot reaction become a non-negligible HONO source.
As discussed above, there are large uncertainties in the HONO simulations due to its poorly understood formation mechanisms, especially during daytime. However, the addi-tional sources in the E-case yield fairly good agreement with the measurement generally. Hence, based on the parameteri-zation, we will evaluate the impact of HONO sources on the photochemistry in the following section.
3.3 Impacts on HOx/NOx/O3chemistry
In the polluted urban atmosphere, the major reactions that are responsible for the O3formation can be described as follows (Brasseur et al., 1999):
OH+RH→R+H2O (R10)
RO2+NO→RO+NO2 (R12) RO+O2→HO2+R
′
CHO (R13)
HO2+NO→OH+NO2 (R14)
2(NO2+hv→NO+O) (R15)
2(O+O2+M→O3+M) (R16)
Overall:
RH+4O2+hv→R
′
CHO+H2O+2O3 (R17)
where RH represents non-methane hydrocarbons, R′CHO denotes carbonyl products, and R′ designates an organic fragment having one carbon atom fewer than R. The OH plays a key role in the initialization of the O3formation pro-cess. The most important primary sources of OH in the pol-luted atmosphere includes the reaction of H2O with O(1D) which comes from the photolysis of O3, the reaction of O3 with alkenes and biogenic VOCs-like isoprene and monoter-penes, and the photolysis of HONO. When the additional HONO sources are considered in the WRF-CHEM model, the OH concentration will be increased to further impact the HO2/RO2concentration, the NO/NO2partition, and the O3 formation.
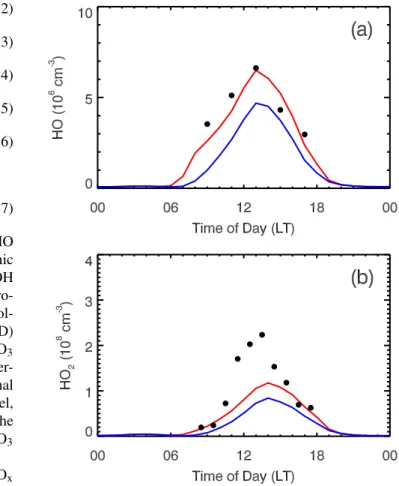
Due to the variability and uncertainties of observed HOx the six-day averaged modeled and observed HOx (2-h av-eraged for OH and 1-h avav-eraged for HO2) at T0 are pre-sented in Fig. 6. Although the WRF-CHEM model follows well the variation of OH concentrations, it underestimates the OH concentrations in the late morning and early after-noon, regardless of whether the HONO sources are consid-ered. However, when the HONO sources are accounted for, the simulation of OH concentrations in the E-case substan-tially improves compared to the measurement, especially in the morning. The E-case yields about 86% of the observed OH concentration averaged during the daytime from 08:00 to 18:00 LT; but in the H-case, the simulated OH concentration is only about 52% of the observation on average. In addition, the HONO sources play a dominant role in the OH concen-tration in the morning, consistent with previous model results (Aumont et al., 2003; Vogel et al., 2003). The inclusion of the HONO sources in the WRF-CHEM model also increases the HO2concentrations in the E-case, particularly in the early morning and late afternoon, but still underestimates the HO2 concentration by a factor of 2 during noontime (Fig. 5b). On average, the E-case produces 55% of the observed HO2 con-centration during the daytime from 08:00 to 18:00 LT, but the H-case only simulates 34% of the observed HO2 concen-tration. Although the E-case simulates the HOx concentra-tions more consistently with the measurements than the H-case, the modeled HO2concentrations in the E-case remain about 45% lower than the observations during daytime, indi-cating either missing radical sources or incomplete chemical
Fig. 6.Influence of the HONO sources on the(a)HO and(b)HO2 diurnal cycle at T0 averaged during the 24–29 March 2006. The black dots correspond to the observations, and the solid red and blue lines are the simulations in the E-case and H-case, respectively.
mechanism (Hofzumahaus et al., 2009). The underestima-tion of VOC concentraunderestima-tions in the model is able to lead to the underestimation of HO2concentrations. It would cause an underestimation of the reactivity of OH with VOCs which in turn would result in an underestimation of peroxy radi-cals. Dusanter et al. (2009b) have calculated a median noon-time OH reactivity of 20–22 s−1due to VOCs at T0 using a box model, whereas the mean noontime OH reactivity in the WRF-CHEM model is around 16 s−1. Sheehy et al. (2008) reported that, during MCMA-2003, the measured OH reac-tivity at noon was about 20–25 s−1, and the MCM box model explained around 20 s−1. Volkamer et al. (2007) also showed that a significant portion of the HOxsources is from photol-ysis of oxygenated VOCs, which may potentially help re-solve the lack of peroxy radicals. In addition, the uncertain-ties from measurements also need to be taken into account when the comparison is performed between simulations and observations. Dusanter et al. (2009a) have reported that the accuracy of the HOxmeasurements is about 18% (1σ).
Fig. 7.Simulated and observed(a)NO and(b),(c)NO2at T0 dur-ing the 24–29 March, 2006. The black dots denote the observation and the red and blue lines represent the simulations in the E-case and H-case, respectively. NO2measurement in (b) is from Chemi-luminescence and (c) is from LP-DOAS.
conversion from NO to NO2 in the polluted atmosphere. When the four HONO sources are considered, in the early morning, the WRF-CHEM model performs well in the simu-lation of the NO concentrations compared with the measure-ment at T0 in the E-case; the NO concentrations are also con-siderably reduced compared to that in the H-case (Fig. 7a). However, the WRF-CHEM model overestimates the NO con-centrations in the late morning and afternoon in both the E-case and H-E-case, which may be caused by the underestima-tion of HO2 concentrations or other reasons, such as PBL evolution and emission temporal variations. Although the peak NO2concentrations in the morning are comparable to the measurements in the E-case in Fig. 7b and c, the occur-rence of the peak NO2concentrations is about one hour later than the observation. Without the HONO sources, the H-case substantially underestimates the peak NO2 concentra-tions from 27 to 29 March. It is worth noting that, on 25 and 26 March, the WRF-CHEM model fails to follow the observed NO2variation during the nighttime and also signif-icantly overestimates the observation in the early morning,
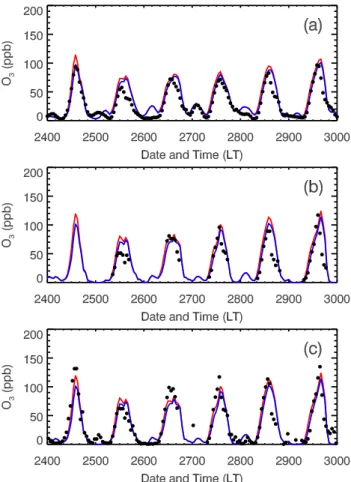
Fig. 8. Simulated and observed O3(a)averaged over all RAMA monitoring sites and(b), (c)at T0 site during the 24–29 March 2006. The black dots denote the observation and the red and blue lines represent the simulations in the E-case and H-case, respec-tively. O3measurement in (b) is from Chemiluminescence and (c) is from LP-DOAS.
which is probably caused by the failure of boundary layer simulations in these two days.
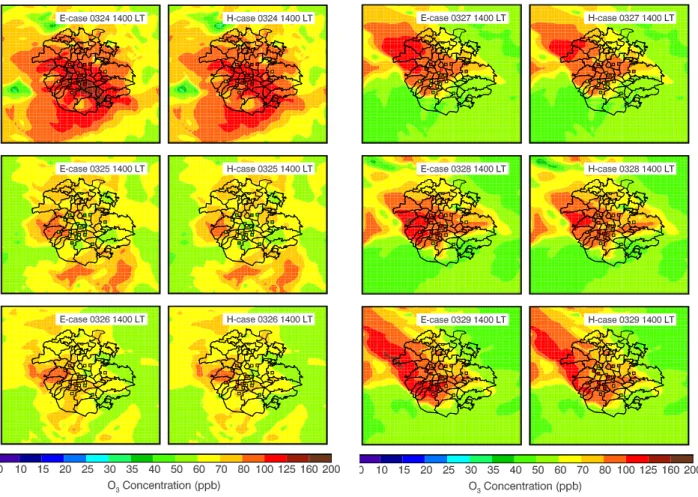
Fig. 9. Pattern comparison of simulated vs. observed O3at 14:00 LT over Mexico City in the E-case (left) and H-case (right) during the 24–29 March 2006. Colored dots: observations; color contour: simulations.
increase of the O3 concentration over the course of the day with a midday average of 7 ppb. In addition, both the E-case and H-case considerably overestimate the O3concentrations in the late afternoon, which is attributed to the slow move-ment of the simulated plume and the overestimation of pho-tolysis rates in the afternoon (Fig. 4). Figures 8b and c show the comparisons of modeled and observed diurnal variation of O3concentrations at T0. The results are similar to that at ambient monitoring sites, except that inclusion of the HONO sources in the WRF-CHEM model improves the simulations of peak O3concentrations. Figure 9 displays the spatial dis-tributions of calculated (in color contours) and observed (in colored dots) near surface O3concentrations at 14:00 LT in the E-case and H-case, respectively. In general, the simulated and observed O3patterns are well matched, but, clearly, the predicted plumes moves more slowly than the observation. For example, at 14:00 LT on 27th, the observed plume has moved to the north of Mexico City, but part of the modeled plume remains stagnant in the center of the city. Further-more, the HONO sources do not alter the O3pattern, but con-siderably enhance the O3level in the center of the plumes.
3.4 Impacts on secondary aerosols
3.4.1 Secondary organic aerosols
In the WRF-CHEM model, a traditional 2-product secondary organic aerosol (SOA) module is applied to predict the aerosol distribution and variation. The SOA module accounts for the SOA formation from the oxidation of six primary or-ganic groups (POG): alkanes, alkenes, cresol, high-yield aro-matics, low-yield aroaro-matics, and monoterpenes. Ten semi-volatile, gaseous SOA precursors (hereafter referred to as to SVOC) are produced via these reactions – two each for olefins, monoterpenes, and aromatics, and one each for alka-nes and cresol.
POG+oxidant→α1SVOC1+α2SVOC2 (R18) The oxidants mainly include the OH radical, the nitrate rad-ical NO3, and O3. The saturation vapor pressures and mass-based stoichiometric yield coefficients (αi) of semi-volatile
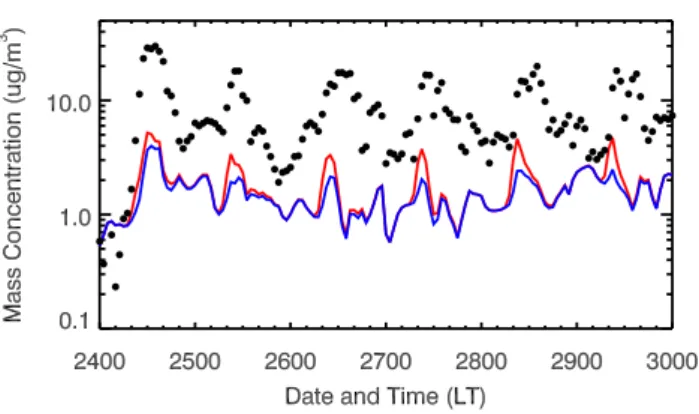
Fig. 10. Simulated submicron SOA and observed submicron OOA at T0 during the 24–29 March 2006. The black dots denote the observation and the red and blue lines represent the simulations in the E-case and H-case, respectively.
based on the absorptive partitioning model of Pankow (1994) that was extended by Odum et al. (1996). When the or-ganic gas/aerosol equilibrium has been established, gas and aerosol-phase concentrations of each SVOC are calculated iteratively using a globally convergent variation of Newton’s method. Therefore, the enhancement of the oxidants will augment the production of SVOCs, especially in the morn-ing when the VOCs accumulate in the PBL. The increase of SVOCs is apt to partition more to aerosol phase and further escalate the SOA concentrations.
Figure 10 shows the comparison of submicron modeled SOA and observed OOA diurnal variation at T0. In the morn-ing, the SOA concentrations are substantially enhanced in the E-case compared to the H-case, with an increase of more than 100% on average. However, during the rest of the day, the en-hancement of the SOA concentrations is not very significant, particularly during nighttime. The observed OOA exhibits clearly two peaks around 10:00 and 14:00 LT from 25 to 29. The E-case and H-case replicates reasonably well these two peaks, but the simulated second peak in the afternoon is not obvious in 25 and 28. Although the E-case yields about 40% more SOA than the H-case averaged in the six days, both the E-case and H-case significantly underestimate the observed OOA concentrations. The E-case produces about 13% of the observed OOA concentrations from the oxidation of anthro-pogenic precursors, consistent with the previous study per-formed by Volkamer et al. (2006). They reported much larger amounts of SOA formed from reactive anthropogenic VOCs in Mexico City than the estimation from a SOA model based on empirical parameterization of chamber experiments. In addition, although the updated aromatic SOA yields from re-cent chamber experiments (Ng et al., 2007) have been em-ployed in a photochemical box model study by Dzepina et al. (2009), the traditional 2-product SOA model still fails to yield sufficient SOA concentrations to match the obser-vations by a factor of 7. Hodzic et al. (2009) also reported that less than 15% of the observed SOA within Mexico City
can be explained by the traditional mechanism based on oxi-dation of anthropogenic precursors.
The large discrepancies between the modeled SOA and ob-served OOA concentrations demonstrate that there are other mechanisms that contribute to the SOA formation, in addi-tion to the one used in this study. Robinson et al. (2007) suggested the formation of SOA from primary semivolatile and intermediate volatility species. Dzepina et al. (2009) have shown that the mechanism can help to close the gap in SOA mass between measurements and models in Mexico City. Additionally, Volkamer et al. (2007) pointed out that glyoxal is also a source of SOA. In the future study, we will evaluate the contributions of the above mechanisms to the SOA concentrations.
3.4.2 Inorganic aerosols
The inorganic aerosols are predicted in the WRF-CHEM model using ISORROPIA Version 1.7 (http://nenes.eas. gatech.edu/ISORROPIA/). ISORROPIA calculates the com-position and phase state of an ammonium-sulfate-nitrate-chloride-sodium-calcium-potassium-magnesium-water inor-ganic aerosol in thermodynamic equilibrium with gas phase precursors. The kind of thermodynamic equilibrium is deli-cately dependent on the environmental humidity and temper-ature. In this study, ISORROPIA is mainly utilized to predict the thermodynamic equilibrium between the ammonium-sulfate-nitrate-water aerosols and their gas phase precursors of H2SO4-HNO3-NH3-water vapor. Accordingly, the in-crease of the OH level due to the HONO sources will impact the inorganic aerosols in the WRF-CHEM model through varying H2SO4and HNO3concentrations.
Fig. 11.Same as Fig. 8, except for(a)HNO3and(b)NH3.
to 29 and the concentrations in the first peak are much higher than those in the second one. When the HONO sources are considered in the E-case, the WRF-CHEM model reason-ably well simulates the first peak but remains underestima-tion from 27 to 29 compared to the observaunderestima-tion. In addiunderestima-tion, the HONO sources cause overestimation of the first peak on 25 and 26. The particle-phase nitrate and ammonium are increased by almost 100% in the E-case compared to the H-case in the morning, but the enhancement is not significant in the afternoon; the slow movement of plumes also results in the overestimation of the particle-phase nitrate and ammo-nium in the late afternoon.
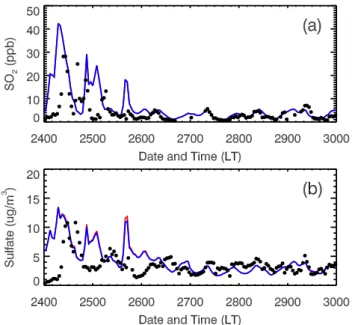
The formation of H2SO4in the atmosphere through the gas phase reaction of SO2with OH is not efficient due to the slow reaction rate. Therefore, the enhancement of the OH concen-trations due to the HONO sources cannot efficiently convert SO2into H2SO4to increase the sulfate aerosols. Figure 13a displays the diurnal variations of SO2 concentrations in the E-case and H-case compared with the measurement at T0. The impacts of the HONO sources on the SO2 concentra-tions are negligible and the reduction of SO2concentrations in the E-case is less than 1% during the daytime on aver-age in comparison with that in the H-case. The WRF-CHEM model basically tracks the observed variation of SO2 concen-trations during the daytime, but fails to reproduce the large fluctuations of the observations during the afternoon and at night. The impacts of the HONO sources on the sulfate at T0 are also negligible, indicating that the gas phase reaction of SO2with OH plays a minor role in the sulfate formation (Fig. 13b). Other sources, such as the oxidation of SO2 in cloud droplets as well as the transport of direct emissions of sulfate from the Tula industrial complex and the volcano, may play a key role in the sulfate concentrations in Mexico City (de Foy et al., 2009).
Fig. 12. Same as Fig. 8, except for submicron(a)nitrate and(b) ammonium aerosols.
Fig. 13. Same as Fig. 8, except for(a)SO2and (b) submicron sulfate aerosols.
4 Conclusions
reaction with freshly emitted soot, NO2 heterogeneous re-action on aerosol and ground surfaces. When only the gas phase reaction is considered, the WRF-CHEM model fails to predict the high levels of HONO concentrations observed at T0 by a factor of 10, consistent with previous studies. In con-trast, the WRF-CHEM model with the four additional HONO sources performs well in tracking the diurnal variation of the HONO concentrations, although it frequently underestimates HONO concentrations in the afternoon. Quantification of the contribution from individual sources in the ground level shows that secondary HONO formation from NO2 hetero-geneous reaction with semivolatile organics is the most im-portant sources in Mexico City, providing about 75% of the HONO formation. The NO2reaction on ground surfaces also plays an important role in the HONO formation, with about 18% contribution near the surface. The contributions from the NO2reaction with newly emitted soot and heterogeneous reaction on aerosol surfaces is negligible.
Based on the simulations with only the homogeneous reac-tion and with the addireac-tional HONO sources, we evaluate the impacts of the HONO sources on the HOx/NOx/O3 chem-istry and secondary aerosols. When the additional HONO sources are considered, the WRF-CHEM model significantly increases the HOx concentration, yielding better agreement with the measurements than if only the gas phase reac-tion source is considered. Inclusion of addireac-tional HONO sources alters the partition of NO/NO2 and converts more NO into NO2, particularly in the morning. Although the WRF-CHEM model including the five HONO sources can-not improve the simulations of the occurrence of peak NO2 concentrations, it performs quite well in modeling the NO variability compared to the observations at T0. The HONO sources accelerate the accumulation of O3concentrations av-eraged over all the ambient monitoring sites in the morning by about 2 h and subsequently lead to a noticeable enhance-ment of O3 concentrations over the course of the day with a midday average of about 6 ppb. The WRF-CHEM model considerably overestimates O3concentrations in the late af-ternoon whether the additional HONO sources are consid-ered or not, which is mainly caused by the slow movement of the simulated plumes and overestimation of the photolysis rates.
The HONO sources also play a very important role in the formation of secondary aerosols in the morning. The HONO sources substantially enhance the SOA concentrations by a factor of 2 on average in the morning, but contribute less during the rest of the day. It is worthy to note that the tradi-tional 2-product SOA mechanism fails to predict high levels of SOA mass comparable to the observations at T0, which agrees well with the other studies in Mexico City (Volka-mer et al., 2006; Dzepina et al., 2009; Hodzic et al., 2009). The particle-phase nitrate and ammonium are significantly enhanced in the morning when all five HONO sources are included, and agree better with the measurements at T0 com-pared to the results with only gas phase HONO source. Due
to the inefficient conversion of H2SO4 from SO2 reaction with OH, the impact of the HONO sources to the sulfate aerosols is negligible.
Generally speaking, the HONO sources play an important role in the photochemistry in the morning by enhancing the OH concentration in Mexico City. If the air quality in the morning is of much concern in urban regions, it may be nec-essary to include these HONO sources in air quality models. However, except the gas-phase reaction of NO with OH, the other four HONO sources are all associated with NO2, so the importance of these four HONO sources is dependent on the NO2level, i.e., there is a NOxthreshold to activate the importance of these HONO sources.
Furthermore, it is important to emphasize that the model period is not representative of all the MCMA-2006 cam-paign duration, but rather exemplifies the periods with ele-vated daytime HONO observed in the MCMA, and that dur-ing these periods the formation of secondary pollutants has a particular sensitivity to HONO concentrations. Addition-ally, meteorological conditions also play a key role in de-termining the accumulation or dispersion of HONO (as well as other species), also influencing its lifetime via changing chemical processes. Therefore, meteorological conditions significantly influence the evaluation of the impact of HONO sources on the photochemistry in the polluted urban atmo-sphere.
Acknowledgements. We are indebted to the large number of people involved in the MILAGRO field campaign as well as those involved in long-term air quality monitoring and the emissions inventory in the Mexico City metropolitan area, which made this study possible. This work was supported by the US National Science Foundation’s Atmospheric Chemistry Program (ATM-0528227) and the Molina Center for Energy and the Environment. Acknowledgment is also made to the National Center for Atmos. Res., which is sponsored by the National Science Foundation, for the computing time used in this research.
Edited by: S. Madronich
References
Acker, K., M¨oller, D., Auel, R., Wieprecht, W., and Kala, D.: Concentrations of nitrous acid, nitric acid, nitrite and nitrate in the gas and aerosol phase at a site in the emission zone during ESCOMPTE 2001 experiment, Atmos. Res., 74(1–4), 507–524, 2005.
organic source apportionment, Atmos. Chem. Phys., 9, 6633– 6653, doi:10.5194/acp-9-6633-2009, 2009.
Alicke, B., Platt, U., and Stutz, J.: Impact of nitrous acid photolysis on the total hydroxyl radical budget during the Limitation of Ox-idant Production/Pianura Padana Produzione di Ozono study in Milan, J. Geophys. Res., 107, 8196, doi:10.1029/2000JD000075, 2002.
Alicke, B., Geyer, A., Hofzumahaus, A., Holland, F., Kon-rad, S., P¨atz, H. W., Sch¨afer, J., Stutz, J., Volz-Thomas, A., and Platt, U.: OH formation by HONO photolysis during the BERLIOZ experiment, J. Geophys. Res., 108(D4), 8274, doi:10.1029/2001JD000579, 2003.
Ammann, M., Kalberer, M., Jost, D. T., Tobler, L., Rossler, E., Piguet, D., Gaggeler, H. W., and Baltensperger, U.: Heterge-neous production of nitrous acid on soot in polluted air masses, Nature, 395, 157–160, 1998.
Arens, F., Gutzwiller, L., Baltensperger, U., Gaggeler, H. W., and Ammann, M.: Heterogeneous reaction of NO2 on diesel soot particles, Environ. Sci. Technol., 35, 2191–2199, 2001. Aumont, B., Chervier, F., and Laval, S.: Contribution of HONO
sources to the NOx/HOx/O3chemistry in the polluted boundary layer, Atmos. Environ., 37, 487–498, 2003.
Aumont, B., Madronich, S., Ammann, M., Kalberer, M., Baltens-berger, U., Hauglustine, D., and Brocheton, F.: On the reaction of NO2+ soot in the atmosphere, J. Geophys. Res., 104, 1729– 1736, 1999.
Bei, N., de Foy, B., Lei, W., Zavala, M., and Molina, L. T.: Using 3DVAR data assimilation system to improve ozone simulations in the Mexico City basin, Atmos. Chem. Phys., 8, 7353–7366, doi:10.5194/acp-8-7353-2008, 2008.
Bejan, I., Aal, Y. A. E., Barnes, I., Benter, T., Bohn, B., Wiesen, P., and Kleffmann, J.: The photolysis of ortho-nitrophenols: a new gas phase source of HONO, Phys. Chem. Chem. Phys., 8, 2028–2035, 2006.
Binkowski, F. S. and Roselle, S. J.: Models-3 Commu-nity Multiscale Air Quality (CMAQ) model aerosol com-ponent: 1. Model description, J. Geophys. Res., 4183, doi:10.1029/2001JD001409, 2003.
Brasseur, G. P., Orlando, J. J., and Tyndall, G. S.: Atmospheric chemistry and global change, Oxford University Press, New York, USA, 654 pp., 1999.
Calvert, J. G., Yarwood, G., and Dunker, A. M.: An evaluation of the mechanism of nitrous acid formation in the urban atmo-sphere, Res. Chem. Int., 20(3–5), 463–502, 1994.
Chen, F. and Dudia, J.: Coupling an advanced land-surface/hydrology model with the Penn State/NCARMM5modelingsystem. Part I: Model descrip-tion and implementadescrip-tion, Mon. Weather Rev., 129, 569–585, 2001.
Clapp, L. J. and Jenkin, M.: Analysis of the relationship between ambient levels of O3, NO2and NO as a function of NOxin the UK, Atmos. Environ., 35, 6391–6405, 2001.
de Foy, B., Fast, J. D., Paech, S. J., Phillips, D., Walters, J. T., Coulter, R. L., Martin, T. J., Pekour, M. S., Shaw, W. J., Kasten-deuch, P. P., Marley, N. A., Retama, A., and Molina, L. T.: Basin-scale wind transport during the MILAGRO field campaign and comparison to climatology using cluster analysis, Atmos. Chem. Phys., 8, 1209–1224, doi:10.5194/acp-8-1209-2008, 2008. de Foy, B., Krotkov, N. A., Bei, N., Herndon, S. C., Huey, L. G.,
Martnez, A.-P., Ruiz-Surez, L. G., Wood, E. C., Zavala, M., and Molina, L. T.: Hit from both sides: tracking industrial and vol-canic plumes in Mexico City with surface measurements and OMI SO2 retrievals during the MILAGRO field campaign, At-mos. Chem. Phys., 9, 9599–9617, doi:10.5194/acp-9-9599-2009, 2009.
Dudhia, J.: Numerical study of convection observed during the winter monsoon experiment using a mesoscale two-dimensional model, J. Atmos. Sci., 46, 3077–3107, 1989.
Dusanter, S., Vimal, D., Stevens, P. S., Volkamer, R., and Molina, L. T.: Measurements of OH and HO2 concentrations during the MCMA-2006 field campaign – Part 1: Deployment of the Indiana University laser-induced fluorescence instrument, At-mos. Chem. Phys., 9, 1665–1685, doi:10.5194/acp-9-1665-2009, 2009a.
Dusanter, S., Vimal, D., Stevens, P. S., Volkamer, R., Molina, L. T., Baker, A., Meinardi, S., Blake, D., Sheehy, P., Merten, A., Zhang, R., Zheng, J., Fortner, E. C., Junkermann, W., Dubey, M., Rahn, T., Eichinger, B., Lewandowski, P., Prueger, J., and Holder, H.: Measurements of OH and HO2concentrations dur-ing the MCMA-2006 field campaign: Part 2 – Model compar-ison and radical budget, Atmos. Chem. Phys., 9, 6655–6675, doi:10.5194/acp-9-6655-2009, 2009b.
Dzepina, K., Volkamer, R. M., Madronich, S., Tulet, P., Ulbrich, I. M., Zhang, Q., Cappa, C. D., Ziemann, P. J., and Jimenez, J. L.: Evaluation of recently-proposed secondary organic aerosol models for a case study in Mexico City, Atmos. Chem. Phys., 9, 5681–5709, doi:10.5194/acp-9-5681-2009, 2009.
Febo, A., De Santis, F., Perrino, C., and Liberti, A.: The study of the reaction between nitrogen oxides and water vapor by means of annular denuder tubes, in Tropospheric NOxChemistry-Gas Phase and Multiphase Aspects, CEC Air Pollut. Res. Rep. 9, Nielsen & Cox, Rosklide, Denmark, 61–67, 1987.
Febo, A., Perrino, C., and Allegrini, I.: Measurement of nitrous acid in Milan, Italy, by DOAS and diffusion denuders, Atmos. Environ., 30, 3599–3609, 1996.
Grell, G. A., Peckham, S. E., Schmitz, R., McKeen, S. A., Wilczak, J., and Eder, B.: Fully coupled “online” chemistry within the WRF model, Atmos. Environ., 39, 6957–6975, 2005.
George, C., Strekowski, R. S., Kleffmann, J., Stemmler, K., and Bencze, L.: Photoenhanced uptake of gaseous NO2on solid or-ganic compounds: A photochemical source of HONO?, Faraday Discuss, 130, 195–210, 2005.
Guenther, A., Karl, T., Harley, P., Wiedinmyer, C., Palmer, P. I., and Geron, C.: Estimates of global terrestrial isoprene emissions using MEGAN (Model of Emissions of Gases and Aerosols from Nature), Atmos. Chem. Phys., 6, 3181–3210, doi:10.5194/acp-6-3181-2006, 2006.
Guenther, A.: Corrigendum to “Estimates of global terrestrial isoprene emissions using MEGAN (Model of Emissions of Gases and Aerosols from Nature)” published in Atmos. Chem. Phys., 6, 3181–3210, 2006, Atmos. Chem. Phys., 7, 4327–4327, doi:10.5194/acp-7-4327-2007, 2007.
Gutzwiller, L., Arens, F., Baltensperger, U., Gaggeler, H. W., and Ammann, M.: Significance of semivolatile diesel exhaust organ-ics for secondary HONO formation, Environ. Sci. Technol., 36, 677–682, 2002.
atmosphere and implications for predictions of ozone-precursor relationships, Environ. Sci. Technol., 16, 414–419, 1982. Harrison, R. M., Peak, J. D., and Collins, G. M.: Tropospheric cycle
of nitrous acid, J. Geophys. Res., 101, 14429–14439, 1996. Hess, P. G., Flocke, S., Lamarque, J. F., Barth, M. C., and
Madronich, S.: Episodic modeling of the chemical structure of the troposphere as revealed during the spring MLOPEX 2 inten-sive, J. Geophys. Res., 105, 26809–26839, 2000.
Hofzumahaus, A., Rohrer, F., Lu, K., Bohn, B., Brauers, T., Chang, C., Fuchs, H., Holland, F., Kita, K., Dondo, Y., Li, X., Lou, S., Shao, M., Zeng, L., Wahner, A., and Zhang, Y.: Amplified trace gas removal in the troposphere, Science, 324, 1702–1704, 2009. Horowitz, L. W., Walter, S., Mauzerall, D. L., et al.: A global simu-lation of tropospheric ozone and related tracers: Description and evaluation of MOZART, version 2, J. Geophys. Res., 108(D24), 4784, doi:10.1029/2002JD002853, 2003.
Hodzic, A., Jimenez, J. L., Madronich, S., Aiken, A. C., Bessag-net, B., Curci, G., Fast, J., Lamarque, J.-F., Onasch, T. B., Roux, G., Schauer, J. J., Stone, E. A., and Ulbrich, I. M.: Modeling organic aerosols during MILAGRO: importance of biogenic sec-ondary organic aerosols, Atmos. Chem. Phys., 9, 6949–6981, doi:10.5194/acp-9-6949-2009, 2009.
Jenkin, M. E., Cox, R. A., and Williams, D. J.: Laboratory studies of the kinetics of formation of nitrous acid from the thermal reaction of nitrogen dioxide and water vapor, Atmos. Environ., 22, 487– 498, 1988.
Kalberer, M., Ammann, M., Arens, F., G¨aggeler, H. W., and Baltensperger, U.: Heterogeneous formation of nitrous acid (HONO) on soot aerosol particles, J. Geophys. Res., 104, 13825– 13832, 1999.
Kleffmann, J., Becker, K. H., and Wiesen, P.: heterogeneous NO2 conversion process on acid surfaces: possible atmospheric impli-cations, Atmos. Environ., 32, 2721–2729, 1998.
Kleffmann, J., Becker, K. H., Lackhoff, M., and Wiesen, P.: Het-erogeneous conversion of NO2and HONO on carbonaceous sur-faces, Phys. Chem. Phys., 1, 5443–5450, 1999.
Kleffmann, J., Lorzer, J. C., Wiesen, P., Kern, C., Trick, S., Volka-mer, R., Rodenas, M., and Wirtz, K.: Intercomparison of the DOAS and LOPAP techniques for the detection of nitrous acid (HONO), Atmos. Environ., 40, 3640–3652, 2006.
Kleffmann, J.: Daytime sources of nitrous acid (HONO) in the at-mospheric boundary layer, Chem. Phys. Chem., 8, 1137–1144, 2007.
Kotamarthi, V. R., Gaffney, J. S., Marley, N. A., and Doskey, P. V.: Heterogeneous NOxchemistry in the polluted PBL, Atmos. Environ., 35, 4489–4498, 2001.
Kurtenbach, R., Becker, K. H., Gomes, J. A. G., Kleffmann, J., Lorzer, J. C., Spittler, M., Wiesen, P., Ackermann, R., Geyer, A., and Platt, U.: Investigations of emissions and heterogeneous formation of HONO in a road traffic tunnel, Atmos. Environ., 35, 3385–3394, 2001.
Lammel, G. and Cape, J. N.: Nitrous acid and nitrite in the atmo-sphere, Chem. Soc. Rev., 25, 361–369, 1996.
Lammel, G. and Perner, D.: The atmospheric aerosols as a source of nitrous acid in the polluted troposphere, J. Aerosol Sci., 19, 1199–1202.
Li, G., Zhang, R., Fan, J., and Tie, X.: Impacts of black carbon aerosol on photolysis and ozone, J. Geophys. Res., 110, D23206, doi:10.1029/2005JD005898, 2005.
Lei, W., Zhang, R., Tie, X., and Hess, P.:, Chemical characterization of ozone formation in the Houston-Galveston area, J. Geophys. Res., 109, D12301, doi:10.1029/2003JD004219, 2004.
Lin, Y.-L., Farley, R. D., and Orville, H. D., Bulk parameterization of the snow field in a cloud model, J, Appl, Meteorol,, 22, 1065– 1092, 1983.
Merten, A.: New design of Long path-DOAS instruments based on fibre optics and applications in the study of the urban atmosphere, Thesis, Heidelberg Univ., Germany, 2008.
Mlawer, E. J., Taubman, S. J., Brown, P. D., Iacono, M. J., and Clough, S. A.: Radiative transfer for inhomogeneous atmo-sphere: RRTM, a validated correlated-k model for the long-wave, J. Geophys. Res., 102(D14), 16663–16682, 1997.
Molina, L. T., Madronich, S., Gaffney, J. S., and Singh, H. B.: Overview of MILAGRO/INTEX-B Campaign, IGAC Newslet-ter, Issue No. 38, pp. 2–15, 2008.
Molina, L. T., Madronich, S., Gaffney, J. S., Apel, E., de Foy, B., Fast, J., Ferrare, R., Herndon, S., Jimenez, J. L., Lamb, B., Osornio-Vargas, A. R., Russell, P., Schauer, J. J., Stevens, P. S., and Zavala, M.: An overview of the MILAGRO 2006 campaign: Mexico City emissions and their transport and transformation, Atmos. Chem. Phys. Discuss., 10, 7819–7983, doi:10.5194/acpd-10-7819-2010, 2010.
Monge, M. E., D’Anna, B., Mazri, L., Giroir-Fendler, A., Am-mann, M., Donaldson, D. J., and George, C.: Light changes the atmospheric reactivity of soot, Proc. Natl. Acad. Sci., 107, 6605– 6609, 2010.
Ndour, M., D’Anna, B., George, C., Ka, O., Balkanski, Y., Kleffmann, J., Stemmler, K., and Ammann, M.: Photoen-hanced uptake of NO2on mineral dust: Laboratory experiments and model simulations, Geophys. Res. Lett., 35(5), L05812, doi:10.1029/2007GL032006, 2008.
Ng, N. L., Kroll, J. H., Chan, A. W. H., Chhabra, P. S., Flagan, R. C., and Seinfeld, J. H.: Secondary organic aerosol formation from m-xylene, toluene, and benzene, Atmos. Chem. Phys., 7, 3909–3922, doi:10.5194/acp-7-3909-2007, 2007.
Noh, Y., Cheon, W. G., and Raasch, S.: The improvement of the K-profile model for the PBL using LES. Preprints, Int. Workshop of Next Generation NWP Models, Seoul, South Korea, Laboratory for Atmospheric Modeling Research, 65–66, 2001.
Odum, J. R., Hoffman, T., Bowman, F., Collins, D., Flagan, R. C., and Seinfeld, J. H.:, Gas/particle partitioning and secondary organic aerosol yields, Environ. Sci. Technol., 30, 2580–2585, 1996.
Olaguer, E. P., Rappengluck, B., Lefer, B., Stutz, J., Dibb, J., Grif-fin, R., Brune, W. H., Shauck, M., Buhr, M., Jeffries, H., Vizuete, W., and Pinto, J. P.: Deciphering the Role of Radical Precursors during the Second Texas Air Quality Study, J. Air Waste Manage. Assoc., 59, 1258–1277, 2009.
Pankow, J. F.: An absorption model of gas/particle partitioning in-volved in the formation of secondary organic aerosol, Atmos. Environ., 28, 189–193, 1994.
Schell, B., Ackermann, I. J., Hass, H., Binkowski, F. S., and Ebel A.: Modeling the formation of secondary organic aerosol within a comprehensive air quality modeling system, J. Geophys. Res., 106, 28275–28293, 2001.
Svensson, R., Ljungstrom, E., and Lindquist, O.: Kinetics of the reaction between nitrogen dioxide and water vapour, Atmos. En-viron., 21, 1529–1539, 1987.
Skamarock, W. C., Klemp, J. B., Dudhia, J., Gill, D. O., Barker, D. M., Wang, W., and Powers, J. G.: A description of the Ad-vanced Research WRF Version 2, NCAR Tech Notes-468+STR, National Center for Atmos. Res., Boulder, CO, USA, 100 pp., 2005.
Song, J., Lei, W., Bei, N., Zavala, M., de Foy, B., Volkamer, R., Cardenas, B., Zheng, J., Zhang, R., and Molina, L. T.: Ozone response to emission changes: a modeling study during the MCMA-2006/MILAGRO Campaign, Atmos. Chem. Phys., 10, 3827–3846, doi:10.5194/acp-10-3827-2010, 2010.
Staffelbach, T., Neftel, A., and Horowitz, L. W.: Photochemical oxidant formation over southern Switzerland. 2. Model results, J. Geophys. Res., 102, 23363–23373, 1997.
Sheehy, P. M., Volkamer, R., Molina, L. T., and Molina, M. J.: Oxidative capacity of the Mexico City atmosphere – Part 2: A ROxradical cycling perspective, Atmos. Chem. Phys. Discuss., 8, 5359–5412, 2008.
Stemmler, K., Ammann, M., Donders, C., Kleffmann, J., and George, C.: Photosensitized reduction of nitrogen dioxide on hu-mic acid as a source of nitrous acid, Nature, 440, 195–198, 2006. Stemmler, K., Ndour, M., Elshorbany, Y., Kleffmann, J., D’Anna, B., George, C., Bohn, B., and Ammann, M.: Light induced con-version of nitrogen dioxide into nitrous acid on submicron humic acid aerosol, Atmos. Chem. Phys., 7, 4237–4248, 2007. Stutz, J., Kim, E. S., Platt, U., Bruno, P., Perrino, C., and Febo, A.:
UV-invisible absorption cross section of nitrous acid, J. Geophys. Res., 105(D11), 14585–4592, 2000.
Tie, X., Madronich, S., Walters, S., Zhang, R., Rasch, P., and Collins, W.: Effect of clouds on photolysis and oxi-dants in the troposphere, J. Geophys. Res., 108(D20), 4642, doi:10.1029/2003JD003659, 2003.
Tie, X., Madronich, S., Li, G., Ying, Z., Zhang, R., Garcia, A. R., Taylor, L., and Liu, Y.: Characterizations of chemical oxidants in Mexico City: A regional chemical dynamical model (WRF-Chem) study, Atmos. Environ., 41, 1989–2008, 2007.
Vogel, B., Vogel, H., Kleffmann, J., and Kurtenbach, R.: Measured and simulated vertical profiles of nitrous acid—Part II. Model simulations and indications for a photolytic source, Atmos. Env-iron., 37, 2957–2966, 2003.
Volkamer, R., Jimenez, J. L., San Martini, F., Dzepina, K., Zhang, Q., Salcedo, D., Molina, L. T., Worsnop, D. R., and Molina, M. J.: Secondary organic aerosol formation from anthropogenic air pollution: Rapid and higher than expected, Geophys. Res. Lett., 33(17), L17811, doi:10.1029/2006GL026899, 2006.
Volkamer, R., Sheehy, P. M., Molina, L. T., and Molina, M. J.: Ox-idative capacity of the Mexico City atmosphere – Part 1: A rad-ical source perspective, Atmos. Chem. Phys. Discuss., 7, 5365– 5412, doi:10.5194/acpd-7-5365-2007, 2007.
Wesely, M. L.: Parameterization of surface resistance to gaseous dry deposition in regional-scale numerical models, Atmos. Env-iron., 23, 1293–1304, 1989.
Willmott, C. J. and Wicks, D. E.: An empirical method for the spatial interpolation of monthly precipitation within California, Phys. Geogr., 1, 59–73, 1980.
Winer, A. M. and Biermann, H. W.: Long pathlength differen-tial optical absorption spectroscopy (DOAS) measurements of gaseous HONO, NO2and HCHO in the California South Coast Air Basin, Res. Chem. Intermed., 20, 423–445, 1994.
Zavala, M., Herndon, S. C., Wood, E. C., Jayne, J. T., Nelson, D. D., Trimborn, A. M., Dunlea, E., Knighton, W. B., Mendoza, A., Allen, D. T., Kolb, C. E., Molina, M. J., and Molina, L. T.: Com-parison of emissions from on-road sources using a mobile lab-oratory under various driving and operational sampling modes, Atmos. Chem. Phys., 9, 1–14, doi:10.5194/acp-9-1-2009, 2009. Zhang, R., Leu, M.-T., and Keyser, L. F., Heterogeneous chemistry
of HONO on liquid sulfuric acid: A new mechanism of chlorine activation on stratospheric sulfate aerosols, J. Phys. Chem., 100, 339–345, 1996.
Zheng, J., Zhang, R., Fortner, E. C., Volkamer, R. M., Molina, L., Aiken, A. C., Jimenez, J. L., Gaeggeler, K., Dommen, J., Du-santer, S., Stevens, P. S., and Tie, X., Measurements of HNO3 and N2O5using ion drift-chemical ionization mass spectrometry during the MILAGRO/MCMA-2006 campaign, Atmos. Chem. Phys., 8, 6823–6838, doi:10.5194/acp-8-6823-2008, 2008. Zhou, X., Beine, H. J., Honrath, R. E., Fuentes, J. D., Simpson, W.,