© 2014 H.H. Goh et al., This open access article is distributed under a Creative Commons Attribution (CC-BY) 3.0 license
doi:10.3844/ajeassp.2013.340.351 Published Online 6 (4) 2013 (http://www.thescipub.com/ajeas.toc)
Corresponding Author: Goh, H.H., Departmentof Electrical Power Engineering, Faculty of Electrical and Electronic Engineering, Universiti Tun Hussein Onn Malaysia, 86400 Parit Raja, BatuPahat, Johor, Malaysia
CRITICAL AGING SEGMENTS OF
POWER TRANSMISSION LINE
1
Goh, H.H.,
1N.E. Chin,
1Q.S. Chua,
1S.W. Lee,
2K.C. Goh and
3K.T.K. Teo
1
Departmentof Electrical Power Engineering, Faculty of Electrical and Electronic Engineering, 2
Departmentof Construction Management, Faculty of Technology Management and Business, UniversitiTun Hussein Onn Malaysia, 86400 Parit Raja, BatuPahat, Johor, Malaysia 3
Modelling, Simulation and Computing Laboratory, Level 3, Block C, School of Engineering and Information Technology, Jalan UMS, Universiti Malaysia Sabah, 88400 Kota Kinabalu, Sabah, Malaysia
Received 2013-11-24; Revised 2013-11-28; Accepted 2013-12-09
ABSTRACT
Nowadays, blackouts or sags of a conductor are threatening the safety and stable run of the power transmission lines. These phenomena happen due to the environmental conditions which change over the time, such as aging or temperature variations, precipitation and hotspots of power transmission lines as a result of extreme weather conditions. A precipitation condition result loses of heat from transmission line. Besides, the conductor aging and hotspots of a transmission line can lead to the loss of conductor strength, which may increase the probability of blackouts. All the damage suffers by the transmission line will cause the service interruption and required high cost to repair. Consequently, appropriate methods are required to monitor the condition of power transmission lines where the segment of the power transmission line which requires more repair or reinforcement can be identified early. This research work introduces the new novel to identify the critical aging segments and the hotspot power transmission lines. This method depends on the information about the power transmission line and its environment such as temperature variations and characteristics of the conductors. Besides that, the effect of the weather and radiative parameters on the conductor temperature are being considered as well in this research.The results in this research work had discovered the most significant impacts the conductor aging behaviour was conductor temperature. Convection heat loss is more consequential that radiation heat loss in terms of determination the conductor temperature.
Keywords: Conductor Aging, Emissivity, Hotspots, Radiated Heat Loss, Thermal Rating
1. INTRODUCTION
The electric transmission system is more complex and dynamic as compared to the other utility systems. In composite power transmission systems, the amount of power from a line at any given moment is depending on the generation production and transmits, customers’ usage, the status of other transmission lines and the associated equipments and even the weather as well. Environment stress which changing over the time affects the electrical performances of the transmission lines, such as the blackouts of a conductor which are threatening the safety and stable run on the power transmission lines.
Thus, the behaviour of thermal aging was computed through the determination of current-carrying capacity and also the conductor temperature (Chen et al., 2003; Massaro and Dusonchet, 2008; Bhuiyan et al., 2010; Heckenbergerova et al., 2010a; 2010b).
In this study, methodology for evaluating conductor thermal aging is summarized briefly. The main part of this study describes a case study that determines nominal constant load current and the conductor temperature is calculated based on (IEEE, 2007) and aging due to the loss of a conductor tensile strength is estimated at each tower along the transmission line. Subsequently, the spatial series of a conductor is used for identification of critical aging segments and localization of hotspots. The effect of weather conditions and radiative parameters on conductor temperature and thermal aging of a conductor is then evaluated.
This study is organized into five sections. Section 2 provides the background information on a conductor thermal state and aging behaviour. The methodology being used for evaluation of thermal aging is described in section 3. A case study involving a sample transmission line is presented in section 4. The last section provides major conclusions.
2. BACKGROUND
In order to evaluate aging of an overhead conductor, it is required to calculate its thermal load.
2.1. Calculation of Conductor Thermal Load
The study that outlined by (IEEE, 2007) is referred for thermal ratings of the conductors. In steady state condition, the heat balance equation can be expressed in the form Equation (1):
2
s c r 0
Q −Q −Q +IR(T )=0 (1)
For precipitation condition (Pytlak et al., 2009), the evaporation heat loss is having effect on the conductor.
The joule heat gain in the conductor depends on the average temperature of the conductor while the convection, radiation and evaporation heat losses depend on the temperature at the surface of the conductor.
2.2. Conductor Aging Behaviour
Conductor aging is an obvious process affecting all components of electric power transmission systems. Major factor that causes conductor aging is annealing which due to high line temperature. Annealing is the process where the tensile strength of a copper or aluminium conductor is reduced at the sustained high temperatures. Although the conductor strength is reduced gradually, the reduction due to conductor aging, which is accumulated over time is increasing the probability of blackouts.
The loss of the tensile strength is caused by the recrystallization process in aluminium strands. It is operated at elevated temperatures depends on the temperature and the time duration at that temperature (Ab-Rahman and Shuhaimi, 2012a; 2012b). Since the strand conductor used in ACSR is aluminium, the percent loss of tensile strength of an aluminium conductor strand is defined as Equation (3):
Al .t c
1.6
L 100 k (0.001.T 0.095)
0.63 r
= − − −
⋅ (3)
Where:
r = The strand diameter (mm) t = The exposure time (hrs) Tc = The conductor temperature (°C)
c k=134−0.24 T⋅
Equation 1 is only valid in determining the loss of strength for a single aluminium strand. The total loss of tensile strength in an ACSR conductor, Lc is determined as
Where:
S = The total strength of conductor before annealing S’ = Total strength of conductor after annealing
2.3. Current Rating
Current rating is defined as the maximum amount of electrical current which a conductor can carry before sustaining immediate or progressive deterioration (Hayakawa et al., 2011). The current rating of aluminium conductors is limited by the conductor’s maximum operating temperature. In order to avoid the happen of annealing, calculation of current rating is required to ensure the current passing through the transmission line does not cause it to exceed its limits (Silva et al., 2013).
Current rating of a power transmission line depends on the physical and electrical properties of the material used in the conductor, ambient temperature and environmental conditions adjoining to the conductor. Besides, current rating is computed from Equation 1 and can be defined as Equation (5):
( )
rc sc
Q Q Q
R T
I= + − (5)
3. METHODOLOGY
In order to compute the reduction in tensile strength of the conductor, a number of factors must be considered. There are:
• Characteristic and material of the conductor such as the type and size of the conductor used, theirs location and height above ground
• Weather information: Current and historical records of environment and ambient weather conditions
The factors above are used to estimate the conductor aging at each tower along the transmission line. The methodology for computing conductor aging consists of following three steps:
• Determination of the conductor temperature using measured load current and weather data
• Determination of cumulative loss of tensile strength due to annealing, LAI
• Determination of the combined loss of tensile strength, Lc for composite conductor
The methodology for partial analysis of conductor aging is included of the following steps:
• Determination of the spatial series of conductor aging, {Lc}, along the power transmission line
• Computation of the value of mean, µ and standard deviation, σ, of the series
• Standardized of the aging series Equation (6):
std c c
L
L = − µ
σ (6)
Determination of critical aging segments along the line as sets of towers whose loss of strength is greater than or equal to a given threshold, e.g., Equation (7):
c
std
L ≥1 (7)
Localization of hotspots by finding maxima of each critical aging segment.
4. RESULTS AND ANALYSIS
4.1. Case Study
A sample of transmission line in Kluang, Johore, Malaysia has been chosen in this research work. This transmission line is supported by 77 transmission towers. The conductor used is Aluminium Conductors Steel Reinforced (ACSR) conductor “Batang” with outer diameter 24.16 mm (Industries, 1957) and a measured nominal current of 600A. The emissivity and solar absorptively of the conductor are measured corresponding to a conductor that has been in operation for 20 years, which are Є = 0.85 and σ = 0.99 respectively (Abu Zarim, 2011).
Weather information about the sample line has been provided by Meteorological Department, Malaysia (JMM, 1958). The data of information consist of monthly data of ambient temperature, wind speed and humidity for three years, from 01/2008 to 12/2010. At first, all the meteorological variables were used to calculate the conductor temperature. All the results computed are illustrated at tower 53.
4.2. Results for Spatial Analysis of Conductor
Thermal Aging
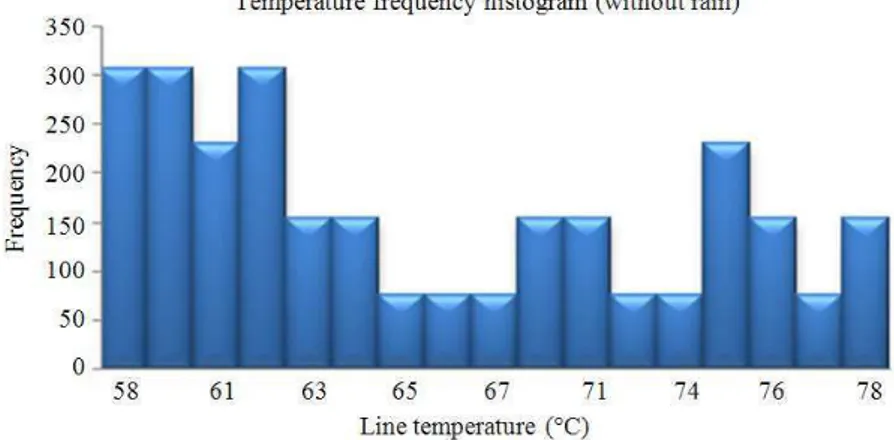
Two circumstances have to consider in this study, there is a steady-state condition without considering precipitation and with considering the precipitation condition. This is illustrated in Fig. 1 and 2, which show a frequency histogram of conductor operating temperatures for the sample transmission tower, over three-year periods. Besides that, spatial distribution of conductor thermal aging {LC} is shown in Fig. 3 and
the standardized thermal aging series {Lcstd} with
Fig. 1.Temperature frequency histogram for tower 77 over three-year period
Fig. 2. Temperature frequency histogram for tower 77 over three-year period In the meanwhile, the summary of critical aging
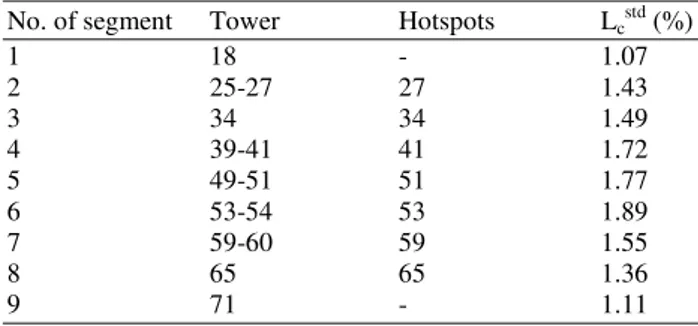
segments and their hotspots with correspondent thermal aging of sample transmission line is provided in Table 1.
4.3. Analysis for Spatial Analysis of Conductor
Thermal Aging
From Fig. 1 and 2, clearly show that the temperature of the wet conductor (under precipitation) is lower than the temperature of the dry conductor.
Since ACSR conductors have steel cores, their overall loss of tensile strength is substantially reduced. The ACSR conductor “Batang”, considered for this study, has 18 aluminium strands with the diameter of 4.78mm and steel core of 7 strands with the diameter of 1.68mm. Thus, loss of tensile strength of aluminium strands is computed as shown in Fig. 3 which was
completed with basic statistical parameters (mean µ = 0.8090 and standard deviation σ = 0.0064). For tower 53, the total loss of strength of the compound ACSR conductor is Lc = 0.81% (over the 20 year period).
After determining the loss of tensile strength for 77 towers, critical aging segments and hotspots were localized using methodology mentioned in section 3. Then, standardized aging series {Lcstd} is determined. According
to methodology in section 3, the loss of strength is greater than or equal to a given threshold in order to determine the aging segments of the transmission line, which is {Lcstd}≥1.
Table 1. Summary of critical aging segments and their hotspots with correspondent thermal aging of sample transmission line
No. of segment Tower Hotspots Lc
std (%)
1 18 - 1.07
2 25-27 27 1.43
3 34 34 1.49
4 39-41 41 1.72
5 49-51 51 1.77
6 53-54 53 1.89
7 59-60 59 1.55
8 65 65 1.36
9 71 - 1.11
4.4. Results
for
Environment
Effect
on
Temperature and Aging Segments of the
Conductor
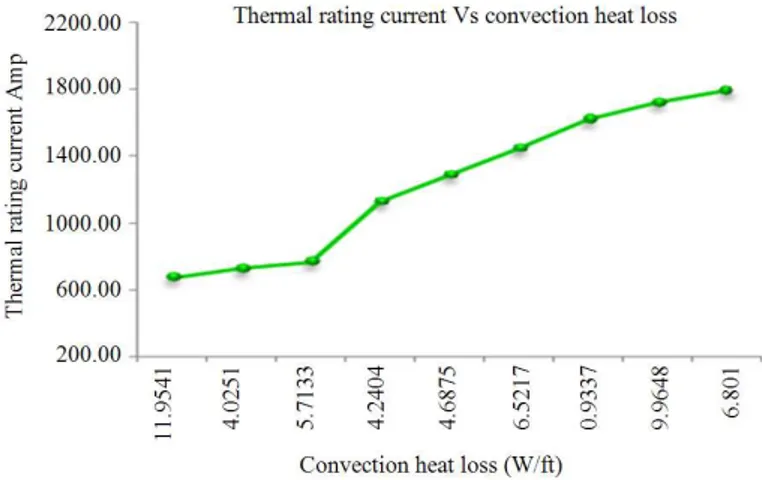
First of all, the effect of ambient temperature on conductor temperature is shown in Fig 5. Besides, Fig. 6 shows the effect of wind speed on conductor temperature. Effect of wind speed on the heat lost and heat gain of the conductor and the effect of convection heat loss on thermal rating of transmission line are illustrated in Fig. 7 and 8 accordingly.
Besides, the direction of wind mainly plays the role in current rating as shown in Fig. 9. Figure 10 shows the computation of conductor temperature for the precipitation conditions. The thermal rating with and without precipitation which varies with wind speed was illustrated in Fig. 11.
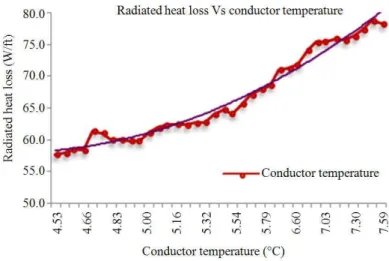
Clearly in Fig. 12 shown that the effect of ambient temperature on radiation heat loss. In addition, Fig. 13 shows the effect of radiation on conductor temperature. The effect of radiative properties of the conductor temperature is illustrated in Fig. 14 which plots the temperature of a “Batang” conductor of tower 53 for different values of emissivity and solar absorptivity for solar conditions.
4.5. Analysis
for
Environment
Effect
on
Temperature and Aging Segments of the
Conductor
The temperature of an exposed overhead-line conductor may depend on few factors. There are wind, air temperature, the intensity and direction of the radiation from the sun, the conductor characteristics, precipitation in the form of rain. By referring the trend line of the conductor temperature in Fig. 5, the conductor temperature is increased gradually. There is a loss of tensile strength when a conductor is exposed to high ambient temperature. The loss of tensile strength is
irreversible and also cumulative. In other words, tensile strength is lost when the conductor achieved high temperature. When the conductor cools down, tensile strength does not increase again and when the conductor temperature becomes high the next time, tensile strength reduction continues from the previous reduced data that was caused by earlier exposures extreme high temperatures.
It clearly shows the temperature of the conductor decreased regularly as the increases of wind speed as shown Fig. 6. Thus, the conductor temperature cools down significantly at high wind speeds. However, the heat loss due to convection is increases with the increases of the wind velocity. Hence, current rating increases also as the convection heat loss increases due to the increases of wind speed.
The calculation was carried out with constant conductor characteristics or properties and ambient temperature and from Fig. 7; it shows that changes in wind speed only have affected the heat loss due to convection. For this reason, the heat loss in steady-state condition increases and thus, rising in thermal rating of the transmission line which proved in Fig. 8.
In the meanwhile, Fig. 8 shows that current rating is greatly influenced by wind direction, resulting in the changes of conductor temperature. However, this dependence disappears as the wind velocity is reduced to zero. During the situations in which the wind direction changes rapidly, the conductor temperature can be expected to reflect these changes. The actual response of the conductor temperature will be postponed from the variations in the weather conditions due to the thermal capacitance of the conductor. In Malaysia, there are 2 majors of vibration damage on the conductor. They are Aeolian vibration and sub-conductor oscillation, which cause by wind parameter (JMM, 1958).
For the analysis of the effect on the precipitation conditions on conductor temperature, the data used are taken under precipitation procedure. Typically, conductors are attached to their support by an insulator unit which is usually made of wet-process porcelain or toughened glass with increasing use of glass-reinforced polymer insulators. Hence, under the rainfall condition, it wets the porcelain insulator and produces a thin conductor layer most of the time. Thus, it may reduce the flashover voltage of the insulators.
Fig. 3. Spatial distribution of conductor thermal aging{Lc}
Fig. 4. Standardized thermal aging series {Lcstd} with critical aging segments and hotspots
Fig. 6. Scatter chart of the conductor temperature against wind speed
Fig. 7. Effect of wind speed on the heat lost and heat gain of the conductor
Fig. 9. Illustration of effect of wind direction on current rating
Fig. 10. Illustration of effect of precipitation on conductor temperature
Fig. 12. Effect of ambient temperature on radiation heat loss
Fig. 13. Effect of radiation on conductor temperature
evaporative cooling for the former (Heckenbergerova et al., 2011). Thus, the rain has a major effect on the heat transfer by evaporation. In order to verify this statement, an analysis was carried out.
From the result in Fig. 11, it is clearly proven that the thermal rating with considering the rainfall condition has a higher rating current. When there is a further increase in wind speed, the amount of precipitation cooling increases because the moving air mass helps water evaporate faster from the conductor’s surface, thus increase the thermal rating current (Ahilan et al., 2009). The temperature of the conductor then increases also, which may cause the annealing, resulting in the loss of tensile strength. Hence, precipitation will affect the heat transfer from the conductor which increasing the heat transfer by conduction and evaporation.
Radiation plays a secondary role in establishing the conductor temperature. For this result shown in Fig. 12, ambient temperature only has been slightly influenced on the radiated heat loss (less power loss from the conductor) but the radiated heat loss increasing as the ambient temperature increases. This is because the conductors for transmission tower are exposed at a moderated temperature which in the range of 24 to 30°C. This can be clearly observed from Fig. 12 where there is a small amount change in the linear trend line of radiated heat loss.
When there is an increase in radiated heat loss, the conductor temperature computed also affected. Figure 13 indicates the graph of radiated heat loss against the conductor temperature of tower 53 in the transmission line. Temperature of the conductor is increases rapidly when there is an increase in radiation heat loss. This can be clearly observed from the trend line of the conductor temperature. Hence, the conductor temperature computed may be brought to elevated level, which may cause the loss of tensile strength of the aluminium conductor.
In addition, the radiative parameter in radiation heat
values of ∈ and decreasing values of σ. Once the conductor temperature was reduced, it decreases the probability of annealing which damage the aluminium strand in ASCR conductor, thus decrease the critical aging segments by reducing the loss of tensile strength in ASCR conductor.
5. CONCLUSION
This study presents the analysis of spatial thermal aging of the power transmission line and also the effect of weather environment on conductor temperature and thermal aging of the conductor. The methodology used for analyzed the spatial of conductor aging is based on the characteristics of transmission conductors and the weather data. In this study, the most important parameter that influences the conductor aging behaviour was the conductor temperature. The increases in conductor temperature to elevated operating level causing annealing, resulting in the loss of tensile strength in aluminium strands of the conductor along the line. Thus, conductor aging takes place. As a conclusion, the results show that the convection heat loss more important than the radiation heat loss in determining the conductor temperature. The wind velocity and direction are the two most important factors which specify the convection from the surface of the conductor. Therefore, data for the wind velocity and direction at the line location is necessary to predict the conductor temperature accurately.
The limitation of this research work is the weather environment. The main reason for specifying this as a limitation is because Malaysia is a tropical country and hence there are no seasons in Malaysia. Therefore, the results are just mainly focus on 2 conditions which are considering the precipitation and without precipitation.
environmental parameters and loads information as well. Environmental parameters will more focus on the route of the transmission line in terms of latitude and longitude, evaluation above the sea level and its height above the ground. Moreover, the loads information can be achieved from historical records collected by Supervisory Control And Data-Acquisition (SCADA) system. These extensions will provide more comprehensive information on hotspots and critical aging segments within the transmission corridor for the local transmission operators.
6. ACKNOWLEDGEMENT
The researchers gratefully acknowledge the contributions of TNB members for their valuable comments, support and technical cooperation during the process of collecting the data and also the development works. The authors would like to thank the Ministry of Higher Education, Malaysia (KPT), Ministry of Energy, Green Technology and Water (KeTTHA), Research and Innovation Centre, UTHM for financially supporting this research under the Fundamental Research Grant Scheme -KeTTHA (FRGS-KeTTHA) grant No. 0905 and MTUN-CoE Vot.C025.
7. REFERENCES
Ab-Rahman, M.S. and N.I. Shuhaimi, 2012a. The effect of temperature on the performance of uncooled semiconductor laser diode in optical network. J.
Comput. Sci., 8: 84-88. DOI:
10.3844/jcssp.2012.84.88
Ab-Rahman, M.S. and N.I. Shuhaimi, 2012b. Temperature effect on uncooled semiconductor laser diode to the network performance system. J.
Comput. Sci., 8: 551-555. DOI:
10.3844/jcssp.2012.551.555
Abu Zarim, Z.A., 2011. Ampacity simulation of various underground cable installation systems. proceedings of the 5th International Power Engineering and Optimization Conference, Jun. 6-7, IEEE Xplore Press, Shah Alam, Selangor, pp: 422-425. DOI: 10.1109/PEOCO.2011.5970402
Ahilan, T., D.K.P. Mohammed and D.S. Arumugham, 2009. A critical review of global wind power generation. Am. J. Applied Sci., 6: 204-213. DOI: 10.3844/ajassp.2009.204.213
Bhuiyan, M.M.I., P. Musilek, J. Heckenbergerova and D. Koval, 2010. Evaluating thermal aging characteristics of electric power transmission lines. Proceedings of the 23rd Canadian Conference on Electrical and Computer Engineering, May 2-5, IEEE Xplore Press, Calgary, AB., pp: 1-4. DOI: 10.1109/ccece.2010.5575137
Chen, S.L., W.Z. Black and H.W. Loard, Jr., 2003. Closure on “High temperature ampacity model for overhead conductors”. IEEE Trans. Power Delivery. DOI: 10.1109/TPWRD.2003.809739
Hayakawa, N., T. Kito, H. Kojima, M. Hanai and H. Okubo, 2011. Analysis of current limiting and recovery characteristics of Superconducting Fault Current Limiting Transformer (SFCLT) with YBCO coated conductors. IEEE Trans. Applied Superconduct., 21: 1422-1425. DOI: 10.1109/TASC.2011.2105234
Heckenbergerova, J., P. Musilek and K. Filimonenkov, 2011. Assessment of seasonal static thermal ratings of overhead transmission conductors. Proceedings of the IEEE Power and Energy Society General Meeting, Jul. 24-29, IEEE Xplore Press, San Diego, CA., pp: 1-8. DOI: 10.1109/PES.2011.6039393 Heckenbergerova, J., P. Musilek, M.M.I. Bhuiyan and D.
Koval, 2010a. Analysis of spatial and seasonal distribution of power transmission line thermal aging. Proceedings of the IEEE Conference on Innovative Technologies for an Efficient and Reliable Electricity Supply, Sept. 27-29, IEEE Xplore Press, Waltham, MA., pp: 22-27. DOI: 10.1109/citres.2010.5619844
Heckenbergerova, J., P. Musilek, M.M.I. Bhuiyan, D. Koval and E. Pelikan, 2010b. Identification of critical aging segments and hotspots of power transmission lines. Proceedings of the 9th International Conference on Environment and Electrical Engineering, May 16-19, IEEE Xplore Press, Prague, Czech Republic, pp: 175-178. DOI: 10.1109/eeeic.2010.5489965
IEEE, 2007. IEEE Standard for calculating the current-temperature of bare overhead conductors. IEEE. Industries, T.C., 1957. Overhead aluminium conductors.
TCI Website Via GOV Access.
pp: 1-5. DOI: 10.1109/UPEC.2008.4651621
Michiorri, A., P.C. Taylor and S.C.E. Jupe, 2010. Overhead line real-time rating estimation algorithm: Description and validation. J. Power Energy, 224: 293-304. DOI: 10.1243/09576509jpe859
Pytlak, P., P. Musilek and E. Lozowski, 2009. Precipitation-based conductor cooling model for dynamic thermal rating systems. Proceedings of the IEEE Electrical Power and Energy Conference, Oct. 22-23, IEEE Xplore Press, Montreal, QC., pp: 1-7. DOI: 10.1109/epec.2009.5420710
Yang, Y., R. Harley, D. Divan and T. Habetler, 2009. Thermal modeling and real time overload capacity prediction of overhead power lines. Proceedings of the IEEE International Symposium on Diagnostics for Electric Machines, Power Electronics and Drives, Aug. 31-Sept. 3, IEEE Xplore Press,
Cargese, pp: 1-7. DOI: