Pak. J. Anal. Environ. Chem. Vol. 15, No. 1 (2014) 74 – 79
Comparative Studies of Minerals between Collected and
Certified Samples of Some Important Barley Cultivars
Grown in Pakistan
Ghulam Qadir Shar*
1, Tasneem Gul Kazi
3, Wahid Bux Jatoi
1, Pirbho Mal J.
Makheja
4, Liaquat Ali Shar
1, Khalida Parveen Mahar
1, Abdul Hussain Shar
2and Fateh M. Soomro
2 1Department of Chemistry, Shah Abdul Latif University, Khairpur, Sindh, Pakistan.
2
Department of Microbiology, Shah Abdul Latif University, Khairpur, Sindh, Pakistan.
3
National Centre of Excellence in Analytical Chemistry, University of Sindh, Jamshoro, 76080, Pakistan.
4
Ghulam Mohammad Mahar Medical College, Sukkur, Sindh, Pakistan
Received 13 November 2013, Revised 18 May 2014, Accepted 30 June 2014
--- Abstract
Essential and trace elements; Na, K, Ca, Mg, Fe, Zn, Mn, Cu, Co, Cr, Ni, Pb, Cd, Ba, and Al were determined in eight barley cultivar samples collected from wheat research station, Sindh Agriculture University, Tando Jam. The dried samples were digested in HNO3 followed by H2O2,
diluted with deionized water, and element at concentrations were determined with a recording atomic absorption spectrophotometer. The results were in the mg/kg range 1127.88-2312.45 (Na), 6663.3-7482.91 (K), 8.91-122.45 (Ca), 2079.08-2522.64 (Mg), 841.01-2141.9 (Fe), 30.24-53.05 (Zn), 21.93-38.69 (Mn), 7.02-10.46 (Cu), 1.66-4.41 (Co), 0.84-1.22 (Cr), 0.7-1.23 (Ni), 0.55-1.21 (Pb), 0.23-0.49 (Cd), 3.96-9.25 (Ba), and 10.42-25.35 (Al). These results of collected samples were compared with certified samples of Federal Seed Certification and Registration Department of Pakistan.
Keywords: Barley; Essential and Trace minerals; Atomic Absorption Spectrophotometer.
---
Introduction
The level of the mineral content in various food commodities is one of the common issue for both botanist and chemist jointly to enhance mineral concentration for fulfill the requirement of the human being, [1]. Level of macro elements; Ca, Mg, K, and P in dry barley grains investigated by using neutron activation analysis [2]. Many factors; climate, soil, genotype and fertilizing are involved in the composition of barley grain [3]. Potassium can play key role to barley plants to grow better under saline conditions [4]. Potassium is considered a major osmotically active solute of plant cell [5]. Potassium application resulted in better crop performance was recorded [6]. Balance minerals in barley give good fertilization and yield
as compared to high doses [7]. The concentrations of lead and cadmium in wheat and barley were found higher, which are grown on road side [8]. Elemental concentration for determination whether differences were significant at the 5% level, a standard t-test was applied to compare means calculated from the collected and certified samples. The formula used for t-test was for paired data [9]. Structure and mineral composition of cereal in Phytate, which contains the maximum concentration of P, K, and Mg, and is known as major mineral store in barley grains [10- 12]. Variation in mineral content of plant species grown on the same soil was reported [13].
The environmental effects of heavy metals in different vegetables and dairy farms were carried out by Iqleem and Co-workers [14]. Comparative study of 13 minerals of different wheat varieties was carried out to check the variation in uptake of the metals in the same agricultural plot [15]. Some of the varieties contain higher concentration of sodium while other varieties possess higher concentration of potassium, calcium, iron and copper [16]. A study of the mineral element composition in cocoa beverages was carried out in Nigeria [17]. Animals and human being require mineral elements in different concentrations for their growth and health maintenance [18]. The quantitative relationships between potassium fertilization and plant responses on two soil types were carried [19]. The use of mineral fertilizers at normal level to mineral rich soils does not cause any risk for contamination of cereals [20].The content of each barley plant and soil of certain nutrient minerals were investigated [21]. Investigation of mineral composition was carried out from the functional foods [22]. Variable concentration of heavy metals in barley cultivars was calculated [23].
The main purpose of this study was to examine the exact concentration difference of essential and heavy metals between collected and certified samples of barley cultivars, in order to improve their nutritional role as a source of bioavailable heavy metals. This study would be highly significant for the nutritive purpose for the human being as well as for animals.
Materials and Methods
The experiment was conducted at Wheat Research Station (WRS), Sindh Agriculture University Tandojam, Sindh, Pakistan during normal barley growing season (November 1999 to April, 2000) and samples were collected for comparison of nutritive value between certified and these collected samples from said station. Eight cultivars were grown at wheat research station Tandojam. The entire Table 3 cultivars were harvested at maturity stage and randomly collected to make representative samples of each cultivar.
Methods
All eight barley cultivars samples were dried at 110 0C in oven till constant weight.
Replicate 2g of each barley cultivar were weighed in to 100mL conical flasks and treated with 5mL of nitric acid. 5mL of nitric acidwere also added to empty conical flask serving as a blank [24]. The flasks were covered with watch glasses, and their contents were heated to reflux gently on an electric plate. After refluxing for one hour the contents of flasks were treated with 5mL more of nitric acid, 2mL of 35% hydrogen peroxide was added, and the heating at gentle reflux was continued for another hour. The watch glasses were removed from the flasks, and the heating was continued until the volumes of their contents were reduced to 2-3mL. The contents of flasks were cooled, diluted with high purity water, and filtered through Whatman # 42 paper in to 25mL volumetric flasks. The contents of the flasks were brought to volume with high purity water and examined by atomic absorption spectrometry for their sodium, potassium, calcium, magnesium, iron, zinc, manganese, copper, cobalt, chromium, nickel, lead, cadmium, barium, and aluminum levels. The results of these measurements are presented in Table 4.
Instrumentation
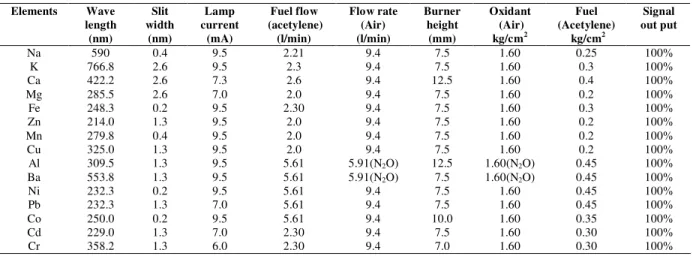
A Hitachi Model 180-50 atomic absorption spectrophotometer equipped with standard burner and air-acetylene flame was used for the determination of elements such as, sodium, potassium, calcium, magnesium, iron, zinc, manganese, copper, aluminum, barium, nickel, lead, cobalt, cadmium and chromium. Nitrous oxide was used for the determination of aluminum and barium elements. The hollow-cathode lamps (made by Mtiorika company) of all above elements were operated at lamps current 9.5, 9.5, 7.3, 7.0, 9.5, 9.5, 7.0, 7.0, 9.5, 9.5, 9.5, 7.0, 9.5, 7.0, and 6.0mA, respectively. The flow-rate for fuel 2.30 1min-1 and air 9.40 1min-1 was used respectively to
Table 1. Instrumental conditions for the AAS measurement of Na, K, Ca, Mg, Fe, Zn, Mn, Cu, Al, Ba, Ni, Pb, Co, Cd and Cr.
Elements Wave
length (nm)
Slit width
(nm)
Lamp current
(mA)
Fuel flow (acetylene)
(l/min)
Flow rate (Air) (l/min)
Burner height (mm)
Oxidant (Air) kg/cm2
Fuel (Acetylene)
kg/cm2
Signal out put
Na 590 0.4 9.5 2.21 9.4 7.5 1.60 0.25 100%
K 766.8 2.6 9.5 2.3 9.4 7.5 1.60 0.3 100%
Ca 422.2 2.6 7.3 2.6 9.4 12.5 1.60 0.4 100%
Mg 285.5 2.6 7.0 2.0 9.4 7.5 1.60 0.2 100%
Fe 248.3 0.2 9.5 2.30 9.4 7.5 1.60 0.3 100%
Zn 214.0 1.3 9.5 2.0 9.4 7.5 1.60 0.2 100%
Mn 279.8 0.4 9.5 2.0 9.4 7.5 1.60 0.2 100%
Cu 325.0 1.3 9.5 2.0 9.4 7.5 1.60 0.2 100%
Al 309.5 1.3 9.5 5.61 5.91(N2O) 12.5 1.60(N2O) 0.45 100%
Ba 553.8 1.3 9.5 5.61 5.91(N2O) 7.5 1.60(N2O) 0.45 100%
Ni 232.3 0.2 9.5 5.61 9.4 7.5 1.60 0.45 100%
Pb 232.3 1.3 7.0 5.61 9.4 7.5 1.60 0.45 100%
Co 250.0 0.2 9.5 5.61 9.4 10.0 1.60 0.35 100%
Cd 229.0 1.3 7.0 2.30 9.4 7.5 1.60 0.30 100%
Cr 358.2 1.3 6.0 2.30 9.4 7.0 1.60 0.30 100%
Reagents and Calibration
The supra pure nitric acid (65% w/v) and hydrogen peroxide (35% w/v) reagents (Merck), high-purity water (electrical resistivity10m/cm) was produced with a Milli-Q system Millipore, MA, USA).
Calibration was obtained with external standards. The standard solutions were prepared by diluting a 1000mg/L multi element solution (ICP Multi element standard IV, Merck, Darmstadt, FRG) with the same acid mixture used for sample dissolution. Glassware were cleaned by soaking with the contact over night in a 10% (w/v) nitric acid solution and then rinsed with deionized water.
Solutions were aspirated into atomic absorption spectrophotometer and absorbance / divisions' measurements were made for each element using optimum instrumental conditions for flame atomization mode.
Reference standards were also run in parallel for inter calibration of our own standards. Elemental concentrations were computed on an IBM compatible PC using an excel computer program.
The statistical calculations for standards are given in (Table 2).
Table 2. Statistical data for standards of elements.
Statistical calculation y = m x + c
Elements Concentration
range ppm (x)
Absorbance/ Division (y)
m c r2
Na 0 - 0.25 0 - 0.084* 0.3344 0.0001 0.9996
K 0 - 1 0 - 0.207* 0.2069 0.0006 0.9999
Ca 0 - 5 0 - 0.256* 0.0508 0.0024 0.9993
Mg 0 - 1 0 - 0.885* 0.8856 0.0017 0.9999
Fe 0-1 0 - 0.096* 0.0976 -0.0016 0.9989
Zn 0 - 0.5 0 - 0.138* 0.2761 -0.0004 0.9999
Mn 0 – 1 0 – 0.196* 0.1962 0.0005 0.999
Cu 0 – 1 0 –0.086* 0.0862 0.0004 0.9989
Al 0 – 6 0 – 42 Div. 6.8793 -0.0862 0.9974
Ba 0 – 2 0 – 40 Div. 20.1 0.125 0.9992
Ni 0 – 0.25 0 – 14 Div. 55.31 0.20 0.9984
Pb 0 – 0.25 0 – 15 Div. 60.80 -0.4 0.9968
Co 0 – 0.50 0 – 29 Div. 58.4 -0.35 0.9994
Cd 0 – 0.25 0 – 28 Div. 110.39 0.052 0.9977
Cr 0 – 0.125 0 – 15 Div. 121.59 -0.3977 0.9969
Absorbance*
Results and Discussion
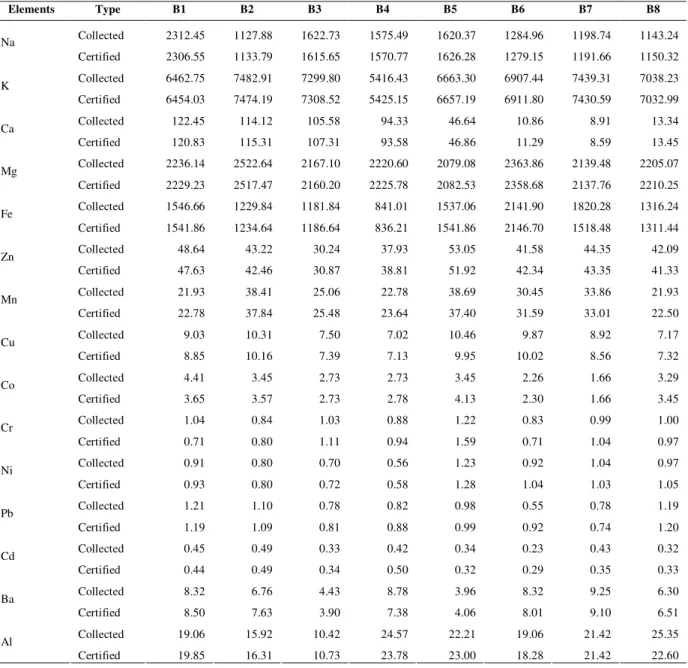
Investigated concentration of 15 elements from the representative samples collected from field and certified samples obtained from the Federal Seed Certification & Registration Department of Pakistan to check the variable accumulation of elements in different cultivars of barley. Different symbols are used for different cultivars as indicated in the (Table 3). The elemental concentrations were determined on dry weight basis. The data in (Table 4) indicate the concentration of essential trace and toxic elements in different eight barley cultivars.
Table 3. Barley cultivars collected and certified samples.
Codes cultivars/Pedigree Codes cultivars/Pedigree
B1 Arar B6 Giza 120/5
B2 Rihane-03 B7 Albert
B3 Beca,s, B8 Arizona
B4 Beecher
B5 Orge
Table 4. Concentration of eight Barley cultivars and certified samples.
Elements Type B1 B2 B3 B4 B5 B6 B7 B8
Collected 2312.45 1127.88 1622.73 1575.49 1620.37 1284.96 1198.74 1143.24 Na
Certified 2306.55 1133.79 1615.65 1570.77 1626.28 1279.15 1191.66 1150.32
Collected 6462.75 7482.91 7299.80 5416.43 6663.30 6907.44 7439.31 7038.23 K
Certified 6454.03 7474.19 7308.52 5425.15 6657.19 6911.80 7430.59 7032.99
Collected 122.45 114.12 105.58 94.33 46.64 10.86 8.91 13.34 Ca
Certified 120.83 115.31 107.31 93.58 46.86 11.29 8.59 13.45 Collected 2236.14 2522.64 2167.10 2220.60 2079.08 2363.86 2139.48 2205.07 Mg
Certified 2229.23 2517.47 2160.20 2225.78 2082.53 2358.68 2137.76 2210.25 Collected 1546.66 1229.84 1181.84 841.01 1537.06 2141.90 1820.28 1316.24 Fe
Certified 1541.86 1234.64 1186.64 836.21 1541.86 2146.70 1518.48 1311.44 Collected 48.64 43.22 30.24 37.93 53.05 41.58 44.35 42.09 Zn
Certified 47.63 42.46 30.87 38.81 51.92 42.34 43.35 41.33
Collected 21.93 38.41 25.06 22.78 38.69 30.45 33.86 21.93 Mn
Certified 22.78 37.84 25.48 23.64 37.40 31.59 33.01 22.50
Collected 9.03 10.31 7.50 7.02 10.46 9.87 8.92 7.17 Cu
Certified 8.85 10.16 7.39 7.13 9.95 10.02 8.56 7.32
Collected 4.41 3.45 2.73 2.73 3.45 2.26 1.66 3.29 Co
Certified 3.65 3.57 2.73 2.78 4.13 2.30 1.66 3.45
Collected 1.04 0.84 1.03 0.88 1.22 0.83 0.99 1.00 Cr
Certified 0.71 0.80 1.11 0.94 1.59 0.71 1.04 0.97
Collected 0.91 0.80 0.70 0.56 1.23 0.92 1.04 0.97 Ni
Certified 0.93 0.80 0.72 0.58 1.28 1.04 1.03 1.05
Collected 1.21 1.10 0.78 0.82 0.98 0.55 0.78 1.19 Pb
Certified 1.19 1.09 0.81 0.88 0.99 0.92 0.74 1.20
Collected 0.45 0.49 0.33 0.42 0.34 0.23 0.43 0.32 Cd
Certified 0.44 0.49 0.34 0.50 0.32 0.29 0.35 0.33
Collected 8.32 6.76 4.43 8.78 3.96 8.32 9.25 6.30 Ba
Certified 8.50 7.63 3.90 7.38 4.06 8.01 9.10 6.51
Collected 19.06 15.92 10.42 24.57 22.21 19.06 21.42 25.35 Al
The higher value of Na and Ca was detected in B1 cultivar in collected samples of field as compared to certified value where as lower value of same elements detected in B2 of collected and B5 of certified samples. Maximum concentration of K, Mg, and Mn were found in B2 in collected with slightly margin as compared to certified and minimum concentration of K in B5 certified, Mg in B5 and Mn in B8 collected samples. High level of Fe in B6 certified and Zn in B5 of collected where as the low level of Fe in B4 certified and Zn in B3 collected cultivars. The level of Fe found in all cultivars, were higher than the recommended value [25]. In case of Ca there was negligible difference in B5, B7 and B8 of collected and certified Pedigree and same trend was determined in B3 of Zn and Mn. The comparison of Cu concentration in barley cultivars showed a higher level in B2 and B5 where as lower level was observed in B3, B4 and B8 of collected with a close value respectively. It was found that most of the cultivars, i.e. B3, B4, and B8 have no significant difference in uptake of Cu in collected to each other as well as in certified to their respective hybrids.
Higher content of Co was found in B1 of collected and B5 of certified and lower content was present in B7 without significant difference. The absorption rate of Cr was determined maximum in B5 and lower absorption in B6 of certified whereas the uptake of Cr were calculated more or less same. Higher up take of Cr and Ni was obtained in B5 of certified samples and lower up take of Cr detected in B2 certified and B3 collected varieties. Pb and Cd are extremely toxic in nature and their higher value was found in B1 and B2 in collected samples where as their lower value observed in B6 of collected Pedigree, however, there was no significant difference in B1 of collected and certified barleys.
Higher level of Ba was noted in B7 and lower level detected in B5 of collected, whereas in case of Al, maximum uptake observed in B8 of collected and lower uptake observed in B3. The values of Ba and Al in all other cultivars are lying between given concentration.
Cr, Ni, Pb and Cd were found to be present in a very small amount in all barley genotype at
different extent in both collected and certified samples and there was no significant difference of accumulation of minerals in both types of samples, i.e., collected and certified.
Conclusion
The data of table 4 indicates that the concentration of macro minerals (Na, K, Ca, Mg) was found maximum in B1, B2, B1 and B2 respectively in collected cultivars as compared to certified samples where as lower concentration found in B2, B5, B7 and B5, respectively. Higher level of trace and essential elements (Fe, Zn, and Mn) were detected in B6 (certified), B5 (collected), and B2 (collected) respectively and lower level of same elements detected in B4 (certified), B3 (certified), and B1 (collected). High uptake of Cu and Cd was detected in B2 (collected) where as in case of Co and Pb the maximum value found in B1. Similarly, B5 hybrid obtained top level of Cu, Cr, and Ni where as the absorption rate of Ba relates to the absorption rate of Cu. Higher concentration of Al was observed in B8 and overall trend of Al detected higher as compared to trace and toxic elements.
Acknowledgement
Ghulam Qadir Shar is thankful to Syed Iqrar Hussain Shah, and Muhammed Aslam Nushad (Seed Certification Officers), Seed Certification & Registration Department for their co-operation in sampling of the barley cultivars from Wheat Research Station Tando Jam. Thanks are also due to my parent institute Shah Abdul Latif University, Khairpur, Sindh, Pakistan for financial support and grant of study leave.
References
1. A. G. Michael, J. Am., Nutr., 21 (2002) 178S. 2. S. Ann, N. Hilary and N. A. L, John, Plant
Physiol., 86 (1988) 93.
3. B. Ceh, I. Santavee and A. Tajnsek, Rostlinna Vyroba, 48 (2002) 463.
4. Nadia and M. Badran, Res. J. Agr. Biol. Sci., 2 (2006) 12.
6. S. Endris and M.J., Int. J. Environ. Sci. Tech., 4 (2007) 323.
7. J. Černý, J. Balík, M. Kulhánek, K. Čásová
and V. Nedvěd, Plant Soil Environ., 56 (2010) 28.
8. J. Wieczorek, Z. Wieczorek and T. Bieniaszewski, Polish J. Environ. Stud., 14 (2005) 535.
9. R. Steel and J. H. Torrie, McGraw-Hill, New York (1960) 67.
10. J. V. Jacobsen, R. B. Knox and N. A. Pyliotis, Planta, 101 (1971) 189.
11. D. J. Liu and Y. Pomeranz, Cereal Chem., 52 (1975) 620.
12. Y. Pomeranz, Cereal Chem., 50 (1973) 504. 13. M. R. Reddy, J. Agr. Food, Chem., 34 (1986)
750.
14. H. Iqleem, R. Raza and G. Q. Shar, Pak. J. Anal. Chem., 4 (2003) 35.
15. H. Iqleem, R. Raza and G. Q. Shar, Pak. J. Anal. Chem., 4 (2003) 43.
16. G. Q Shar, T. G. Kazi and S. R. Sahito, J. Chem. Soc. Pak., 24 (2002) 258.
17. G. Q. Shar, T. G. Kazi, S. R. Sahito, A. Arain, L. A. Shar, J. Chem. Soc. Pak., 27 (2005) 38.
18. T. A. Shittu and B. A. Badmus, J. Food Compos. Anal., 22 (2009) 212.
19. Á. Balázsy and K. Sárdi, Comm. Soil Sci. and
Plant Anal., 44 (2013) 696.
20. M. Hejcman, M. Berková and E. Kunzová,
Plant Soil Environ., 59 (2013) 329.
21. M. W. Seheib and M. Al-Aidi, Int. J. Agr. Sci. Res., 3 (2013) 103.
22. M. K. E. S. Youssef, F. A. E. K. El-Fishawy, E. A. E. N. Ramadan and A. M. Abd El-Rahman, Scientific J. Crop Sci., 2 (2013) 8. 23. G. Q. Shar, T. G. Kazi, W. B. Jatoi, P. M.
Makhija, S. B. Sahito, A. H. Shar and F. M. Soomro, Pak. J. Anal. Environ. Chem., 14 (2013) 47.
24. G. Q. Shar, T. G. Kazi, M. A. Jakhrani, S. R. Sahito and A. N. Memon, J. Chem. Soc. Pak., 25 (2003) 153.
25. Food and Nutrition Board, National Research Council (1989). Recommended Dietary Allowances, 10th ed., National Academy