PATIENT SAFETY CLIMATE AT A PRIVATE HOSPITAL
1Maria Helena Barbosa2, Daniela Rosa Floriano3, Karoline Faria de Oliveira4, Kleiton Gonçalves do Nascimento5, Lúcia Aparecida Ferreira6
1 Research funded by the Fundação de Amparo à Pesquisa do Estado de Minas Gerais (FAPEMIG).
2 Ph.D. in Adult Health Nursing. Professor, Undergraduate Nursing Program and Programa de Pós-Graduação em Atenção à Saúde, Universidade Federal do Triângulo Mineiro (UFTM). Uberaba, Minas Gerais, Brazil. E-mail: [email protected]
3 Undergraduate Student in Nursing, UFTM. Uberaba, Minas Gerais, Brazil. E-mail: [email protected]
4 Ph.D. student, Programa de Pós-Graduação em Atenção à Saúde, UFTM. Uberaba, Minas Gerais, Brazil. E-mail: karol_fmtm2005@ yahoo.com.br
5 Master’s student, Programa de Pós-Graduação em Atenção à Saúde, UFTM. Uberaba, Minas Gerais, Brazil. E-mail: kleiton_uniube@ yahoo.com.br
6 Ph.D. in Nursing. Professor, Undergraduate Nursing Program UFTM. Uberaba, Minas Gerais, Brazil. E-mail: lap2ferreira@yahoo. com.br
ABSTRACT: Evaluate the patient safety climate from the perspective of the health team members at a medium-sized private hospital in a city in the state of Minas Gerais, Brazil and check for relations between the sociodemographic variables and the safety climate scores. This is a descriptive, exploratory and correlational study, conducted with 123 health professionals, with approval from the Research Ethics Committee. Data were collected using the Safety Attitudes Questionnaire. For analysis, we used Student’s t-test, analysis of variance and Spearman’s correlation (α = 0.05). The general score on the instrument was 67.50. The best domain score was found for job satisfaction (82.79) and the lowest for perceived management (58.90) and working conditions (59.58). No differences were found between the sexes, education level, presence of other employment or professional activities. The safety climate scores observed were lower than the scores recommended in the literature.
DESCRIPTORS: Patient safety. Safety management. Health personnel.
CLIMA DE SEGURANÇA DO PACIENTE EM UM HOSPITAL PRIVADO
RESUMO: Avaliar o clima de segurança do paciente na perspectiva dos proissionais da equipe de saúde em hospital privado de médio porte de um município de Minas Gerais e veriicar se há relação entre as variáveis sociodemográicas e a pontuação de clima de segurança. Estudo descritivo, exploratório, correlacional, realizado com 123 proissionais da saúde, aprovado pelo Comitê de Ética em Pesquisa. Os dados foram coletados utilizando-se o Questionário de Atitudes de Segurança. Para análises, foram utilizados os testes t de Student, análise de variância e correlação de Sperman (α=0,05). A pontuação geral do instrumento foi 67,50. O domínio com melhor pontuação foi o de satisfação no trabalho (82,79) e os domínios com menores pontos foram percepção da gerência (58,90) e condições de trabalho (59,58). Não houve diferenças entre os sexos, nível de escolaridade, presença de outro vínculo empregatício ou atuação proissional. Pontuações de clima de segurança estiveram abaixo do recomendado pela literatura.
DESCRITORES: Segurança do paciente. Gerenciamento de segurança. Pessoal de saúde.
CLIMA DE SEGURIDAD DEL PACIENTE EN UN HOSPITAL PRIVADO
RESUMEN Evaluar el ambiente de seguridad del paciente en la perspectiva de los profesionales del equipo de salud en un hospital privado en una ciudad del Estado de Minas Gerais. Estudio descriptivo, exploratorio y correlacional, realizado con 123 profesionales de salud, aprobado por el Comité de Ética en Investigación. Los datos se recolectaron utilizando el Safety Attitudes Questionnaire. En los análisis se utilizaron los tests t de Student, análisis de la varianza y correlación de Sperman (α=0,05). La puntuación general del instrumento fue de 67,50. El dominio con mejor puntuación fue el de satisfacción en el trabajo (82,79) y los dominios con menores puntajes fueron el de percepción de la gerencia (58,90) y condiciones de trabajo (59,58). No hubo diferencias entre los sexos, nivel de estudios, presencia de otro vínculo laboral o actuación profesional. Se han observado puntuaciones de clima de seguridad con valores por debajo de lo recomendado por la literatura.
INTRODUCTION
Patient safety has become a priority issue in health, with ongoing debates around the globe. In-stitutional organizations increasingly acknowledge
the importance of offering total quality services,
reducing unnecessary risk and damages with a view to achieving patient satisfaction and safety.1
Health institutions are more and more aware of the importance of safety climate assessments,
con-sidering that evaluating the quality of patient care
is fundamental.2
The safety climate is deined as the percep -tions shared between the management and workers with regard to the safety policies, procedures and
practices. In short, the safety climate relects the
workers’ perception on the true value of safety in an organization, as a factor that contributes to the
reduction of accidental injuries.3
Measuring an institution’s safety climate
per-mits the identiication of strong and weak points
in the employees’ behavior, and also of the most affected areas, with a view to organizing and pro-gramming interventions.4
Thus, knowing the organizational and
profes-sional factors that can inluence the patient safety
in health institutions is fundamental to support the implementation of interventions that can contribute to the safety climate in these institutions, besides
guaranteeing the quality of care.
The objective in this research was to assess
the patient safety climate from the perspective of the health team professionals at a medium-sized private hospital in a city in the State of Minas Gerais (Brazil) and to verify whether the sociodemographic variables are related with the safety climate score.
METHOD
A descriptive and exploratory correlation
study was undertaken with a quantitative approach
of the data.
The study was developed in the city of Ubera-ba-MG, whose infrastructure includes four hospitals
classiied as private. Only one of these accepted to
participate in the study.
All nursing professionals (baccalaureate nurses, nursing technicians and auxiliary nurses), physicians (on duty and responsible for the medical and surgical teams), social workers, nutritionists, psychologists, physiotherapists, occupational
thera-pists, pharmacists and pharmacy and image service technicians working in patient care at the hospital wards where the study was undertaken were invited to take part in the data collection.
Having worked at the hospital for at least one month and working at least 20 hours per week were considered as inclusion criteria. Professionals on medical leave, absent from work due to other
reasons or who did not answer the questionnaire
after three approach attempts were excluded from the study.
Among the 233 professionals who complied
with the inclusion criteria, 25 (10.73%) did not ac
-cept to answer the questionnaire and 85 (36.48%) did not return the questionnaire after three approaches. Consequently, 123 (52.79%) professionals answered the questionnaire. The data were collected in 2014
during three months.
The professionals were contacted at work and received clearance from their immediate head to
participate. After clarifying the research objectives,
ethical consent forms were collected. Next, two
questionnaires were provided for the participant to
complete, using the Safety Attitudes Questionnaire (SAQ), validated for Brazilian Portuguese,2 as well as a questionnaire with sociodemographic and profes -sional variables (sex, profes-sional category, length of experience in the specialty, work unit, main and professional activity, length of experience and work at the institution, education level and presence of other employment contract).
The SAQ was used with the authorization of the author responsible for the validation of the tool.
The questionnaire contains 41 items, 36 of
which correspond to six domains: 1) Teamwork
Climate (quality of relationship and cooperation
among team members); 2) Safety Climate (profes-sionals’ perception of the organizational commit-ment to patient safety); 3) Job Satisfaction (posi-tive view of the workplace); 4) Stress Perception (recognition of the extent to which the stressors
can inluence the work practice); 5) Perceptions of
Management (approval of management actions at the service where the professional works or at the
hospital) and; 6) Working Conditions (quality of
work environment).5 At the SAQ, ive items exist
that do not belong to any domain, which are inter-preted separately.
Each item is answered on a ive-point Likert
ap-plicable’. The inal score ranges between zero and
100, the former indicating the worst perceived safety climate and 100 the best. According to the authors of the original scale, positive scores are considered
as ≤75.6 As a leveling criterion to interpret the data
in this study, the score suggested by the creators of the tool was used, considering that these data have not been tested in Brazil.
The data were included in an electronic worksheet in Excel® for Windows®, validated through double data entry and exported to the Statistical Package for the Social Sciences (SPSS),
version 19.0 for Windows®, for processing and
analysis.
The qualitative variables were analyzed using
descriptive statistics with absolute and percentage
frequencies. For the quantitative variables, descrip -tive central trend (mean) and dispersion (standard deviation, minimum and maximum) measures were used.
For scoring purposes per domain, the item scores in each were added up and the result was divided by the number of items corresponding to each domain, based on the formula (m-1)x25, in which m is the average number of items in the domain, ranging in the interval [0-100].
Spearman’s correlation test was applied to the ordinal variables (time since graduation, length of experience in the specialty and length of experience at the institution) and the safety climate scores. The results of these correlations were
pre-sented descriptively instead of in tables. To subject the inluence of the categorical variables on the
safety scores to bivariate analysis, Student’s t-test (dichotomous categorical) and variance (ANOVA) analysis for three or more categories were applied.
Associations were considered statistically signii
-cant when p≤0.05.
This study is part of the research project
entitled The patient safety culture at hospitals in a region of Minas Gerais, with funding from the
Fundação de Amparo à Pesquisa do Estado de Minas Gerais (FAPEMIG). Approval was obtained from the Etichal Research Committee involving Human Beings at Universidade Federal do Triângulo Mineiro
(CEP-UFTM), opinion N. 2.306 on April 25th 2012,
in compliance with Ministry of Health Resolution
196/96 on research involving human beings.7
RESULTS
In the population of 233 subjects, data were collected from 123 (52.79%) professionals, respecting
the criteria described in the method. Among these
professionals, 14 (11.38%) had already answered the same questionnaire at another institution. These subjects were reassessed, as some of the tool’s char -acteristics are peculiar to the reality of each hospital. As regards the number of institutional bonds,
66 (53.66%) had another employment bond. Most professionals (97; 78.86%) were female. In addi
-tion, the majority worked with adult patients (61; 49.59%). The professionals from the nutrition, occu -pational therapy, social service, speech therapy and
radiology services (55; 44.71%) worked with adult
and pediatric patients. Only seven professionals
(5.69%) worked with children.
The professional category that most
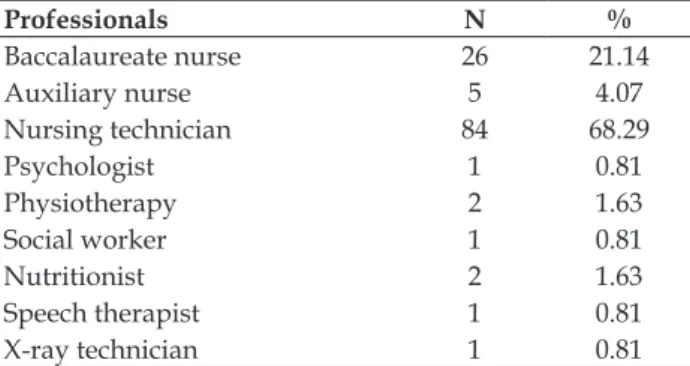
partici-pated were the nursing technicians with 84 (68.29%) participants, followed by the nurses with 26 (21.14%) and the auxiliary nurses with ive (4.07%) (Table 1).
Table 1 – Distribution of professional category according to study participants and percentage of adhesion to the study. Uberaba-MG, 2014. (N=123)
Professionals N %
Baccalaureate nurse 26 21.14
Auxiliary nurse 5 4.07
Nursing technician 84 68.29
Psychologist 1 0.81
Physiotherapy 2 1.63
Social worker 1 0.81
Nutritionist 2 1.63
Speech therapist 1 0.81
X-ray technician 1 0.81
Concerning the activity sector, most profes-sionals worked in the medical clinical area (44;
35.77%), followed by the adult intensive care unit (23; 18.70%) and the emergency care service (22; 17.89%). Only one professional participated from the
hospital infection control, radiology, ombudsman
and human resources sectors, totaling 0.8% each.
The mean length of experience in the specialty area was 3.64 (standard deviation SD±1.6) years. On
average, the professionals had 3.67 (SD±1.66) years
of experience at the institution and an average time
Table 2 – Distribution of length of experience in the specialty, time since graduation and length of experience of research participants. Uberaba-MG, Brazil, 2014. (n=123)
Length In specialty
N(%)
Graduation N(%)
Experience N(%)
Less than 6 months 12 (9.76) 0 13 (10.57)
6 to 11 months 19 (15.45) 3 (2.44) 19 (15.45)
1 to 2 years 28 (22.76) 16 (13.01) 31 (25.20)
3 to 4 years 28 (22.76) 35 (28.46) 16 (13.01)
5 to 10 years 21 (17.07) 42 (34.15) 27 (21.95)
11 to 20 years 8 (6.50) 19 (15.45) 11 (8.94)
21 years or more 7 (5.69) 8 (6.50) 6(4.88)
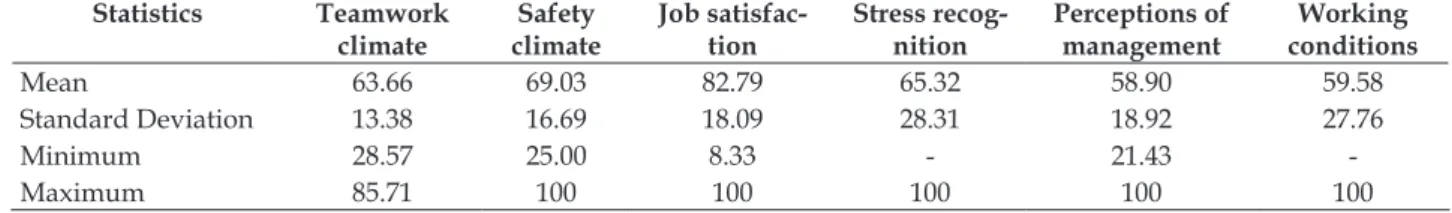
The mean general score was 67.50 (SD±12.82), ranging between 37.20 and 94.38.
In the analysis of the domain scores, as dem-onstrated in table 3, the domain with the highest
score was number 3, related to job satisfaction, with an average score of 82.79 (SD±18.09) points, evidencing that most professionals were satisied
and had a trusting and positive view on the work
environment.
The lowest scores were found for domain 5, related to the perceptions of the service and hospital management, with an average score of
58.90 (SD±18.92), and domain 6, which assessed the job conditions, with an average score of 59.58 (SD±27.76) (Table 3).
Table 3 – Distribution of univariate analysis of domain scores. Uberaba-MG, Brazil, 2014
Statistics Teamwork
climate
Safety climate
Job satisfac-tion
Stress recog-nition
Perceptions of management
Working conditions
Mean 63.66 69.03 82.79 65.32 58.90 59.58
Standard Deviation 13.38 16.69 18.09 28.31 18.92 27.76
Minimum 28.57 25.00 8.33 - 21.43 -
Maximum 85.71 100 100 100 100 100
In table 4, the response frequency for items
14, 33, 34, 35 and 36 is displayed, which did not correspond to any of the domains according to the
standards of the SAQ. As observed, most answers were concentrated in ‘I strongly agree’ (Table 4).
Table 4 – Response frequency of participants related to items that do no correspond to any domain. Uberaba-MG, Brazil, 2014
Items that do not belong to any domain CD*
N (%)
PD† N (%)
Neutral N (%)
PA‡
N (%)
CA§
N (%)
NA||
N (%)
14. My suggestions about safety would be acted upon if I expressed them to management.
13
(10.6) 15 (12.2) 25 (20.3) 30 (24.4) 33 (26.8)
7 (5.7)
33. I experience good collaboration with nurses in this clinical area.
4
(3.3) 13 (10.6) 11
(8.9) 20 (16.3) 72 (58.5) (2.4)3
34. I experience good collaboration with staff physicians in this clinical area.
7
(5.7) 14 (11.4) 13 (10.6) 24 (19.5) 64 (52.0)
-35. I experience good collaboration with pharmacists in this clinical area.
13 (10.6)
12
(9.8) 18 (14.6) 23 (18.7) 48 (39.0) (7.3)9
36. Communication breakdowns that lead to delays in de-livery of care are common.
37
Concerning the existence of correlation be-tween the length of experience in the specialty area,
a signiicant inverse correlation was found in the tool in general (p=0.004; ρ=-0.25) and in domains 1 (p=0.004; ρ=-0.257), 2 (p=0.03; ρ=-0.19), 4 (p=0.007; ρ=-0.241) and 6 (p=0.009; ρ=-0.233).
As regards the time since graduation, a
sig-niicant inverse correlation was found in domains 2 (p=0.02; ρ=-0.20) and 6 (p=0.009; ρ=-0.23). The
length of experience at the institution also showed
signiicant inverse correlations in the general score (p=0.02; ρ=-0.21) and in domains 1 (p=0.03; ρ=-0.19), 4 (p=0.003; ρ=-0.26) and 6 (p=0.03; ρ=-0.20).
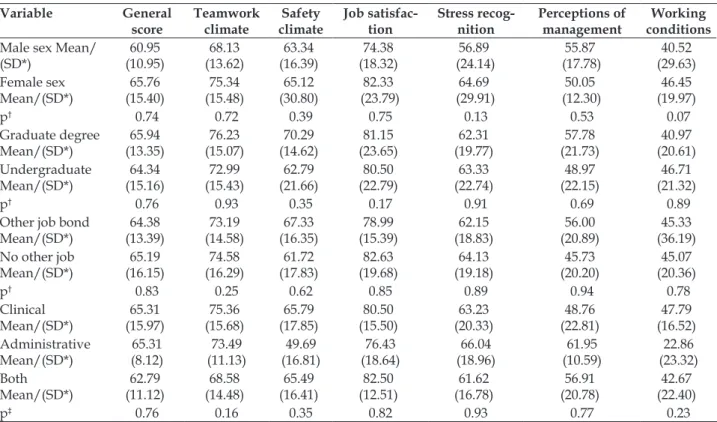
Concerning the bivariate analysis, no
sig-niicant differences were found between the sexes
(female and male), education level (graduate degree
or not) and presence of other job contract (present
or not) in relation to the general or domain scores (Table 5).
Table 5 – Distribution of difference of means between sexes, graduate degree, presence of other employment bond and professional experience in relation to general and domain scores. Uberaba-MG, Brazil, 2014 Variable General score Teamwork climate Safety climate Job satisfac-tion Stress recog-nition Perceptions of management Working conditions
Male sex Mean/ (SD*)
60.95
(10.95) (13.62)68.13
63.34
(16.39) (18.32)74.38
56.89
(24.14)
55.87
(17.78) (29.63)40.52
Female sex Mean/(SD*) 65.76 (15.40) 75.34 (15.48) 65.12 (30.80) 82.33
(23.79) (29.91)64.69 (12.30)50.05
46.45
(19.97)
p† 0.74 0.72 0.39 0.75 0.13 0.53 0.07
Graduate degree Mean/(SD*)
65.94
(13.35)
76.23
(15.07) (14.62)70.29
81.15 (23.65)
62.31
(19.77) (21.73)57.78 (20.61)40.97
Undergraduate Mean/(SD*) 64.34 (15.16) 72.99 (15.43) 62.79 (21.66) 80.50
(22.79) (22.74)63.33 (22.15)48.97
46.71
(21.32)
p† 0.76 0.93 0.35 0.17 0.91 0.69 0.89
Other job bond
Mean/(SD*)
64.38
(13.39) (14.58)73.19
67.33
(16.35)
78.99
(15.39) (18.83)62.15
56.00
(20.89) (36.19)45.33
No other job
Mean/(SD*)
65.19
(16.15)
74.58
(16.29) (17.83)61.72 (19.68)82.63 (19.18)64.13 (20.20)45.73
45.07
(20.36)
p† 0.83 0.25 0.62 0.85 0.89 0.94 0.78
Clinical Mean/(SD*)
65.31
(15.97) (15.68)75.36
65.79
(17.85) (15.50)80.50
63.23 (20.33) 48.76 (22.81) 47.79 (16.52) Administrative Mean/(SD*) 65.31 (8.12) 73.49 (11.13) 49.69 (16.81) 76.43 (18.64) 66.04
(18.96) (10.59)61.95 (23.32)22.86
Both Mean/(SD*) 62.79 (11.12) 68.58 (14.48) 65.49 (16.41) 82.50 (12.51) 61.62
(16.78) (20.78)56.91 (22.40)42.67
p‡ 0.76 0.16 0.35 0.82 0.93 0.77 0.23
*SD: Standard Deviation; †p: p-value (Student’s T test); ‡p: p-value (Anova test)
When ANOVA was applied with regard to the professional activity (clinical, administrative or
both), no signiicant difference was found between
the scores of the groups (p<0.05) (Table 5).
DISCUSSION
Among the study participants, the nursing
team was predominant (93.49%). In the literature,
studies using the same tool also revealed a greater proportion of nursing professionals in their samples:
93%,8 45%9 and 65%.10
The proportions of staff physicians and
phar-macists were smaller. The low response frequency of
physicians was observed in other studies using the
same tool, corresponding to 2.4%,9 7%8 and 6%10 of
the population for example. Nevertheless, in a study undertaken at a general and obstetric surgical center of a teaching hospital found high rates of adhesion
of the staff physicians (67 physicians; 36.21%).11 At
The adhesion rate of these professionals might be lower because, although the theme involves all health professionals, it is more prevalent in the cur-ricular matrix of nursing education courses.
Most professionals were female (78.9%),
as found in other studies originating in Taiwan
(87.2%),10 India (54.00%)9 and Sweden (89%), among others.12 In the health sector, more than 75% of the
female workforce is professionally active, with great concentration among nursing professionals. In line with these data, in Brazil, nursing, including bac-calaureate nurses, nursing technicians and auxiliary nurses, represents the largest workforce at the health institutions.13
On average, the professionals in this study had been professionally active at the institution for
3.67 years and the mean experience in the specialty
area was 3.64 years. In line with these data, a study undertaken at 13 general hospitals in Saudi Arabia showed that most professionals also had less than
ive years of experience in the specialty.14 The length
of professional experience at the institution and in the sector are important indicators of patient safety, representing the professional turnover inside the institution, which makes it impossible to maintain effective patient care and improves the interaction with respect to the standardization of regulations and routines at the sector.2
The mean general score was 67.50, that is,
inferior to the score recommended in the literature, representing a low safety climate. In the literature, studies were found that support the present data, such as 63.8 points,8 61.5 points2 and 41.4 points,10
for example.
In the domain analysis, the average score in
the irst domain, the teamwork climate, was 63.66
points (SD±13.38), demonstrating a bad perception
of the relationship quality and of the cooperation
among the team members. Studies also found similar averages.8,10 This can relect constant in
-terpersonal problems, an uncooperative team and workers who are frustrated with their professional acknowledgement.8 Interdisciplinary team training programs, eficient communication mechanisms and
continuing education on automated measures lead to a better teamwork climate.15-16
The mean score in the second domain, safety
climate, was 69.03 points (SD±16.69), below the
recommended score, evidencing the incipient orga-nizational commitment at the institution focused on patient safety. Other studies show similar data.8-10
see an actual dedication to patient safety at their service.8 Measures such as error reporting without
punishment and reformation of administrative pro-cesses to make the workers feel at ease to discuss safety contribute to improve and maintain the safety climate at the institutions.17
The domain score in the third domain, job sat
-isfaction, corresponded to 82.79 points, evidencing
the professionals’ positive perception of their work. In addition, the highest average score was found for
this domain, which supports the indings of a study
developed at ten American and two Swiss hospitals,
with an average score of 77.6.8
In an integrative review that assessed the job
satisfaction in the nursing team, it was observed that satisfaction involves professional recognition, wellbeing, excellence in care and good relationships
at work, which strongly inluences the institution
and the clients. On the other hand, the lack of so-cialization and complicity among the teams, the work burden, the professional discredit, the lack of material resources and the low salaries can cause dissatisfaction.18
The fourth domain, stress recognition, ac-knowledges the extent to which the stressors can
inluence the work practice, with an average score
of 65.32 points. In other studies that used the SAQ, low average scores were also found for stress,
ranging from 30.7 to 58.7 points,8,19-21 demonstrat-ing that these professionals do not recognize that situations of tension and stress negatively affect their performance.
The perceptions of management correspond
to the ifth domain in this study, with an average of 58.90 points. This domain is related to the approval
of the management actions, at the service as well as the hospital as a whole. This item showed the worst average score in the study, demonstrating the professionals’ dissatisfaction with the management
actions related to safety aspects. This can relect the
fact that the professionals that the management is not concerned with the wellbeing of the patients and
the institution. Lower scores were found in other studies, with averages ranging between 37 and 55
points.8,10,19,22-23
environment, with a mean score of 59.58. The profes
-sionals’ perspective on the quality of the workplace
is negative, in line with other studies, with scores ranging from 40 to 65 points.5,8,19,22-23
This may indicate shortages in the training programs, non-representative participation of the professionals in institutional decisions, demand-ing actions for improvements.8 Conditions like an
unbalanced nurse-patient relationships and long workdays contribute to professional exhaustion and error events, as they reduce their interactions with the patients and limit the effective sue of knowledge and skills.24
CONCLUSION
From the perspective of the health team pro-fessionals at a private hospital in Uberaba-MG, the patient safety climate was considered inferior to the literature recommendations, which can entail professional attitudes not focused on safe choices or the planning of actions with gaps regarding what could cause harm to the patients.
The worst scores found include the percep-tions of the service and hospital management and the working conditions, which represent fundamen-tal tools to develop safe practice.
The sociodemographic variables did not in-terfere in the assessment of the safety climate score.
According to the professional proile, a signiicant
inverse correlation was found in the overall tool and in most domains with the length of experience
in the specialty. A signiicant inverse correlation
was also found in two domains with the time since graduation, and an inverse correlation between the length of experience and the general score and three domain scores.
The assessment of the institutional safety cli-mate permits targeting actions to reduce the factors that contribute to errors, thus promoting higher
quality care and furthering the safety of profession -als and patients.
REFERENCES
1. Charles V. Segurança do paciente: orientações para
evitar os eventos adversos. Porto Alegre (RS): Yendis; 2010.
2. Carvalho REFL, Cassiani SHB. Questionário Atitudes
de Segurança: adaptação transcultural do Safety
Attitudes Questionnaire - Short Form 2006 para o
Brasil. Rev Latino-Am Enfermagem [Internet]. 2012
[cited 2015 Aug 5]; 20(3):. Available from: http://
3. The Nordic Council of Ministers. National Research Centre for the Working Environment Publications Questionnaires NOSACQ-50 - Safety Climate
Questionnaire [Internet]. [cited 2014 Dec 09]. Available from: http://www.arbejdsmiljoforskning.dk/en/ publikationer/spoergeskemaer/nosacq-50 2014
4. Reis CT, Laguardia J, Martins M. Translation and cross-cultural adaptation of the Brazilian version of the Hospital Survey on Patient Safety Culture: initial
stage. Cad Saúde Pública. 2012 Jan-Nov;
28(1):2199-210.
5. Rigobello MCG, Carvalho REFL, Cassiani SHB, Galon
T, Capucho HC, Deus NN. Clima de segurança do
paciente: percepção dos proissionais de enfermagem.
Acta Paul Enferm [Internet]. 2012 [cited 2015 Aug 5];
25(5):728-35. Available from: http://www.scielo.br/
pdf/ape/v25n5/13.pdf
6. Sexton JB, Thomas EJ. The safety attitudes questionnaire (SAQ): guidelines for administration. Huston (US): The University of Texas Center of Excellence for Patient Safety Research and Practice; 2003.
7. Ministério da Saúde (BR). Conselho Nacional de Saúde. Resolução 196, de 10 de outubro de 1996. Brasília (DF): Diário Oicial da União: 1996. Seção 1.
8. Schwendimann R, Zimmermann N, Küng K, Ausserhofer D, Sexton B. Variation in safety culture dimensions within and between US and Swiss Hospital Units: an exploratory study. BMJ Qual Saf. 2013 Jan; 22(1):32-41.
9. Patel, S, Wu AW. Safety Culture in Indian Hospitals:
A Cultural Adaptation of the Safety Attitudes
Questionnaire. J Patient Saf. 2016 Jun; 12(2):75-81.
10. Lee WC, Wung HY, Liao HH, Lo CM, Chang FL,
Wang PC, et al. Hospital safety culture in taiwan: a nation wide survey using chinese version safey
attitudes questionnaire. BMC Health Serv Res. 2010
Aug 10;10:234
11. Cauduro FLFC. Avaliação da cultura de segurança
em unidades cirúrgicas [dissertação]. Curitiba (PR): Universidade Federal do Paraná; 2013.
12. Göras C, Wallentin FY, Nilsson U, Ehrenberg A. Swedish translation and psychometric testing of
the safety attitudes questionnaire (operating room version). BMC Health Serv Res. 2013 Mar 19; 13:104.
13. Conselho Federal de Enfermagem (CFE). Atlas da
Enfermagem – Proissionais de enfermagem por sexo
no Brasil [Internet]. Brasília, DF: CFE; 2011 [cited 2015 Aug 5]. Available from: http://www.cofen.gov.br/
wp-content/uploads/2012/03/pesquisaproissionais.
14. Alahmadi HA. Assessment of patient safety culture in Saudi Arabian hospitals. Qual Saf Health Care. 2010
Oct; 19(5):e17.
15. Weaver SJ, Lubomksi LH, Wilson RF, Pfoh ER,
16. Fagan MJ. Techniques to improve patient safety in hospitals: what nurse administrators need to know. J
Nurs Adm. 2012 Sep; 42(9):426-30.
17. Mcfadden KL, Stock GN, Gowen CR. Leadership, safety climate, and continuous quality improvement: impact on process quality and patient safety. J Nurs Adm. 2014 Oct; 44(10 Suppl):S27-37.
18. Melo MB, Barbosa MA, Souza PR. Satisfação
no trabalho da equipe de enfermagem: revisão integrativa. Rev Latino-Am Enferm [Internet]. 2011 Jul.-Ago [cited 2015 Aug 6]; 19(4):[09 telas]. Available from: http://www.scielo.br/pdf/rlae/v19n4/pt_26.
19. Chaboyer W, Chamberlain D, Hewson-Conroy K,
Grealy B, Elderkin T, Brittin M, et al. CNE Article: Safety culture in australian intensive care units:
establishing a baseline for quality improvement. Am J Crit Care. 2013 Mar; 22(2):93-102.
20. Proit J, Etchegaray J, Petersen LA, Sexton JB, Hysong
SJ, Mei M, et al. The safety attitudes questionnaire
as a tool for bench marking safety culture in the
NICU. Arch Dis Child Fetal Neonatal Ed. 2012 Mar;
97(2):F127-32.
21. Raftopoulos V, Pavlakis A. Safety climate in 5 intensive care units: a Nationwide hospital survey using the Greek-Cypriot version of the safety attitudes
questionnaire. J Crit Care. 2013 Feb; 28(1):51-61.
22. Marinho MM, Radünz V, Barbosa SFF. Assessment of safety culture by surgical unit nursing teams. Texto Contexto Enferm [Internet]. 2014 [cited 2015
Aug 6]; 23(3):581-90. Available from: http://www. scielo.br/scielo.php?script=sci_arttext&pid=S0104-07072014000300581&lng=en&nrm=iso&tlng=en&O RIGINALLANG=en
23. Gutiérrez-Cía I, De Cos Pm, Juan Ay, Obón-Azuara B,
Alonso-Ovies Á, Martin-Delgado Mc, et al.Percepcíon
de la cultura de seguridade en los servicios de medicina
intensiva españoles. Med Clínica. 2010 Jul; 135(1):37-44.
24. Atei N, Abdullah KL, Wong LP, Mazlom R. Factors
influencing registered nurses perception of their
overall job satisfaction: a qualitative study. Int Nurs
Rev. 2014 Sep; 61(3):352-60.
Correspondence: Maria Helena Barbosa