Feasibility of transitioning from APACHE II to SAPS III as
prognostic model in a Brazilian general intensive care unit.
A retrospective study
Viabilidade da transição do APACHE II para o SAPS III como modelo prognóstico em
uma unidade de terapia intensiva geral no Brasil. Um estudo retrospectivo
Ary Serpa Neto
I, Murillo Santucci Cesar de Assunção
II, Andréia Pardini
III, Eliézer Silva
IVDepartment of Critical Care Medicine, Hospital Israelita Albert Einstein (HIAE), São Paulo, Brazil
ABSTRACT
CONTEXT AND OBJECTIVE: Prognostic models relect the population characteristics of the countries from which they originate. Predictive models should be customized to it the general population where they will be used. The aim here was to perform external validation on two predictive models and compare their performance in a mixed population of critically ill patients in Brazil.
DESIGN AND SETTING: Retrospective study in a Brazilian general intensive care unit (ICU).
METHODS: This was a retrospective review of all patients admitted to a 41-bed mixed ICU from August 2011 to September 2012. Calibration (assessed using the Hosmer-Lemeshow goodness-of-it test) and discrimination (assessed using area under the curve) of APACHE II and SAPS III were compared. The stan-dardized mortality ratio (SMR) was calculated by dividing the number of observed deaths by the number of expected deaths.
RESULTS: A total of 3,333 ICU patients were enrolled. The Hosmer-Lemeshow goodness-of-it test showed good calibration for all models in relation to hospital mortality. For in-hospital mortality there was a worse it for APACHE II in clinical patients. Discrimination was better for SAPS III for in-ICU and in-hospital mortality (P = 0.042). The SMRs for the whole population were 0.27 (conidence interval [CI]: 0.23 – 0.33) for APACHE II and 0.28 (CI: 0.22 – 0.36) for SAPS III.
CONCLUSIONS: In this group of critically ill patients, SAPS III was a better prognostic score, with higher discrimination and calibration power.
RESUMO
CONTEXTO E OBJETIVO: Modelos prognósticos reletem as características da população dos países de onde eles são originários. Modelos preditivos devem ser customizados para se adequar à população geral onde eles serão utilizados. O objetivo aqui foi de realizar a validação externa de dois modelos preditivos e comparar o seu desempenho em uma população mista de pacientes graves no Brasil.
TIPO DE ESTUDO E LOCAL: Estudo retrospectivo em uma unidade de terapia intensiva geral brasileira.
MÉTODOS: Este é um estudo retrospectivo de todos os pacientes internados em uma unidade de terapia intensiva (UTI) mista com 41 leitos entre agosto de 2011 e setembro de 2012. A calibração (avaliada com o teste de Hosmer-Lemeshow goodness-of-it) e a discriminação (avaliada como a área sob a curva) do APACHE II e do SAPS III foram comparados. A razão de mortalidade padronizada (SMR) foi calculada pela divisão do número de óbitos observados pelo número de óbitos esperados.
RESULTADOS: Um total de 3.333 pacientes internados na UTI foi registrado. O teste de Hosmer-Lemeshow goodness-of-it demonstrou boa calibração para todos os modelos em relação a mortalidade hospitalar. Para a mortalidade intra-hospitalar, há um ajuste pior do APACHE II em pacientes clínicos. A discriminação foi melhor para o SAPS III para mortalidade na UTI e no hospital (P = 0,042). A SMR para toda a população foi de 0,27 (intervalo de coniança [IC]: 0,23-0,33) para APACHE II e de 0,28 (IC: 0,22-0,36) para SAPS III.
CONCLUSÕES: Neste grupo de pacientes graves, o SAPS III é o melhor escore prognóstico, com a maior discriminação e poder de calibração.
IMSc. Physician, Discipline of Critical Care
Medicine, Faculdade de Medicina do ABC (FMABC), Santo André, São Paulo, Brazil, Department of Critical Care Medicine, Hospital Israelita Albert Einstein (HIAE), São Paulo, Brazil.
IIMD, MSc. Physician, Department of Critical
Care Medicine, Hospital Israelita Albert Einstein (HIAE), São Paulo, Brazil.
IIIBSc. Nurse, Department of Critical Care
Medicine, Hospital Israelita Albert Einstein (HIAE), São Paulo, Brazil.
IVMD, PhD. Director of Department of Critical
Care Medicine, Hospital Israelita Albert Einstein (HIAE), São Paulo, Brazil.
KEY WORDS: APACHE. Mortality. Intensive care units. Prognosis. Intensive care.
PALAVRAS-CHAVE: APACHE.
Mortalidade.
Unidades de terapia intensiva. Prognóstico.
INTRODUCTION
Prognostic models relect the population characteristics of the countries from which they originate. he development of the Acute Physiology and Chronic Health Evaluation II (APACHE II) system was based on a cohort of patients in the United States,1 and it has been used in many intensive care units around the word. In con-trast, the Simpliied Acute Physiology Score III (SAPS III) was vali-dated in a multicenter and multinational cohort study.2
Predictive models should be customized to it the case-mix population where they will be used because the outcomes in the original databases and period from which the models were derived may be diferent from the databases of intensive care units (ICUs) using the models.3,4 It is not clear whether calibra-tion of the established models for local circumstances would enhance their accuracy in stratifying patients.5
Although the methods have been reported to adapt well to diferent periods and case mixes, few studies have formally assessed the models’ predictive accuracy when applied to new populations from other institutions or countries.6-9 In South America, SAPS III was calibrated with a level of 1.3 (i.e. the rela-tionship between observed and predicted mortality was 1.3).2,10 Recently studies have validated SAPS III in diferent Brazilian cohorts of patients, obtaining good results.11-13
Comparison between observed and predicted mortality rates could serve as an indicator of ICU performance, and lead to overall improvement in healthcare services. However, ICU proiles vary worldwide, depending on the proportions of med-ical and surgmed-ical patients, admission and discharge policies, availability of intermediate care units and staing with inten-sive care specialists.13
Any transition from a well-established approach to a new one requires caution and validation. Changing APACHE II for SAPS III has some advantages and the most important is the fact that SAPS III is the only prognostic score that included a cohort of patients from South America in its development.
OBJECTIVE
In the present study, we aimed to perform external validation on two predictive models and directly compare their performance in an independent population of mixed critically ill patients.
METHODS
Data collection
his study was approved by the Ethics Committee of Hospital Israelita Albert Einstein and, because of the retrospective nature of the study, the informed consent requirement was waived. he data were collected from all patients admitted to a mixed 41-bed ICU in the tertiary-level private hospital in Brazil from August 2011 to September 2012.
Data were retrospectively collected using APACHE II only between August 2011 and December 2011, and using SAPS III only between May 2012 and September 2012. From January 2012 to April 2012, during a period of calibration, both scores were cal-culated for all patients admitted to the ICU and were collected for analysis. he data collection practices were standardized and per-formed by a trained nurse or physician. All data were checked for implausible and outlying values. he data included age, gender and type of admission (clinical, elective surgery or emergency surgery).
Study population
All ICU admissions were enrolled during the period analyzed. he exclusion criteria were: age < 18 years, missing data and not receiving ICU care. he admissions between January 2012 and April 2012 were used as a validation database to study the perfor-mance of APACHE II versus SAPS III for all admissions and in subgroups according to the type of admission.
Scores and predicted mortalities
he calculations of the individual scores for each model were based on the most disordered physiological values recorded during the irst 24 hours of ICU admission for APACHE II and were based on the variables measured one hour before and ater ICU admis-sion for SAPS III. he mortality probabilities for APACHE II and SAPS III were calculated using the original equations.1,2
Performance of the scores
he calibration of the scores was tested using the Hosmer-Lemeshow goodness-of-it procedure, which was calculated by dividing the admis-sions into ten deciles according to the risk of death. he chi-square sta-tistics were determined for each decile and summing the chi-square values for the ten deciles resulted in the test value.14 A high P value would indicate a good it for the model. Hosmer-Lemeshow is a test for assessing agreement between the actual and predicted death rates. he discriminative ability of the models was assessed using receiver operating characteristic (ROC) curves and the respective areas under curves (AUC).15 he AUC is an expression of the model’s ability to discriminate correctly between survivors and non-survivors.
he standardized mortality ratio (SMR) was calculated using the models by dividing the number of observed deaths by the number of expected deaths. Conidence intervals for the SMR were calculated to test the model’s uniformity-of-it, using the methods that have been put forward.16 he variables were compared between the three periods using analysis of variance (ANOVA). Calibration curves were constructed by plotting the predicted death rates stratiied as 5% intervals of mortality risk (x-axis) versus observed death rates (y-axis). Finally, we constructed a model using Cox regression analy-sis with APACHE II and SAPS III as independent factors.
otherwise. All the statistical procedures were performed using the SPSS 20.0 statistical package (SPSS, Chicago, Illinois, USA).
RESULTS
Study population
A total of 3,333 ICU admissions were enrolled until the end of September 2012. he formation of the database is presented in
Table 1. he characteristics of the population in the three
peri-ods are presented in Table 2. he ICU and hospital mortality
and the APACHE II score decreased over time, and the SAPS III score increased during the periods.
Calibration and discrimination
he Hosmer-Lemeshow goodness-of-it statistics supported model it for all in-ICU mortality models with the exception of APACHE II for patients in the calibration database undergoing elective surgery. For in-hospital mortality, there was worse it for APACHE II among clinical patients during the irst period and for SAPS III among patients in the calibration database undergoing elective surgery (Table 3). he calibra-tion curves for APACHE II and SAPS III showed overestimacalibra-tion of the risk of death in all ranges of predicted mortality (Figure 1).
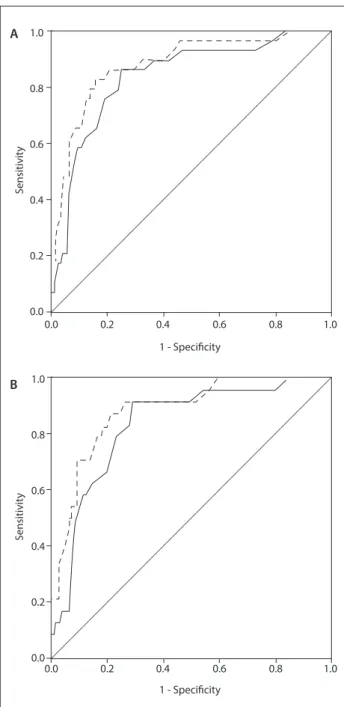
Discrimination, as tested by the AUC, among general and clinical patients, was better for SAPS III in relation to in-ICU and in-hospital mortality (P = 0.042) (Table 4). Figure 2 shows the ROC for SAPS III and APACHE II, for in-ICU mortality in the calibration database in diferent situations.
Standardized mortality ratio
he SMRs for the whole population were 0.27 (CI: 0.23 – 0.33) for APACHE II and 0.28 (CI: 0.22 – 0.36) for SAPS III. In the cal-ibration database, the SMRs for APACHE II and SAPS III were 0.33 (CI: 0.22 – 0.50), and 0.36 (CI: 0.25 – 0.55), respectively. Table 1. Study database
Data gathered (admissions) 3,333 Age, years 65.47 ± 18.02 Type of admission, n (%)
Clinical 2,155 (64.65) Elective surgery 994 (29.82) Emergency surgery 184 (5.53) Study population, n (%)
Apache II 1,495 (44.90) Calibration (SAPS III + APACHE II) 425 (12.80) SAPS III 1,413 (42.40)
APACHE II = acute physiology and chronic health disease classiication system II; SAPS III = simpliied acute physiology score III.
Table 2. Characteristics of the study population
APACHE II database Calibration database SAPS III database
P-value
n = 1,495 % n = 425 % n = 1,413 %
Type of admission, n (%)
Clinical 1,061 70.96 246 57.90 848 60.00
< 0.0001
Elective surgery 332 22.20 38 8.90 44 3.10
Emergency surgery 102 6.84 141 33.20 521 36.90 Period 2011 (August – December) 2012 (January – April) 2012 (May – September)
Age, years 65.76 ± 17.82 64.23 ± 7.99 65.53 ± 18.23 0.299 Mortality, n (%)
ICU 127 8.50 29 6.80 73 5.20 0.002
Hospital 212 14.20 50 11.80 134 9.50 0.001
Length of stay in ICU, days
Mean – – 3.61 ± 4.91 – 3.59 ± 5.42 – 0.930
Maximum – – 43.00 – 59.00 –
Mean among survivors – – 3.28 ± 4.18 – 3.27 ± 4.79 – 0.977 Mean among non-survivors – – 8.17 ± 9.79 – 9.38 ± 10.66 – 0.598 Length of stay in hospital, days
Mean – – 22.04 ± 30.53 – 18.73 ± 41.00 – 0.127
Maximum – – 217.00 – 792.00 –
Mean among survivors – – 19.99 ± 27.88 – 16.98 ± 37.54 – 0.097 Mean among non-survivors – – 37.28 ± 43.00 – 34.26 ± 62.02 – 0.711 Scores
APACHE II 18.20 ± 7.09 – 14.97 ± 7.72 – – – < 0.0001 SAPS III – – 30.50 ± 17.00 – 45.62 ± 15.67 – < 0.0001 Probability of death, %
APACHE II 30.74 ± 19.22 – 20.56 ± 20.69 – – – < 0.0001 SAPS III – – 18.59 ± 22.76 – 18.40 ± 20.04 – 0.864
For all models, the SMRs showed some variation across the spectrum of patients. he SMRs ranged from 0.24 to 0.46 for APACHE II, and from 0.09 to 0.31 for SAPS III. In the calibra-tion database, the SMRs ranged from 0.13 to 0.38 for APACHE II, and from 0.18 to 0.40 for SAPS III (Table 5).
Cox regression model
he hazard ratios for in-hospital and in-ICU mortality using APACHE II as an independent factor were 1.08 (95% CI: 1.04 – 1.12) Figure 1. Calibration curve for APACHE II (black line and bar) and SAPS III (gray line and bar). The bars represent the number of patients in each risk group. The dashed diagonal line indicates ideal prediction (predicted = observed mortality).
700
600
500
400
300
200
100
0
100 90 80 70 60 50 40 30 20 10 0
Estimated risk of hospital mortality (%)
Obser
ved hospital mor
talit
y
No
. of pa
tien
ts per str
a
tum
<5 <10 <15 <20 <25 <30 <35 <40 <45 <50 <55 <60 <65 <70 <75 <80 <85 <90 <95
<100
Scores In-ICU mortality In-hospital mortality
Hosmer-Lemeshow DF P-value Hosmer-Lemeshow DF P-value
General
APACHE II 7.069 7 0.422 14.298 8 0.074
CD APACHE II 6.052 8 0.641 6.247 8 0.620
SAPS III 6.739 8 0.565 5.927 8 0.655
SAPS III 8.508 8 0.385 5.340 8 0.721
Clinical patients
APACHE II 6.849 7 0.445 17.915 8 0.022
CD APACHE II 5.608 8 0.691 6.694 8 0.570
SAPS III 5.688 8 0.682 4.588 8 0.801
SAPS III 5.479 8 0.705 10.041 8 0.262
Emergency surgery
APACHE II 14.262 8 0.075 4.372 8 0.822
CD APACHE II 6.646 7 0.467 6.137 7 0.524
SAPS III 1.534 7 0.981 4.732 7 0.693
SAPS III 7.956 8 0.438 6.066 7 0.532
Elective surgery
APACHE II 3.867 7 0.795 6.516 7 0.481
CD APACHE II 16.413 8 0.037 8.569 8 0.380
SAPS III 6.548 7 0.477 14.585 7 0.042
SAPS III 0.459 8 1.000 10.734 8 0.217
Table 3. Model calibration assessed by means of Hosmer-Lemeshow goodness-of-it statistics
ICU = intensive care unit; APACHE II = acute physiology and chronic health disease classiication system II; SAPS III = simpliied acute physiology score III; DF = degrees of freedom; CD = Calibration database.
Scores
Outcome
C-statistic (95% conidence interval)
In-ICU mortality In-hospital mortality
General
APACHE II 0.816 (0.777-0.856) 0.802 (0.770-0.834)
CD APACHE II 0.842 (0.767-0.917) 0.784 (0.713-0.854) SAPS III 0.883 (0.818-0.949) 0.828 (0.767-0.890) SAPS III 0.872 (0.832-0.912) 0.832 (0.795-0.868)
Clinical patients
APACHE II 0.817 (0.769-0.865) 0.817 (0.780-0.854)
CD APACHE II 0.838 (0.761-0.915) 0.789 (0.710-0.868) SAPS III 0.886 (0.822-0.950) 0.827 (0.756-0.898) SAPS III 0.818 (0.765-0.871) 0.806 (0.765-0.848)
Emergency surgery
APACHE II 0.847 (0.752-0.941) 0.799 (0.693-0.905)
CD APACHE II 0.819 (0.590-1.048) 0.814 (0.578-1.049) SAPS III 0.862 (0.727-0.997) 0.858 (0.719-0.997) SAPS III 0.605 (0.459-0.751) 0.712 (0.524-0.899)
Elective surgery
APACHE II 0.805 (0.702-0.908) 0.788 (0.709-0.867)
CD APACHE II 0.622 (0.101-1.143) 0.599 (0.364-0.833 SAPS III 0.597 (0.208-0.986) 0.675 (0.502-0.848) SAPS III 0.983 (0.964-1.000) 0.736 (0.621-0.852)
Table 4. C-statistics (area under receiver operating characteristic curve) as measurement of discrimination between survivors and non-survivors (in-ICU and in-hospital)
ICU = intensive care unit; APACHE II = acute physiology and chronic health disease classiication system II; SAPS III = simpliied acute physiology score III; CD = Calibration database.
DISCUSSION
he external validation of these two widely used prognostic models showed good discrimination and good calibration when applied to the same independent population of Brazilian ICU patients. he transition from APACHE II to SAPS III in this Brazilian ICU was feasible and, in some scenarios, SAPS III had even better per-formance than APACHE II.
he SAPS III score was developed using data from 16,784 patients.2 However, it was not developed to be represen-tative of all ICU patients, since it was developed in a cohort of general patients. herefore, external validation is extremely important before applying this score to any type of patient. he cohort used for the conception of the SAPS III model involved patients from Brazilian ICUs, which might explain its supe-riority to APACHE II in our study. Also, the SAPS III model is based exclusively on data evaluated during the irst hour of admission to the ICU.2 Prognostic systems that include mea-surements during and/or ater the irst 24 hours of admission, like APACHE II, oten relect standard care and not the real clinical status of the patient.
Severity scores have the aim of measuring the severity of the disease of ICU patients and are proposed as tools to aid in outcome assessment and resource allocation. Furthermore, they are used for comparisons of outcomes and quality of care between ICUs.5
Our indings are supported by other studies published in the literature. Soares et al.11 demonstrated that SAPS III had excellent discrimination in Brazilian ICUs and that APACHE II was unsatisfactory due to its lower discriminatory power and lack of calibration for some populations. However, they also found that SAPS III overestimated hospital mortality, as also found in our study. In a cohort of Brazilian patients, Silva Júnior et al.17 concluded that SAPS III is a useful tool for deter-mining which patients will need more care, and for the evolu-tion of high-risk surgical patients.
Alves et al.18 showed, among elderly patients admitted to an ICU, that SAPS III had excellent discrimination, but that the cali-bration was inadequate. Soares et al.12 also showed that SAPS III had good discrimination and inadequate calibration among Figure 2. Receiver operating characteristic curve for
APACHE II (black line) and SAPS III (black dotted line) in general population (A) and clinical patients (B).
S
ensitivit
y
S
ensitivit
y
1 - Specificity
1 - Specificity
0.0 0.2 0.4 0.6 0.8 1.0
0.0 0.2 0.4 0.6 0.8 1.0
1.0
0.8
0.6
0.4
0.2
0.0
1.0
0.8
0.6
0.4
0.2
0.0 B A
Table 5. Standardized mortality ratio calculated using the prediction models according to type of admission (95% conidence interval)
Type of admission
APACHE II Calibration database SAPS III
Admissions (%)
Deaths
(%) SMR
Admissions (%)
Deaths (%)
SMR APACHE II
SMR SAPS III
Admissions (%)
Deaths
(%) SMR
Clinical 1,061 (70.9) 87 (8.19) 0.269 (0.22-0.34) 246 (57.8) 24 (9.80) 0.378 (0.25-0.59) 0.407 (0.26-0.63) 848 (60.0) 69 (8.13) 0.312 (0.24-0.40) Elective surgery 332 (22.2) 25 (7.53) 0.241 (0.16-0.36) 141 (33.1) 2 (1.40) 0.135 (0.03-057) 0.183 (0.04-0.81) 521 (36.9) 3 (0.57) 0.093 (0.03-0.30) Emergency surgery 102 (6.8) 15 (14.7) 0.460 (0.27-0.81) 38 (9.10) 3 (7.90) 0.327 (0.10-1.14) 0.324 (0.10-1.14) 44 (3.10) 1 (2.27) 0.151 (0.02-1.11) Total 1,495 (100) 127 (8.50) 0.276 (0.23-0.33) 425 (100) 29 (6.80) 0.331 (0.22-0.50) 0.366 (0.25-0.55) 1,413 (100) 73 (5.20) 0.281 (0.22-0.36)
cancer patients. Costa e Silva et al.19 showed, in Brazilian critically ill patients with acute kidney injury, that SAPS III presented good discrimination and calibration performances, accurately predict-ing mortality in this group of patients. Finally, Nassar et al.13 dem-onstrated that SAPS III had good discrimination and inadequate calibration in a general cohort of Brazilian patients.
Our indings are supported by several studies that compared APACHE II with SAPS in diferent scenarios.20-22 hese scores have also already been used with other aims like estimation of prolonged mechanical ventilation in surgical patients.23 In our hospital, we have a high number of liver transplantation proce-dures, and the performance of these scores in these population is a matter of debate.24-26 Also, one limitation of this study is that our hospital has a lower mortality rate than other institutions from Brazil and this makes it diicult to diferentiate whether we have a score with bad performance or whether we have an ICU with excellent performance.
CONCLUSIONS
We showed, in a Brazilian cohort of critically ill patients, that SAPS III was a better prognostic score, with higher discrimina-tion and calibradiscrimina-tion power. he transidiscrimina-tion from APACHE II to SAPS III was feasible in this scenario.
REFERENCES
1. Knaus WA, Draper EA, Wagner DP, Zimmerman JE. APACHE II: a severity
of disease classiication system. Crit Care Med. 1985;13(10):818-29.
2. Metnitz PG, Moreno RP, Almeida E, et al. SAPS 3--From evaluation
of the patient to evaluation of the intensive care unit. Part 1:
Objectives, methods and cohort description. Intensive Care Med.
2005;31(10):1336-44.
3. Metnitz PG, Valentin A, Vesely H, et al. Prognostic performance and
customization of the SAPS II: results of a multicenter Austrian study.
Simpliied Acute Physiology Score. Intensive Care Med. 1999;25(2):192-7.
4. Moreno R, Morais P. Outcome prediction in intensive care: results of
a prospective, multicentre, Portuguese study. Intensive Care Med.
1997;23(2):177-86.
5. Suistomaa M, Niskanen M, Kari A, Hynynen M, Takala J. Customized
prediction models based on APACHE II and SAPS II scores in patients
with prolonged length of stay in the ICU. Intensive Care Med.
2002;28(4):479-85.
6. Beck DH, Smith GB, Pappachan JV, Millar B. External validation of
the SAPS II, APACHE II and APACHE III prognostic models in South
England: a multicentre study. Intensive Care Med. 2003;29(2):249-56.
7. Wong DT, Crofts SL, Gomez M, McGuire GP, Byrick RJ. Evaluation of
predictive ability of APACHE II system and hospital outcome in Canadian
intensive care unit patients. Crit Care Med. 1995;23(7):1177-83.
8. Markgraf R, Deutschinof G, Pientka L, Scholten T. Comparison of acute
physiology and chronic health evaluations II and III and simpliied
acute physiology score II: a prospective cohort study evaluating
these methods to predict outcome in a German interdisciplinary
intensive care unit. Crit Care Med. 2000;28(1):26-33.
9. Moreno R, Miranda DR, Fidler V, Van Schilfgaarde R. Evaluation of two
outcome prediction models on an independent database. Crit Care
Med. 1998;26(1):50-61.
10. Moreno RP, Metnitz PG, Almeida E, et al. SAPS 3--From evaluation
of the patient to evaluation of the intensive care unit. Part 2:
Development of a prognostic model for hospital mortality at ICU
admission. Intensive Care Med. 2005;31(10):1345-55.
11. Soares M, Salluh JI. Validation of the SAPS 3 admission prognostic
model in patients with cancer in need of intensive care. Intensive
Care Med. 2006;32(11):1839-44.
12. Soares M, Silva UV, Teles JM, et al. Validation of four prognostic scores
in patients with cancer admitted to Brazilian intensive care units:
results from a prospective multicenter study. Intensive Care Med.
2010;36(7):1188-95.
13. Nassar AP Jr, Mocelin AO, Nunes AL, et al. Caution when using
prognostic models: a prospective comparison of 3 recent prognostic
models. J Crit Care. 2012;27(4):423.e1-7.
14. Hosmer DW, Lemeshow S. Applied logistic regression. Wiley; 1989.
15. Hanley JA, McNeil BJ. The meaning and use of the area under
the receiver operating characteristic (ROC) curve. Radiology.
1982;143(1):29-36.
16. Gardner MJ, Altman DG. Confidence intervals rather than P
values: estimation rather than hypothesis testing. BMJ. 1986;
292(6522):746-50.
17. Silva Júnior JM, Malbouisson LM, Nuevo HL, et al. Applicability of the
simpliied acute physiology score (SAPS 3) in Brazilian hospitals. Rev
Bras Anestesiol. 2010;60(1):20-31.
18. Alves CJ, Franco GPP, Nakata CT, et al. Avaliação de índices
prognósticos para pacientes idosos admitidos em unidades de
terapia intensiva [Evaluation of prognostic indicators for elderly
patients admitted in intensive care units]. Rev Bras Ter Intensiva.
2009;21(1):1-8.
19. Costa e Silva VT, de Castro I, Liaño F, et al. Performance of the
third-generation models of severity scoring systems (APACHE IV, SAPS 3
and MPM-III) in acute kidney injury critically ill patients. Nephrol Dial
Transplant. 2011;26(12):3894-901.
20. Khwannimit B, Bhurayanontachai R. The performance of customised
APACHE II and SAPS II in predicting mortality of mixed critically ill
patients in a Thai medical intensive care unit. Anaesth Intensive Care.
2009;37(5):784-90.
21. Beck DH, Smith GB, Taylor BL. The impact of low-risk intensive care
unit admissions on mortality probabilities by SAPS II, APACHE II and
APACHE III. Anaesthesia. 2002;57(1):21-6.
22. McNelis J, Marini C, Kalimi R, et al. A comparison of predictive
outcomes of APACHE II and SAPS II in a surgical intensive care unit.
23. Kern H, Redlich U, Hotz H, et al. Risk factors for prolonged ventilation
after cardiac surgery using APACHE II, SAPS II, and TISS: comparison of
three diferent models. Intensive Care Med. 2001;27(2):407-15.
24. Chung SW, Kirkpatrick AW, Kim HL, Scudamore CH, Yoshida EM.
Correlation between physiological assessment and outcome after
liver transplantation. Am J Surg. 2000;179(5):396-9.
25. Umbro I, Tinti F, Mordenti M, et al. Model for end-stage liver disease
score versus simpliied acute physiology score criteria in acute renal
failure after liver transplantation. Transplant Proc. 2011;43(4):1139-41.
26. Bein T, Fröhlich D, Pömsl J, Forst H, Pratschke E. The predictive value of
four scoring systems in liver transplant recipients. Intensive Care Med.
1995;21(1):32-7.
Sources of funding: None
Conlict of interest: None
Date of irst submission: December 16, 2013
Last received: January 3, 2014
Accepted: April 22, 2014
Address for correspondence: Murillo Santucci César Assunção
Av. Albert Einstein, 700
São Paulo — Brasil
CEP 05651-901
Tel. (+ 55 11) 2151-1500