THIS
DOCUMENT
IS
NOT
AN
INVESTMENT
RECOMMENDATION
AND
SHALL
BE
USED
EXCLUSIVELY
FOR
ACADEMIC
PURPOSES
(SEE DISCLOSURES AND DISCLAIMERS AT END OF DOCUMENT)See more information at WWW.NOVASBE.PT Page 1/37
M
ASTERS IN
F
INANCE
E
QUITY
R
ESEARCH
The 10% voting rights limit has been revoked. Isabel dos Santos (Kento+Jadeium) bought Telefonica’s participation (4,99%) and an additional 0,102% of ZON’s shares. She is now ZON’s core shareholder with 15,02% and we believe her to be a potential purchaser of CGD and BES stakes. Odds on the telecom sector’s consolidation have increased.
Cash Flow Generation in Sight
–
Resilient Business
Despite of the macroeconomic turmoil, we believe ZON’s business will show resilience (steady revenues). Reduced CAPEX (we expect a change of -13,6% and -13,0% in 2012E and 2013E respectively) and improved EBITDA margins (from 36,4% in 2011FY to 37,4% in 2012E and 38,5% in 2013E) will allow FCFE to increase from 51M€ in 2011FY to 130M€ in 2012E.Need for Growth
Portuguese Pay-TV market is saturated. ZON’s growth prospects are limited. We believe ZAP’s potential growth will relieve some pressure now that ZON consolidates its 30% stake. A potential merger with Sonaecom (where we foresee 330M€ synergies in our base case scenario) would also outline this issue.
Costly Debt Refinancing
Access to debt markets is difficult for Portuguese firms. We believe ZON will only have to refinance in 2013FY as levels of cash and the recent 100M€ bonds issuance ensure the payment of 499M€ debt maturing in 2012. Yet, higher costs of debt shall affect ZON’s FCFE (ZON’s bonds issued recently already pay a 6,85% coupon vs the previous 4,0% all-in average cost of debt).
ZON MULTIMEDIA
COMPANY REPORT
TELECOM AND MEDIA SERVICES
JUNE
4
TH2012
S
TUDENT
:
MARGARIDA FONSECA
[email protected]
Shareholders in the Spotlight
Voting Rights Cap Abolished
Recommendation: BUY
Price Target FY12: 2,45 €
Upside 20 %
Price (as of 4-Jun-12) 2,05 €
Reuters: ZON.LS, Bloomberg: ZON:PL
52-week range (€) 1,78-3,58
Market Cap (€m) 634
Outstanding Shares (m) 309.096,828
Source: Analyst Estimates; Bloomberg
0 2000 4000 6000 8000
2-Jun 2-Aug 2-Oct 2-Dec 2-Feb 2-Apr
PSI 20 ZON
Source: Bloomberg
(Values in € millions) 2011 2012E 2013E Financials
Revenues 855 870 876
EBITDA 311 318 330
Net Profit 34 31 54
EPS (€) 0,11 0,10 0,17
DPS (€) 0,16 0,18 0,20
Ratios
ROIC (%) 5,0% 6,6% 9,5%
Net Debt/EBITDA (x) 2,7 2,3 1,9
EV/Revenues (x) 1,9 1,9 1,9
EV/EBITDA (x) 5,2 5,1 4,9
ZONMULTIMEDIA COMPANY REPORT
THIS
DOCUMENT
IS
NOT
AN
INVESTMENT
RECOMMENDATION
AND
SHALL
BE
USED
EXCLUSIVELY
FOR
ACADEMIC
PURPOSES
(SEE DISCLOSURES AND DISCLAIMERS AT END OF DOCUMENT)PAGE 2/37
Table of Contents
TABLE OF CONTENTS ... 2
INVESTMENT CASE ... 3
VALUATION ... 4
DCF YIELDS A 2,86EUR/SHARE TARGET PRICE ... 4
ZON-PORTUGAL ... 4
MULTIPLES VALUATION:ZON TRADING AT DISCOUNT ... 6
ZON OVERVIEW ... 7
COMPANY DESCRIPTION ... 7
SHAREHOLDER STRUCTURE ... 10
GROWTH OPPORTUNITIES ... 11
ZON VS EUROPEAN COMPARABLES ...18
MACROECONOMIC OUTLOOK ...20
EUROZONE’S FUTURE ... 21
COMPETITORS ...23
PT HEAD TO HEAD ... 23
ON A DIFFERENT GAME ... 25
MEDIA &ENTERTAINMENT ACTIVITIES ... 26
FINANCIAL FORECASTS ...27
PORTUGAL REVENUES SLOWDOWN IN 2012E;SLOW PACE RECOVERY AFTERWARDS ... 27
LOW EBITDAMARGIN;PRESSURE ON COSTS REDUCTION ... 30
APPENDIX ...32
ZONMULTIMEDIA COMPANY REPORT
THIS
DOCUMENT
IS
NOT
AN
INVESTMENT
RECOMMENDATION
AND
SHALL
BE
USED
EXCLUSIVELY
FOR
ACADEMIC
PURPOSES
(SEE DISCLOSURES AND DISCLAIMERS AT END OF DOCUMENT)PAGE 3/37
Investment Case
ZON’s 10% limit on voting rights has been revoked in January 2012, enhancing odds for consolidation. Changes on shareholder structure have been a reality over the last four months, with Isabel dos Santos ending up with a 15,02% stake of ZON’s shares through Kento Holding and Jadeium participations. We believe the Angolan businesswoman will increase its stake up to 20-25%, with CGD, BES or even minority shareholders on the sell side. With a potential controlling shareholder, we see the merger with Sonaecom likely to occur – we estimate cost synergies of 330M€ -, albeit we consider other options, namely Vodafone. ZON’s core business – Pay-TV, Broadband and Voice – reveals resilience with cable subscribers base increasing from 1,18 to 1,20 million in 2012E. However, churn on satellite services is expected to offset this trend, pressuring revenues, which will grow at a marginal rate of 0,3% in 2012E. Nonetheless, we anticipate considerable operating cost reductions (-2,3% in 2012E and -1,8% in 2013E), providing EBITDA margins improvement.
The 30% participation on ZAP will be consolidated from 2012 on, ensuring future growth. ZAP’s revenues forecasts are encouraging, with an YoY growth of +110,2% in 2012E, +24,9% in 2013E and +20,3% in 2014E. Our ZAP’s valuation indicates an enterprise value of 156M€ (13,2x EV/EBITDA 2013E). Thus, ZAP’s contribution to ZON’s enterprise value is 47M€, from which we must deduct our 22M€ share on ZAP’s debt estimates. We estimated an upsurge of 3% in ZON’s share price resulting from ZAP’s consolidation, which is equivalent to an increase of 0,08€ per share.
ZONMULTIMEDIA COMPANY REPORT
THIS
DOCUMENT
IS
NOT
AN
INVESTMENT
RECOMMENDATION
AND
SHALL
BE
USED
EXCLUSIVELY
FOR
ACADEMIC
PURPOSES
(SEE DISCLOSURES AND DISCLAIMERS AT END OF DOCUMENT)PAGE 4/37
Valuation
DCF yields a 2,45Eur/Share Target Price
Our DCF valuation of ZON Multimedia implies a 2,45€ target price, representing a 20% potential upside from the stock current market price of 2,05€. Therefore, we recommend ZON Multimedia with a BUY.
We valued ZON Multimedia through a SOTP (Sum of the Parts) approach, using a DCF model for the different geographic business - Portugal and Angola – and the adding the 30% stake on the Angolan satellite operator (ZAP) to ZON’s enterprise value (please refer to the “Growth Opportunities” section to see further details of ZAP valuation). ZAP’s consolidation implied an increase of 0,08€/share.
ZON - Portugal
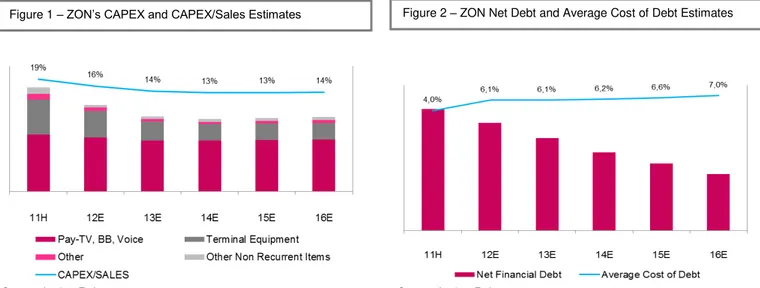
CAPEX’s Shrinkage: Network and STB Upgrades Finished
Further CAPEX reductions will be possible as 1) DOCSIS 3.0 technology implementation is concluded; 2) ZON’s own fibber primary network construction is finished; and 3) complete substitution of old STB by digital ones, with penetration of ZON HD set top boxes being high (66% of ZON’s digital costumers have HD set top boxes). 2011FY numbers illustrate this situation showing a 39,6% decrease in CAPEX. Our near term expectations are in line with ZON’s ones: we believe this declining trend will prevail over the next three years (we foresee CAPEX of 125M€ in 2012E). From our viewpoint, this declining trend will last until 2015E. Afterwards, we see growing CAPEX figures back, revealing the telecom sector’s nature (constant high levels of CAPEX are expected in technological dependent industries with fierce competition). Still, we expect Capex/Sales ratio1 to remain inbetween 13% and 15%.
Net Financial Debt & Average Cost of Debt
We considered ZON’s financial debt including LT contracts, and thus our estimates and historical values may not be in line with ZON’s estimates as the company considers financial debt excludes excluding LT contracts.
As free cash flow boosts, we anticipate a declining trend in Net Financial Debt figures, meaning ZON will be in a quite confortable balance sheet position over the next 5 years. Notwithstanding, we foresee an increase in the average cost of
1We only considered Pay-TV, Broadband and Voice Sales when calculating Capex/Sales since Capex is mainly driven by the Triple Play business.
ZON has a 20% upside potential - BUY
ZONMULTIMEDIA COMPANY REPORT
THIS
DOCUMENT
IS
NOT
AN
INVESTMENT
RECOMMENDATION
AND
SHALL
BE
USED
EXCLUSIVELY
FOR
ACADEMIC
PURPOSES
(SEE DISCLOSURES AND DISCLAIMERS AT END OF DOCUMENT)PAGE 5/37 debt2 given the increased country risk premium and a consequent difficult access to debt markets. We believe by 2016E ZON’s Net Financial Debt will be 390M€.
WACC & Growth Assumptions
Our DCF valuation entails a 9,5% WACC at which we discount our expected free cash flows. We reached a 8,6% cost of debt considering ZON’s probabilities of default and non-default, multiplied by the applicable recovery rate and yield (10%) respectively3. As for the cost of equity, we used the 10y German Bund as the risk free rate, adding it to the market premium (we assumed a market premium of 7%) and to the country risk premium (14,1%). The country risk premium was derived from the difference between the 10y Portuguese Government bond yield and the 10y German Bund bond yield. We then multiplied this differential by a volatility factor that expresses the relation between equity and bonds volatility. It is worthwhile to mention that we considered both market and country premiums are multiplied by the levered beta as, from our viewpoint, Portuguese companies are not equally exposed to the country risk premium. Bottom line, the implied cost of equity is 15,6%.
Concerning growth estimates, we believe ZON’s growth prospects are low. The Portuguese market is becoming saturated, a fact that allied with the severe competition in the industry pushes down ZON’s revenues progress. We estimate the perpetual growth rate to be 1,6%, slightly above expected inflation of 1,2%.
2
Cost of debt here is derived from the interests P&L.
3
The values for the probabilities of default and non-default can be found in a S&P’s study on “Default, Transition and Recovery: 2011 Annual Global Corporate Default Study and Rating Transitions”, from March 21, 2012. Data on recovery rates was gathered on a study realized by Moody’s: “Corporate Default and Recovery Rates: 1920-2010” from February 28, 2011. As for the yield, we benchmarked Portuguese companies’ yields, having PT’s bonds maturing in 2017 as a reference (9,5%).
Figure 1 –ZON’s CAPEX and CAPEX/Sales Estimates Figure 2 – ZON Net Debt and Average Cost of Debt Estimates
ZONMULTIMEDIA COMPANY REPORT
THIS
DOCUMENT
IS
NOT
AN
INVESTMENT
RECOMMENDATION
AND
SHALL
BE
USED
EXCLUSIVELY
FOR
ACADEMIC
PURPOSES
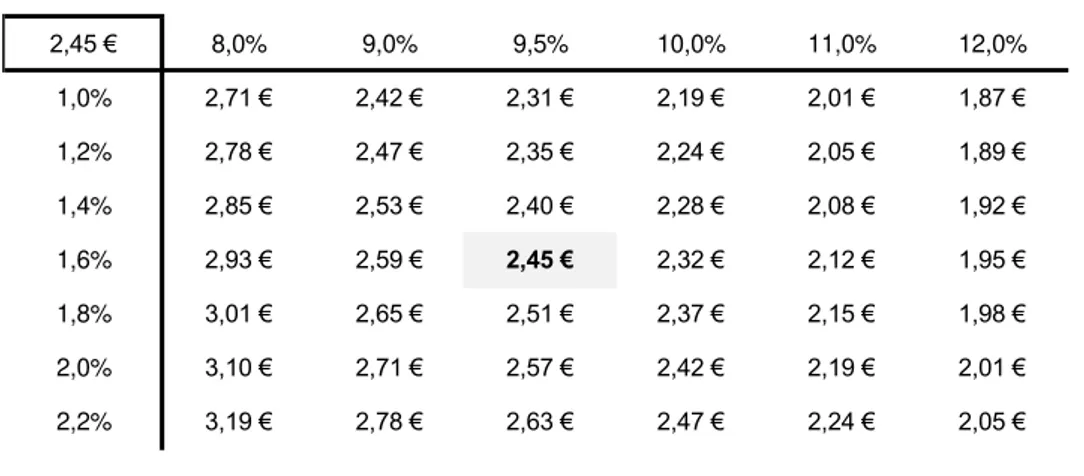
(SEE DISCLOSURES AND DISCLAIMERS AT END OF DOCUMENT)PAGE 6/37 At the end of the day, what one must bear in mind is that these are extremely influent parameters in a DCF valuation model - small changes deliver great impacts – and so, we found it crucial to carry a sensitivity analysis, presented below.
2,45 € 8,0% 9,0% 9,5% 10,0% 11,0% 12,0%
1,0% 2,71 € 2,42 € 2,31 € 2,19 € 2,01 € 1,87 € 1,2% 2,78 € 2,47 € 2,35 € 2,24 € 2,05 € 1,89 € 1,4% 2,85 € 2,53 € 2,40 € 2,28 € 2,08 € 1,92 € 1,6% 2,93 € 2,59 € 2,45 € 2,32 € 2,12 € 1,95 € 1,8% 3,01 € 2,65 € 2,51 € 2,37 € 2,15 € 1,98 € 2,0% 3,10 € 2,71 € 2,57 € 2,42 € 2,19 € 2,01 € 2,2% 3,19 € 2,78 € 2,63 € 2,47 € 2,24 € 2,05 €
Multiples Valuation: ZON trading at discount
ZON’s multiples are the lowest within its cable European peers. The poor performance on EV/Sales may be justified by limited growth prospects on the Portuguese mature market. Also, EV/EBITDA is way below the average as ZON EBITDA margin is lower (please refer to the “ZON vs European Comparables” section). Average EV/EBITDA weighted by current market cap is 7,3x, meaning the stock has a considerable discount. The extremely competitive landscape can also legitimate lower EV multiples.
EV/Sales EV/EBITDA EV/EBIT
Virgin Media 2,5x 6,2x 18,0x
Kabel Deutschland 3,8x 8,7x 29,3x
Telenet 4,1x 7,9x 17,1x
ZON 1,9x 5,2x 17,9x
Figure 4 – Multiples Analysis – ZON vs. Cable European Peers
Source: Bloomberg and Analyst Estimates
Figure 4 – WACC and Terminal Growth Sensitivity Analysis
ZONMULTIMEDIA COMPANY REPORT
THIS
DOCUMENT
IS
NOT
AN
INVESTMENT
RECOMMENDATION
AND
SHALL
BE
USED
EXCLUSIVELY
FOR
ACADEMIC
PURPOSES
(SEE DISCLOSURES AND DISCLAIMERS AT END OF DOCUMENT)PAGE 7/37
ZON Overview
ZON Multimedia is the leader Pay-TV operator in Portugal. Beyond Pay-TV services, ZON offers broadband internet and telephony, both fixed and mobile. The company operates its own cable system, a satellite platform and is a MVNO through Vodafone’s network. Cinema distribution and exhibition, as well as video production and sale of content rights, also integrate ZON’s activities.
Company description
ZON Multimedia is the leading cable operator in the Portuguese Pay-TV market. With an extensive cable network throughout Portugal, complemented by a satellite platform, ZON is the Portuguese historical leader and upholds this position even after its spin-off from Portugal Telecom in 2007 (prior to 2007 ZON was named PT Multimedia). As part of its triple play strategy, the company offers broadband internet and telephony (fixed and mobile) services. ZON has 3,15 million homes passed, covering 77% of the total residential households in Portugal.
All ZON’s cable network is upgraded to DOCSIS 3.0, enabling all households to have access to ZON current fastest internet offerings - 360Mbs and 100Mbs. Furthermore, the company has recently made an effort towards the completion of its fibber infrastructure. With its new FTTB4 architecture, ZON is in a comfortable position to upgrade any of its current services, be it more HD channels, higher capacity broadband or additional VoD5 solutions, under any degree of simultaneity.
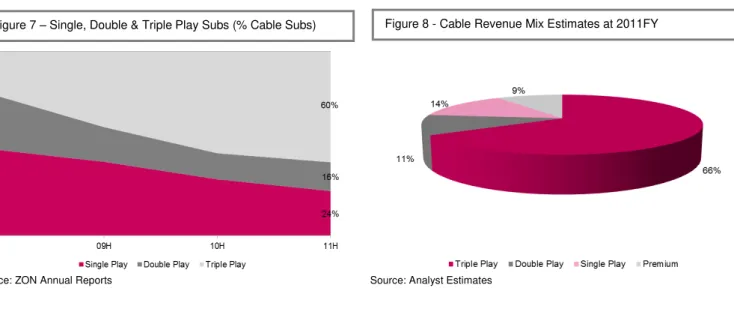
ZON’s top position in the triple play segment in Portugal, providing packages of Pay-TV, broadband and voice to more than 60% of its cable subscriber base, clearly illustrates the company’s aim to sell bundled services to most of its clients. From its 1567 thousand subscriber base, 1178 thousand are cable subscribers and only 389 thousand are DTH subscribers. Satellite subscribers have been diminishing, a trend that should continue given satellite technology’s incapacity to suit the company’s multiple play approach.
In addition to the triple play services, ZON also provides mobile solutions. With a late market entry, this business is, so far, not significant, having ended 2011 with
4
Fibber-to-the-building (FTTB) - Using fiber optics for telecommunications transport from the operator until the customer’s building (so a few meters from the final customer himself). The last meter is through cable.
5
Video on Demand
Zon’s homes passed: 3,15M,
77% of Portuguese residential HH
All cable network is updated with DOCSIS 3.0
60% of ZON’s cable subs are
3Play subs
ZON has:
ZONMULTIMEDIA COMPANY REPORT
THIS
DOCUMENT
IS
NOT
AN
INVESTMENT
RECOMMENDATION
AND
SHALL
BE
USED
EXCLUSIVELY
FOR
ACADEMIC
PURPOSES
(SEE DISCLOSURES AND DISCLAIMERS AT END OF DOCUMENT)PAGE 8/37
ZON is the 3Play market leader in Portugal with a 46% of Triple Play subscribers in Portugal belonging to ZON
only 125 thousand subscribers. ZON acts as a MVNO6 over Vodafone Portugal platform.
Triple Play Number One
ZON’s core business – the Pay-TV, Broadband and Fixed Voice business – represented 90% of total revenues in 2011FY. Cable revenues account for 75,6% of this value. Triple play bundles revenues are the most significant offer (according to our forecasts, in 2011FY, triple play solutions amounted to 424M€ vs. 772M€ of Pay-TV, Broadband and Voice revenues and 584M€ of cable revenues). This is a clear proof of ZON’s success in the conversion of Pay-TV subscribers into multiple play costumers, making it the number one triple player in Portugal. Premium revenues7 represented 9% of cable incomings.
6
MVNO – Mobile Virtual Network Operator is a mobile operator that offers wireless solutions and is not the owner of the network it is using for the purpose.
7
Here, we isolated premium revenues from the three possible offers, assuming 70% comes from triple play subs., 20% comes from double play subs. and 10% comes from single play subs. Over total revenues, premium incomings represent 7%.
Figure 5 – Single, Double & Triple Play Evolution (% Cable Subs) Figure 5 – Pay-TV, Broadband and Voice Revenue Mix 2011FY
Figure 7 – Single, Double & Triple Play Subs (% Cable Subs) Figure 8 - Cable Revenue Mix Estimates at 2011FY Figure 5 – ZON RGUs (3315 thousand) Breakdown in 2011FY Figure 6 –ZON Revenues (855M€) Breakdown in 2011 FY
Source: ZON 2011 Annual Report
Source: ZON Annual Reports Source: Analyst Estimates
ZONMULTIMEDIA COMPANY REPORT
THIS
DOCUMENT
IS
NOT
AN
INVESTMENT
RECOMMENDATION
AND
SHALL
BE
USED
EXCLUSIVELY
FOR
ACADEMIC
PURPOSES
(SEE DISCLOSURES AND DISCLAIMERS AT END OF DOCUMENT)PAGE 9/37 Nonetheless, penetration rates8 on the other two services are still below the average (23% of broadband penetration and 28% of fixed telephony penetration) when compared to its European peers, particularly regarding internet services, where Telenet and Virgin Media have a 46% and 32% penetration rate respectively. Such low penetration performance denounces ZON’s strategy of providing broadband and fixed telephony solutions only to its Pay-TV clients. With the increased importance of internet, a service with a demand growth well over Pay-TV, such strategy may prove to be inappropriate for the future. However, ZON claims that providing naked broadband services may cannibalize ZON’s Pay-TV business.
ZON has a relevant WiFi (ZON FON) coverage in areas where it has broadband subscribers although the advantage it takes from this asset is unclear.
ZON’s penetration in the mobile business is low, an uncomfortable situation towards its major competitor PT, especially with smart phones soaring ability to replace all other Internet access device.
Although the company major business is centred in Portugal, ZON entered, in 2010, the Angolan market through a joint venture with SOCIP – ZAP. ZAP is a satellite operator that provides competitive Pay-TV solutions in Angola. This represents, so far, the only international move for ZON, allowing it to explore business beyond the Portuguese mature market.
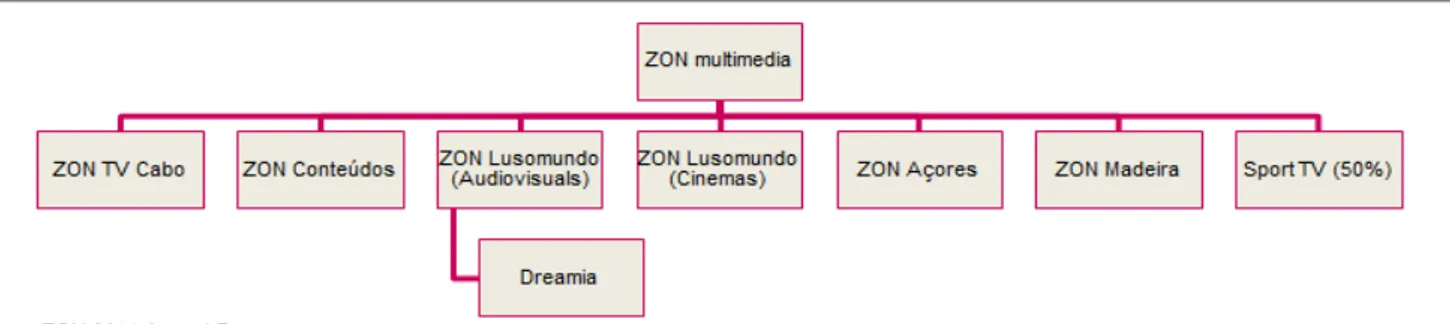
ZON Multimedia operates in the media and entertainment industry through its subsidiary ZON Lusomundo Cinemas, exhibiting and distributing cinema movies. With a total of 217 cinema rooms all over the country and revenues of 59M€ in 2011FY, it is the market leader in the field.
Moreover, ZON offers audiovisual solutions (ZON Lusomundo Audiovisuais), producing and selling videos, as well as selling and buying TV content rights. In 2011FY, revenues from the audiovisuals business amounted to 72M€. This area is strategic for ZON, providing the company with a competitive advantage on content acquisition and distribution. As so, ZON TV Cabo may enjoy easier access to movie contents distributed by ZON Lusomundo, can easily create competitive priced bundle offers with its produced channels, can influence the creation of relatively beneficial commercial conditions and also profit from distribution margins to its competitors. The same happens with ZON’s 50% stake
8
Penetration rate here is calculated to total homes passed.
Audiovisuals weight on Total Revenues is 8%.
ZONMULTIMEDIA COMPANY REPORT
THIS
DOCUMENT
IS
NOT
AN
INVESTMENT
RECOMMENDATION
AND
SHALL
BE
USED
EXCLUSIVELY
FOR
ACADEMIC
PURPOSES
(SEE DISCLOSURES AND DISCLAIMERS AT END OF DOCUMENT)PAGE 10/37 in Sport TV, a company that owns all major sports channels in Portugal, a valuable asset and also a potential competitive advantage.
ZON Lusomundo (cinemas and audiovisuals) contributed with 97M€ to total revenues in 2011FY – a decrease of 2,2pp when compared with 2010FY.
Among other participations, ZON owns a stake in Dreamia, a joint-venture with Chello Multicanal that aims to produce TV channels for children and series/movies TV channels.
Shareholder structure
ZON’s four main shareholders are the Angolan investor Isabel dos Santos, with a total 15,02% stake through Kento Holding Limited (10%) and Jadeium (5,02%); Caixa Geral de Depósitos (10,88%), a state-owned Portuguese bank; Banco BPI (7,55%), mainly owned by the Spanish La Caixa Group (Isabel dos Santos also controls 20% of BPI) and Group Espírito Santo, a private Portuguese group that owns a total of 12,66% of ZON’s share through its several subsidiaries.
Shareholders # of Shares %
Caix a Geral de Depósitos 33.621.426 10,88% Kento Holding Limited 30.909.683 10,00% Banco BPI, SA 23.344.798 7,55% Espírito Santo Irmãos, SGPS, SA 15.455.000 5,00% Jadeium, BV 15.200.427 5,02% Joaquim Alv es Ferreira de Oliv eira 14.955.684 4,84%
Fundação José Berardo 13.408.982 4,34% Banco Espírito Santo, SA 11.861.240 3,84%
Ongoing Strategy Inv estments, SGPS, SA 10.162.250 3,29%
Free Float 139.552.917 45,24%
Total Share Capital 308.472.407 100,00%
Isabel dos Santos is the major shareholder, directly
controlling 15,02%
Espírito Santo Group takes the second place with 12,66% (ESAF – 1,97%; BES Vida – 1,85%)
Figure 10 – ZON Multimedia Shareholder Structure (31st May, 2012) Figure 9 – ZON Multimedia Business Units and Participated Companies
Source: ZON 2011 Annual Report
ZONMULTIMEDIA COMPANY REPORT
THIS
DOCUMENT
IS
NOT
AN
INVESTMENT
RECOMMENDATION
AND
SHALL
BE
USED
EXCLUSIVELY
FOR
ACADEMIC
PURPOSES
(SEE DISCLOSURES AND DISCLAIMERS AT END OF DOCUMENT)PAGE 11/37 The end of limited voting rights
Recently, 93,3% of ZON’s shareholders approved to end the limit of 10% voting rights. This has drawn investors’ attention as it finally allows shareholders with more than 10% shares to exert their real voting power. Limitation on acquiring more than 10% remains for direct national competitors. These statutory changes made room for new shareholder entries and reinforced the speculative spectrum on a possible merger with a Portuguese player.
Isabel dos Santos was the first one stepping forward. The Angolan investor bought, on May 8, 2012, Telefonica’s 4,99% stake on the Portuguese cable operator. Later, on May 18, 2012, Dos Santos also purchased 0,102% of ZON’s total shares outstanding (315.000 shares at 2,304€ per share), becoming ZON’s major shareholder with a 15,02% stake.
As for now, no additional information on potential stock changes was released although we expect further moves:
Isabel dos Santos to increase its position to near control level (20-25%), leveraged by BPI stake (7,55%). She has been on a buying mode and as explained above is nurturing ZON’s expansion. Recent rumours on this matter point towards the acquisition of minority shareholders stakes.
Caixa Geral de Depósitos to sell its participation given Troika’s agreement on Bank non-financial assets: Portuguese banks under liquidity pressure must sell the assets that are not relevant for their core business.
Several other relevant equity holders to sell their positions (namely, BES) if share price improves or their own liquidity problems increase. We believe for most of them ZON stake does not have strategic fit.
Growth Opportunities
ZONMULTIMEDIA COMPANY REPORT
THIS
DOCUMENT
IS
NOT
AN
INVESTMENT
RECOMMENDATION
AND
SHALL
BE
USED
EXCLUSIVELY
FOR
ACADEMIC
PURPOSES
(SEE DISCLOSURES AND DISCLAIMERS AT END OF DOCUMENT)PAGE 12/37 The only relevant cable operator acquisition in Portugal is Cabovisão, a company recently bought by the French Group Altice (with cable operations in Europe). Cabovisão is going through a difficult period, experiencing negative net adds for a long time, but it still represents 8,6% of the Portuguese Pay-TV Market. We believe that if Altice was willing to sell, “Autoridade da Concorrência”, the Portuguese regulator for competitiveness, could oppose the deal. On top of this, Cabovisão would not change ZON’s capacities, just enlarge its market position, an acquisition with cost synergies but no true new business potential. Beyond this acquisition, in Portugal, the other alternative is to merge with a mobile operator. Merging with Sonaecom provides an interesting economic case. Nevertheless, in today´s terms, it will imply transferring the major shareholder position to Sonae SGPS, a situation so far opposed by ZON management and shareholders, and that we believe might be further delayed with Isabel dos Santos entry. The fact that Isabel dos Santos and Paulo de Azevedo (Sonae´s CEO) have a partnership in a consumer goods retail business in Angola may facilitate discussions. Yet, the solution to surpass the control issue is unclear. “Merging” with Vodafone would be, from a rational viewpoint, the best alternative. In fact, the combination of the Pay-TV market leader with the second largest mobile operator in Portugal, would result in a strong player, capable of facing the giant PT. However, this would really represent a sale, a possible option, similar to selling to an European cable operator that trades at higher ratios, but a solution we do not believe ZON major shareholders, namely Isabel dos Santos, are willing to consider at the moment.
Vodafone Group has been talking on eventual moves in the Pay-TV business. Besides, Vodafone Portugal has seldom served as a “market tester” for the group new launches. Thus, we believe if there is to be a relevant move into Pay TV from Vodafone, it would be in Portugal.
Additionally, one must bear in mind the fact that if a ZON/Sonaecom merger takes place, Vodafone Portugal would be left with the “weakest” residential offer, a situation that may pressure it into a pre-emptive move with ZON.
“True short term” growth solutions appear to lie on international expansion. ZAP so far is the only real endeavour. ZAP figures are hardly known, but the market data is promising.
ZONMULTIMEDIA COMPANY REPORT
THIS
DOCUMENT
IS
NOT
AN
INVESTMENT
RECOMMENDATION
AND
SHALL
BE
USED
EXCLUSIVELY
FOR
ACADEMIC
PURPOSES
(SEE DISCLOSURES AND DISCLAIMERS AT END OF DOCUMENT)PAGE 13/37 ZON/Sonaecom Merger
Sonaecom is Sonae´s telecom arm, a public company where Sonae is the major shareholder (53%) and France Telecom the second (20%) . It incorporates Optimus, the mobile operator, Clix, a fixed operator, the software company WeDo and the newspaper Público. Optimus and Clix are the relevant assets for the merger.
Sonaecom’s 2011FY turnover was 863,6M€ with an EBITDA of 82,5M€ and Net Income of 62,5M€. After a difficult adjustment period, Sonaecom is today on a more comfortable position, enjoying positive returns, fruit of sound management and tight cost control. In any case, the effects of the macroeconomic crisis are felt, with a diminishing customer base, especially in wire line.
Several reasons can be outlined to explain the rational between merging ZON and Sonaecom:
The new company would have access to a significant customer base – adding the 1,6 million homes of ZON to Optimus 3,6 million customers, allowing for ample cross selling opportunities
On the residential market the new company 4Play offer would be very competitive, only equalled by PT and in regions where PT has FTTH installed.
The new company would benefit from Sonaecom’s larger experience on PME/Corporate segment which would be boosted by ZON´s cable infrastructure coverage.
Replace the MVNO solution with a true mobile operation
Infrastructure optimization– the end of ZON’s partnership with Vodafone and the swap of Sonaecom’s leased lines to PT by ZON’s will represent significant cost savings.
Other cost synergies - traditional management and general administrative / legal / marketing / planning areas cost reductions, plus gains in distribution (retail presence unification) and some systems areas like billing.
ZONMULTIMEDIA COMPANY REPORT
THIS
DOCUMENT
IS
NOT
AN
INVESTMENT
RECOMMENDATION
AND
SHALL
BE
USED
EXCLUSIVELY
FOR
ACADEMIC
PURPOSES
(SEE DISCLOSURES AND DISCLAIMERS AT END OF DOCUMENT)PAGE 14/37
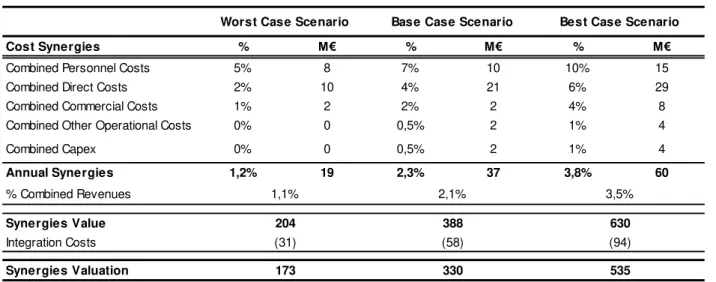
Cost Synergies % M€ % M€ % M€
Combined Personnel Costs 5% 8 7% 10 10% 15
Combined Direct Costs 2% 10 4% 21 6% 29
Combined Commercial Costs 1% 2 2% 2 4% 8
Combined Other Operational Costs 0% 0 0,5% 2 1% 4
Combined Capex 0% 0 0,5% 2 1% 4
Annual Synergies 1,2% 19 2,3% 37 3,8% 60
% Combined Revenues
Synergies Value
Integration Costs
Synergies Valuation 173 330 535
204 388 630
(31) (58) (94)
Best Case Scenario Base Case Scenario
Worst Case Scenario
1,1% 2,1% 3,5%
Under current shareholdings and considering both Sonaecom and ZON current market capitalization9, the resulting shareholder structure would have Sonae SGPS (21%) as the major shareholder and three others with considerable weight: Isabel dos Santos with 9%, France Telecom and ES Group with 8% each.
21%
8%
9%
6%
4% 8% 3%
3% 2% 36%
Sonae SGPS
France Telecom
Isabel Dos Santos (Jadeium + Kento)
CGD
BPI
ES Group (BES + BES Vida + ES Irmãos + ESAF)
Joaquim Alves Ferreira de Oliveira
Fundação José Berardo
Ongoing
Others + Free Float
9
Here, we weighted each company by its market value of equity (market cap) at 31st May, 2012: ZON –649M€ and Sonaecom –421M€. Figure 12 – ZON/Sonaecom New Shareholder Structure
Source: Analyst Estimates and Companies Annual Reports Source: Analyst Estimates
ZONMULTIMEDIA COMPANY REPORT
THIS
DOCUMENT
IS
NOT
AN
INVESTMENT
RECOMMENDATION
AND
SHALL
BE
USED
EXCLUSIVELY
FOR
ACADEMIC
PURPOSES
(SEE DISCLOSURES AND DISCLAIMERS AT END OF DOCUMENT)PAGE 15/37 ZAP Joint Venture
Angolan macroeconomic environment is back to its peak after the declining on oil prices that pushed the economy down. High GDP growth and developing middle class boosted demand for telecom services. ZON’s presence in Angola through the joint venture with Isabel dos Santos – ZAP (70% SOCIP and 30% ZON)– is taking advantage of angolan’s economy, which is expected to grow 8% in 2012FY. Notwithstanding, 72% of angolan population still leaves below the poverty line (less than $2 per day). In any case, the interest and willingness to offer telecom services to the 13,3 million inhabitants is clear, as also demonstrated by a partnership between the angolan Movicel and the giant chinese ZTE that aims to built a 4G network, ahead of many European countries. In last years’ June, ZAP lauched its services in Mozambique as well, a former portuguese colony with a population of 22,9 million and a GDP growth significantly high – 7,7%.
13,3%
2,4% 3,4%
8,0%
11,1%
6,8% 6,4% 7,2%
7,7%
7,9%
2008 2009 2010 2011 2012E
ANGOLA MOZAMBIQUE
13,7% 14,7%
11,7% 12,1%
3,5%
12,7%
9,2%
7,3%
2009 2010 2011 2012E
ANGOLA MOZAMBIQUE
Estimates on the number of angolan houses are dubious. We believe there are inbetween 3,5 and 4,0 million households in this country. 10% of those – around 390 thousand houses – subscribe Pay-TV services either to ZON or to its main competitor DSTV (owned by Multichoice, a South Africa company).
ZAP Services
ZAP is a satellite Pay-TV provider operating in Angola and Mozambique since 2010 and 2011 respectively. Currently, ZAP offers its clients 3 channel packages: 1) “ZAP Mini”, with 40 channels for 15USD, 2)”ZAP Max”, with around 90 channels for 30USD and 3)”ZAP Premium” with more than 110 channels for 60USD (12 HD channels). The company offer seems to be well differentiated, being characterized by a strong Portuguese speaking channels offer and a broad range of international channels, namely MTV Base, Fox, Fox Life, National Figure 13 – Angola and Mozambique GDP Growth (%) Figure 14 – Angola and Mozambique Inflation Rate (%)
ZONMULTIMEDIA COMPANY REPORT
THIS
DOCUMENT
IS
NOT
AN
INVESTMENT
RECOMMENDATION
AND
SHALL
BE
USED
EXCLUSIVELY
FOR
ACADEMIC
PURPOSES
(SEE DISCLOSURES AND DISCLAIMERS AT END OF DOCUMENT)PAGE 16/37 Geographic and National Geographic Wild. Sport TV Africa, a channel that exclusively transmits all football games from the Portuguese League, also constitutes a competitive advantage for ZAP. On top of this, ZAP produces its own channel of soap operas, specially created for the Angolan people - ZAP Novelas - which the company claims has been a success.
ZAP has 10 own stores in Angola, 430 authorized agents and a sales force door-to-door with 200 people. In Mozambique, the company has 3 own stores and 60 authorized agents. In both markets, ZON counts with a total of 280 employees. Providing Pay-TV services through satellite instead of building a cable network in Angola allowed for smaller upfront investments and, at the same time, provided ZAP with higher and instantaneous coverage. Besides, given ZAP and the other South African operators use a common satellite, a new entrant like ZAP can churn competitor subscribers just by connecting its ZAP box to the already existing antenna.
On top of this, ZAP business model has low credit risk: set to boxes are sold to the clients and services are pre-paid, conversely to what is done in Portugal. ZAP Valuation
ZON’s 30% stake on ZAP has been consolidated for the first time in the 2012 1Q, meaning from now on the potential growth of the Angolan operator will be taken into account in ZON’s valuation. Thus, we found it crucial to value ZAP through a DCF model.
ZON expects ZAP to breakeven in 2012FY, a reality that seems to be closer after the first quarter report disclosure that confirms ZAP had revenues of 21,3M€ and that, despite all subscribers acquisition costs, ZAP reached breakeven in terms of EBITDA.
ZONMULTIMEDIA COMPANY REPORT
THIS
DOCUMENT
IS
NOT
AN
INVESTMENT
RECOMMENDATION
AND
SHALL
BE
USED
EXCLUSIVELY
FOR
ACADEMIC
PURPOSES
(SEE DISCLOSURES AND DISCLAIMERS AT END OF DOCUMENT)PAGE 17/37
10% 15%
18% 21% 23%
25%
11H 12E 13E 14E 15E 16E
Pay-TV Penetration Rate in Angola
200
315
394
474 530
588 51,3% 53,8%
56,0% 57,7% 58,8%
60,0%
11H 12E 13E 14E 15E 16E
T
ho
us
an
d
S
ub
s
c
ri
be
rs
ZAP Subscribers ZAP Market Share
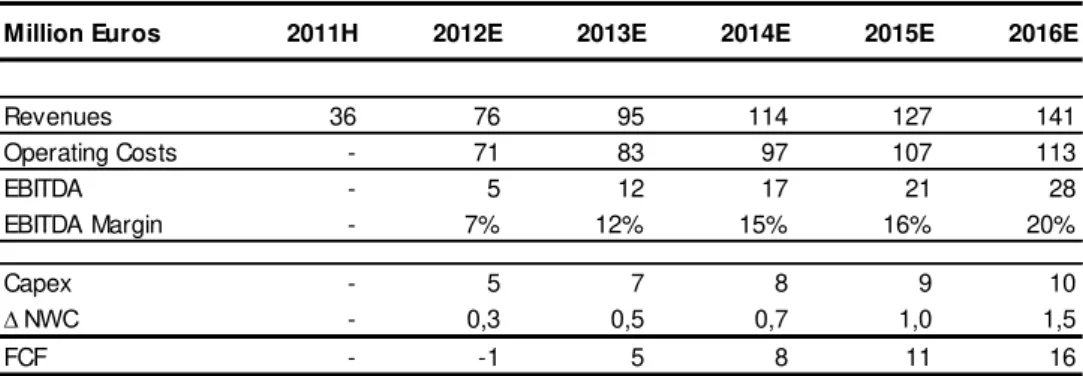
Revenues coming from the Angolan business are estimated to grow at an abnormal fast pace: 110% in 2012E, 25% in 2013E, 20% in 2014E and 12% and 11% in the two remaining years. We believe ARPU is within 20€ and 23€ (ZON’s management points towards a $28 ARPU) and we expect a slight decrease YoY. We expected a slightly positive EBITDA margin in 2012E – 10%, assuming ZON’s estimates - which will increase up to 20% in 2016E.
As previously mentioned, we believe the relevant investments are part of ZAP’s past. Therefore, we expect low levels of CAPEX: we assumed 7% of ZAP’s revenues (please see Figure 17).
Million Euros 2011H 2012E 2013E 2014E 2015E 2016E
Revenues 36 76 95 114 127 141
Operating Costs - 71 83 97 107 113
EBITDA - 5 12 17 21 28
EBITDA Margin - 7% 12% 15% 16% 20%
Capex - 5 7 8 9 10
∆ NWC - 0,3 0,5 0,7 1,0 1,5
FCF - -1 5 8 11 16
As for WACC we used a 7% pre-tax10 cost of debt, reflecting the spread of LT issuances over the 10y German Bund, and a 21,6% cost of equity. The latter was calculated adding to the 1,68% risk free rate11, the market premium (7%) and the
10
Angolan corporate tax rate is 35%.
11
We considered the 10y German Bund as the risk free rate.
Figure 15 – Estimated Pay-TV Penetration Rate in Angola Figure 16 – ZAP Subscribers & Market Share Estimates
Figure 17 –ZAP’s Main Valuation Drivers Estimates
Source: Analyst Estimates
ZONMULTIMEDIA COMPANY REPORT
THIS
DOCUMENT
IS
NOT
AN
INVESTMENT
RECOMMENDATION
AND
SHALL
BE
USED
EXCLUSIVELY
FOR
ACADEMIC
PURPOSES
(SEE DISCLOSURES AND DISCLAIMERS AT END OF DOCUMENT)PAGE 18/37 country risk premium, both multiplied by the levered beta (0,734)12. We applied a multiple to Portugal risk premium, reaching a 16,9% country risk premium for Angola. Finally, we assumed ZAP’s leverage to be 35%, in line with ZON’s guidance. Bottom line, we applied a 14,1% WACC.
Our ZAP valuation implies an enterprise value of 156M€, meaning the contribution to ZON’s EV is 47M€, not taking into account debt deductions (please refer to Appendix – Financial Forecasts, ZAP DCF).
ZON vs European Comparables
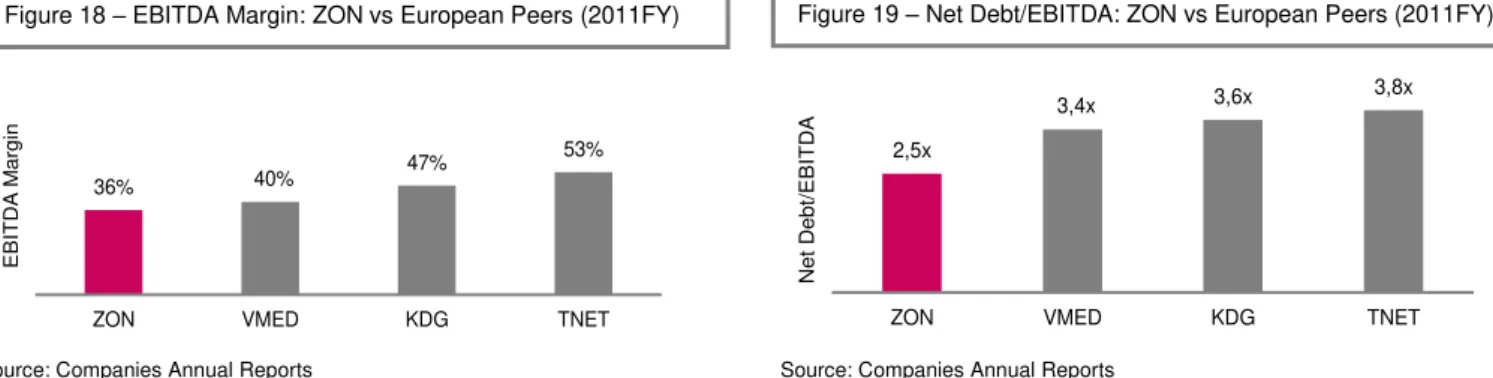
ZON has a low EBITDA margin (36% in 2011FY) when compared to its European peer group (please refer to Figure 18). Even if we account for the impact of a low EBITDA margin in the media segment and in the satellite business, even if we take into consideration the higher premium weight on total revenues than its peers (premium business typically has margins between 10% and 20%), ZON still has a poor performance regarding its EBITDA margin, a sign for cost reduction pressure in Portugal (as explained below in “Financial Forecasts”). When comparing ZON’s margins with Telenet’s ones (a significant difference of 17pp – please see graph below left), one must bear in mind the fact that ZON operates both through a cable and a satellite platform (an additional cost burden), conversely to what its Belgian peer does (Telenet only has cable network). On the other hand, ZON’s is the less leveraged of its European peers: in 2011FY ZON had a 2,5x Net Debt/EBITDA ratio that when compared to its European Peers is significantly below the average (please see Figure 19).
36% 40%
47% 53%
ZON VMED KDG TNET
E
B
ITD
A
M
a
rg
in
2,5x
3,4x 3,6x 3,8x
ZON VMED KDG TNET
N
e
t
D
e
b
t/
E
B
ITD
A
12
Levered beta for ZON was obtained calculating the average beta of 8 African telecom and media companies, including ZAP’s major competitor Multichoice.
Figure 18 – EBITDA Margin: ZON vs European Peers (2011FY) Figure 19 – Net Debt/EBITDA: ZON vs European Peers (2011FY)
ZONMULTIMEDIA COMPANY REPORT
THIS
DOCUMENT
IS
NOT
AN
INVESTMENT
RECOMMENDATION
AND
SHALL
BE
USED
EXCLUSIVELY
FOR
ACADEMIC
PURPOSES
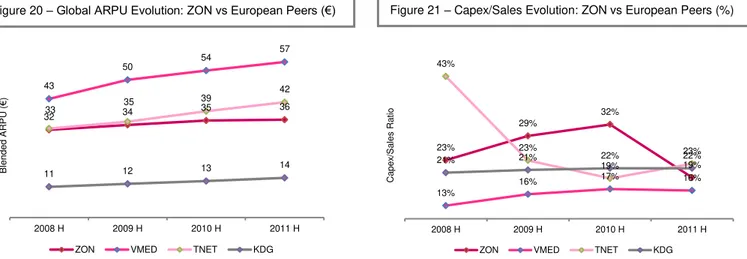
(SEE DISCLOSURES AND DISCLAIMERS AT END OF DOCUMENT)PAGE 19/37 Regarding the average revenue per user, ZON has the second lowest ARPU, being Kabel Deutschland the European operator in the worst position (see Figure 20). ZON has historically been in line with its peer Virgin Media, although in the last 2 years the latest over performed ZON. We believe this can be justified by two main facts: 1) the competitive landscape in Portugal is rougher than in the UK; 2) the average GDP per capita is higher in the UK, a fact that turned out to be more obvious with the current European economic turmoil. In this comparison we need to bear in mind that Kabel Deutschland has a different business model, only providing access services, not content, a situation that justifies its lower ARPU.
32 34 35
36 43
50 54
57
33 35
39 42
11 12 13 14
2008 H 2009 H 2010 H 2011 H
B len d e d A R P U ( € )
ZON VMED TNET KDG
23% 29% 32% 19% 13%
16% 17% 16%
43%
23%
19%
23%
21% 21% 22% 22%
2008 H 2009 H 2010 H 2011 H
C a p e x/ S a les R a tio
ZON VMED TNET KDG
As already mentioned, ZON’s CAPEX decreased significantly last year reflecting the end of network and STB upgrades. Consequently, CAPEX/Sales13 ratio also diminished sharply, from 32% in 2010FY to 19% in 2011FY. 2010 was clearly an extraordinary investment year, which we do not expect to be repeated. Notice that we considered this ratio on Pay-TV, Broadband and Voice revenues, not only because CAPEX is largely related to this business, but also in order to allow a coherent comparative analysis. When comparing to its European peers, ZON’s CAPEX/Sales was extraordinarily above the average in 2009FY and 2010FY, but we believe it returned to fairly reasonable levels in 2011FY (in this year, VMED CAPEX/Sales was 16%, TNET’s one was 23% and KDG’s was 22%).
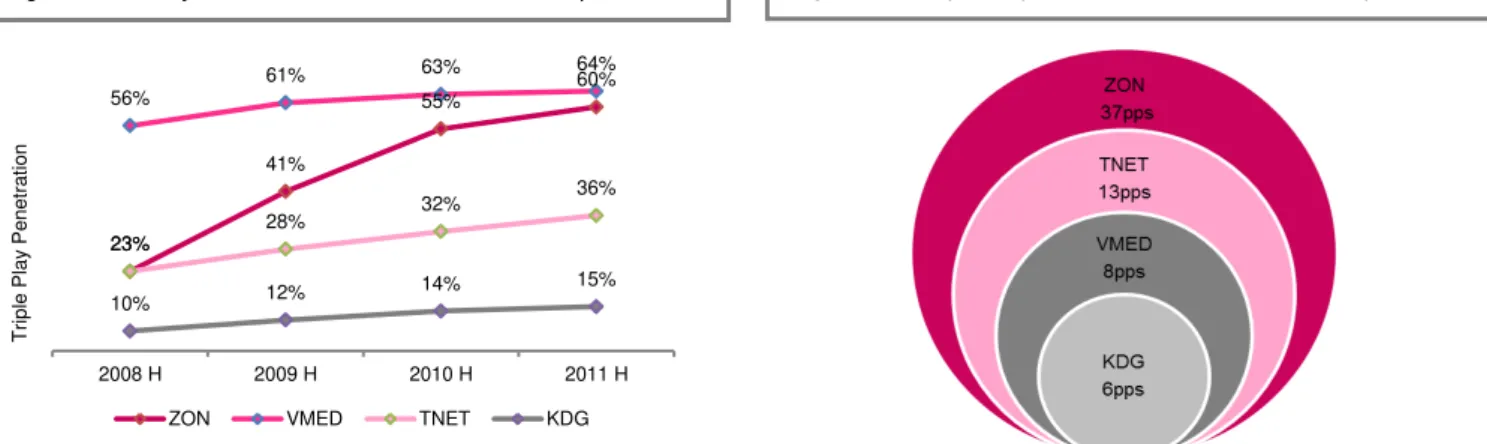
ZON’s penetration of bundled offers grew at an extremely fast pace, particularly the triple play segment. Today, ZON is the second operator within its peers, with the largest triple play penetration rate. Virgin Media takes the first place with 64%
Source: Companies Annual Reports Source: Companies Annual Reports
ZONMULTIMEDIA COMPANY REPORT
THIS
DOCUMENT
IS
NOT
AN
INVESTMENT
RECOMMENDATION
AND
SHALL
BE
USED
EXCLUSIVELY
FOR
ACADEMIC
PURPOSES
(SEE DISCLOSURES AND DISCLAIMERS AT END OF DOCUMENT)PAGE 20/37 of its cable subscribers base enjoying three different services. Here again, Kabel Deutschland figures should not be compared as the company does not market a triple play offer (the German operator offer bundles with internet and phone or bundles with basic cable access and Premium TV services). Historical evolution points towards an continued increase in triple play demand, but at a slower pace.
23%
41%
55%
60% 56%
61% 63% 64%
23%
28% 32%
36%
10% 12% 14%
15%
2008 H 2009 H 2010 H 2011 H
Tr
iple
P
lay
P
e
n
e
tr
a
tion
ZON VMED TNET KDG
Macroeconomic Outlook
The european debt crisis along with the overall deteorated global macroeconomic environment have thrown Portugal into a critical position. In 2011 portuguese public deficit was 6,9% of GDP and the expected GDP growth for 2012FY and 2013 FY is -3% and 0,3% respectively. The possible need for further international monetary aid, as well as the uncertain future of Greece within the Eurozone, has been disturbing markets. Refinancing uncertainty prevails.
On top of this, there are still pressures from international forces towards additional austerity measures in Portugal. The portuguese annual inflation augmented to 5,49% in 2011FY (+3,69pp than in 2010FY) and the forecasts indicate further upside moves. Nonetheless, the market has been giving soft recovery signs: the yields on the portuguese government bonds felt slightly in the 2012 1Q (please see Figure 24 on the left).
2011H 2012E 2013E 2014E 2015E 2016E
Infation 3,7% 3,2% 1,3% 1,1% 1,2% 1,2%
GDP Grow th -1,6% -3,0% 0,6% 2,0% 2,4% 2,8%
Figure 22 – 3Play Penetration Evolution: ZON vs European Peers Figure 23 – Triple Play Growth since 08: ZON vs European Peers
6 8 10 12 14 16 18 20 22 24
2 years 5 years 10 years
Figure 25 – Infation and GDP Growth Estimates for Portugal Figure 24 – Yields on PT Government Bonds
Source: INE and Portuguese Ministry of Finance Source: Bloomberg
Figure 24 – Yields on PT Government Bonds
Source: Bloomberg
ZONMULTIMEDIA COMPANY REPORT
THIS
DOCUMENT
IS
NOT
AN
INVESTMENT
RECOMMENDATION
AND
SHALL
BE
USED
EXCLUSIVELY
FOR
ACADEMIC
PURPOSES
(SEE DISCLOSURES AND DISCLAIMERS AT END OF DOCUMENT)PAGE 21/37 The economic downturn that Portugal is facing, agravated by recent rumours on Greece abandoning the euro, interferes with ZON’s business in several ways: On the revenues side:
Portuguese families’ monthly income is under pressure due to higher income and consumer taxes (fall on IRS deductions and VAT tax increase) imposed by the austerity packages agreed with the IMF, the ECB and the EC. The average monthly income of all families decreased 3% in 2011FY (please refer to Figure 26 on the left). Yet, if there is no Greek/European rupture, this should not translate into a relevant churn increase on basic services (we believe ZON’s services are fairly resilient), but instead into lower ARPUs. Income shrinkage is being translated into a sharp decrease on premium services.
On the costs side:
Yields on debt loans revealed an upward trend, reflecting the consecutive downgrades of Portugal (please see Figure 27 on the left), as well as the downgrades of all rated portuguese companies (ZON is not rated, still it is negatively affected). Debt burden will increase and access to external financing will be limited.
Eurozone’s Future
The Euro’s sustainability has been questioned over the last year, since debt crisis has been installed in Europe. Many European countries have been living beyond its means, and now deficits and sovereign debt indicators are alarming. The uncertainty of the future of the monetary union prevails, with arguments in favour and against appealing the less attractive countries to leave. Greece is one of those. Greece has been overspending even before it implemented the single currency (please see Figure 28 on the left).
By the time the world financial downturn hit, Greek debt levels soared and the country had to be rescued by the ECB, the EC and the IMF. Meanwhile, Greek parties failed to agree in following the austerity politic suggested by the EU and the IMF. Today, all eyes are on next Greek elections, as they will decide Eurozone’s future: if the anti-austerity parties win, attempts on loans renegotiation or even on loans repayments being freezed may worsen confidence on Eurozone, and Greece may be forced to leave the single currency. If this happens, a risky precedent will have been stablished. After the Greek exit, Figure 27 - Moody’s Downgrades to Portugal
Source: Moody’s
Figure 26 – Portuguese Families Average Monthly Income (thousand €)
Source: Poordata
Figure 28 – Greece Revenue/Expenditure (%GDP)
ZONMULTIMEDIA COMPANY REPORT
THIS
DOCUMENT
IS
NOT
AN
INVESTMENT
RECOMMENDATION
AND
SHALL
BE
USED
EXCLUSIVELY
FOR
ACADEMIC
PURPOSES
(SEE DISCLOSURES AND DISCLAIMERS AT END OF DOCUMENT)PAGE 22/37 many point Portugal as the next target, also thanks to overspending and high debt levels.
In order to have a perpective on this situation we built a scenario analysis, in which in the first scenario we considered Greece leaving the Euro, and in the second one we analysed a possible contagion effect to Portugal.
Greek Exit
A Greek exit would immediately devaluate the reintroduced Drachma. Although there are no exact estimates on quantifying this devaluation, historical similar happenings may serve as a guidance: when Argentina decided to abbandon the dollar and readopt the Peso, it suffered from a 75% depreciation. Thus, bearing in mind the differences between Greece and Argentina, we still believe depreciation around 70% will occur, making it even harder for Greece to repay its debt obligations. Besides, such circuntances would lead to massive banks withdrawals as people would try to keep their money in Euros.
Setting current conditions as a base case, we assume Greece will leave the Euro in January 2013. Immediate consequences on other European countries would be felt: yields on sovereign bonds would climb significantly and the single currency would devaluate. Portugal would be specially penalized: country risk would increase significantly (spreads of portuguese treasury bonds over german bunds would soar) and consumption woul be down by 5%. Yet, we believe the main downside for Portugal would be the risk of being contamined. Therefore, we decided to scrutinyze this hypothesis.
Portuguese Exit
For the portuguese case, we assumed the country would only leave the Euro by the end of 2013. Similar effects to the greek case are expected: the return to the old currency – Escudos – would also imply a significant devaluation (again, we assumed 75%) and the drop 0on consumption would be even higher (10%), in line with the decline on GDP. Again, historical marks may be recalled as a benchmark: the default of Argentina in 2002 and the Russian financial crisis in 1998 resulted both in a substantial fall in GDP growth (-10,9% and -12,7% respectively – please see Figure 29 on the left). As so, we estimated Portuguese GDP to decline 12% if Portugal exits the Eurozone.
Impact on ZON
In case Greece leaves the Euro, we assumed ZON’s revenues would go down, as fear would prevail upon confidence, meaning capital outflows will occur, -15
-10 -5 0 5 10 15
1993 1997 2001 2005 2009 2013
Argentina Russia
Figure 29 – Argentine and Russian GDP Growth
ZONMULTIMEDIA COMPANY REPORT
THIS
DOCUMENT
IS
NOT
AN
INVESTMENT
RECOMMENDATION
AND
SHALL
BE
USED
EXCLUSIVELY
FOR
ACADEMIC
PURPOSES
(SEE DISCLOSURES AND DISCLAIMERS AT END OF DOCUMENT)PAGE 23/37 families would withdrawal their money from the banks, and even higher unemployment rates would be verified in Portugal. Overall, consumption would suffer. As for costs, we assumed they would continue to represent the same percentage of revenues. Main changes would occur in ZON’s yield, which we assumed to climb to 15%. Besides, country risk premium would naturally boost, with probabilities of Portugal being the next one to leave the Euro, increasing. If such probability turns into a reality, Portugal would leave the single currency as well. The impacts referred in the Greek case would be even worse, with GDP falling -11,8% in 2013E, while ZON’s revenues would decline 10%. At the same time, the expected devaluation of the portuguese old currency – escudos – would be reflected in higher content costs, as many TV contents and channels come from foreign countries and, therefore, ZON would have to pay more for them. The same would happen to CAPEX, were STB upgrades may turn out to be more expensive. Similar to the first scenario, ZON’s weighted average cost of capital would change drastically. Country risk premium would be near 100% while ZON’s yield would jump 1,5%.
Bottom line, we reached a price target of 1,47€ for ZON’s share. It is at most importance to highlight that a probability of 55% was given to our base case scenario, while we believe Greece’s exit is fairly possible (we attributed to this scenatio a probability of 40%). Concerning the portuguese case, we think Europe as a whole will join forces to stop a possible contagion effect. Moreover, Portugal leaving the Euro would probably mean Spain would have to do the same. Therefore, in our opinion, this scenario is quite unlikely to happen – we gave the second scenario (Portuguese exit) a probability of 5% (please refere to Appendix – “Scenario Analysis” to further details).
Competitors
In Portugal, there are 5 main players in the telecom industry: Portugal Telecom (PT/TMN), the former incumbent, two cable operators, ZON Multimedia and Cabovisão (owned by Altice), and the two remainder mobile operators: Vodafone Portugal and Optimus / Sonaecom (Sonae’s telecom subsidiary).
PT head to head
ZONMULTIMEDIA COMPANY REPORT
THIS
DOCUMENT
IS
NOT
AN
INVESTMENT
RECOMMENDATION
AND
SHALL
BE
USED
EXCLUSIVELY
FOR
ACADEMIC
PURPOSES
(SEE DISCLOSURES AND DISCLAIMERS AT END OF DOCUMENT)PAGE 24/37 strong mobile arm (TMN - 44% market share in 2010FY). PT has made significant inroads into the Pay TV market, achieving 36% market share in 5 years. PT has declared its objective to become number one in this segment and seems to take it very seriously. Five years ago, after ZON spin off from PT, there were some doubts about the competition level that would arise between the two players, namely given some relevant shareholders commonality. Doubts have disappeared as competition became fierce. Both companies have strong stances, but one cannot forget PT stronger balance sheet, allowing it to endure, if necessary, short term difficulties on a “marginal” business, to ensure long term benefits.
PT has invested heavily beyond its copper plant, having a relevant FTTH infrastructure in major cities (1,6 million houses vs. ZON’s 3,2 million houses with HFC14). Claims on the superiority of this architecture over ZON’s FTTB abound, but in practical terms no real difference is felt by the final consumer under current services capacity needs. In areas where it doesn’t have fibre, PT has a weaker position, defending its offer through DTH (satellite) for Pay-TV services and ADSL for broadband and voice services.
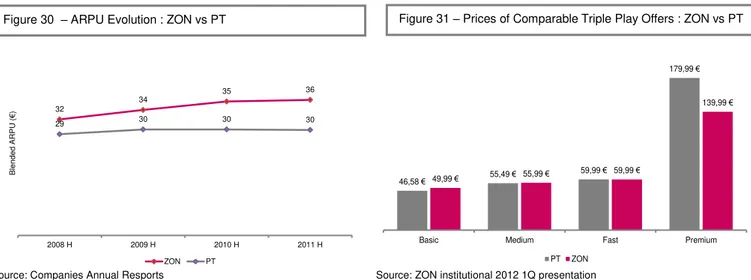
ZON’s ARPU is slightly higher than PT’s one (on average 10%-15% higher). We analysed PT’s fixed business ARPU since we believe it is the best proxy. However, the average revenues per user presented in Figure 28 are not directly comparable as PT’s one should be fuelled by proceeds on its mobile business, which is quite relevant. Therefore, PT’s blended ARPU (which the company does not disclose) shall be in the same levels as ZON’s blended ARPU.
32
34 35
36
29 30 30 30
2008 H 2009 H 2010 H 2011 H
Bl
e
n
d
e
d
ARPU
(
€
)
ZON PT
46,58 € 55,49 € 59,99 €
179,99 €
49,99 € 55,99 € 59,99 €
139,99 €
Basic Medium Fast Premium PT ZON
14HFC means Hybrid Fibre-Coaxial, a network that combines optical fiber with coaxial cable.
Figure 30 – ARPU Evolution : ZON vs PT Figure 31 – Prices of Comparable Triple Play Offers : ZON vs PT
ZONMULTIMEDIA COMPANY REPORT
THIS
DOCUMENT
IS
NOT
AN
INVESTMENT
RECOMMENDATION
AND
SHALL
BE
USED
EXCLUSIVELY
FOR
ACADEMIC
PURPOSES
(SEE DISCLOSURES AND DISCLAIMERS AT END OF DOCUMENT)PAGE 25/37 Market prices of comparable triple play offers match, revealing the direct competition between ZON and PT. Both operators provide solutions that are extremely close, either in their price or in the bundle contents (please see Figure 31 above left). We considered 4 different types of packages that included almost the same services, but we excluded eventual promotions. Main differences consist in internet speeds - in all packages analysed, ZON offers 100Mbs while in the basic and medium ones, PT delivers a 15Mbps and 30Mbps internet respectively.
On a Different Game
Cabovisão is the “second” cable operator (8% market share) but a distant competitor to ZON; a company historically with a good position on the south region of Lisbon, that has been losing its market position over the years, incapable of doing the required investments to remain competitive.
Vodafone and Optimus are mainly mobile operators. Although both players have made inroads into the Pay-TV and wireline business, their stakes in the residential market lie in the mobile business, creating no threat to ZON´s position.
Figure 32 – Pay-TV Market Shares in Portugal – 2011FY Figure 33 – Fixed Voice Market Shares in Portugal – 2011FY
Figure 34 – Fixed BB Market Shares in Portugal – 2011FY Figure 35 – Mobile Phone Market Shares in Portugal – 2010FY
Source: ANACOM Source: ANACOM
ZONMULTIMEDIA COMPANY REPORT
THIS
DOCUMENT
IS
NOT
AN
INVESTMENT
RECOMMENDATION
AND
SHALL
BE
USED
EXCLUSIVELY
FOR
ACADEMIC
PURPOSES
(SEE DISCLOSURES AND DISCLAIMERS AT END OF DOCUMENT)PAGE 26/37 Analogue TV Switch-Off: 1,2 to 1,5 million New Potential Subscribers
The Portuguese analogue television switch-off brought new potential customers for all players in the Pay-TV market. According to ANACOM, only 8% of the Portuguese families that still had analogue TV do not plan to change to Pay-TV. However, current analogue users are likely to be low income country families, so we do not expect a large change in ZON’s key figures. We believe ZON’s cable subscribers will augment by a small percentage – 0,4% (from 1178 thousand subs in 2011 to 1183 thousand subs in 2012E), mainly reflecting: 1) the churn on satellite subscribers (following last years’ decreasing trend) and 2) the positive adds on the low price package ZON created to capture this families’ attention (a 9,99€ double play package).
Media & Entertainment Activities
The last data made available by the Portuguese Institute of Cinemas and Audiovisuals (ICA) reveals that ZON is the unquestionable leading player in the cinema exhibition market (ZON had a 54,6% revenues market share in 2010FY), with the greater number of cinema rooms. Besides, ZON assumes the vanguard of the 3D projection technology, having updated 40% of its cinema rooms. Likewise, the company, through its subsidiary ZON Lusomundo Audiovisuals, is the leader in cinema distribution, with a market share of 51,8% in 2010. Notwithstanding, media activities have a minor contribute to ZON’s operational performance.
We believe the increase of internet usage and the launch of online platforms providing either free or cheap access to movies contents (e.g. Netflix, Hulu) may negatively affect ZON Lusomundo Audiovisuais business.
Figure 36 – Cinema Exhibition Market Shares – 2010FY Figure 37 – Cinema Distribution Market Shares – 2011FY