*e-mail: [email protected]
1. Introduction
According to Scripps of Oceanography Institute, from San Diego University, where the Mauna Loa station is monitored, the average concentration of CO2 in Hawaii in April of 2014 was 401.33 ppm. For the irst time in human history, the concentration of CO2 in the atmosphere remained above 400 ppm during a whole month. The concentration of CO2 at the start of the industrialization period was around 280 ppm, according to the Intergovernamental Panel on Climate Change (IPCC). The new report from IPCC, from April 2014 shows that the emissions of gases from the greenhouse effect increased to unprecedented levels, despite of a series of policies to mitigate them. The emissions between 2000 and 2010 grew faster than during the previous three decades1.
To decrease the environmental impact from intensiied emission of CO2, it is necessary to developmore eficient removal technologies. A promising approach to reduce CO2 emission is the capture and geological storage of Carbon (CCS)2. CO
2 can be captured by pre-combustion, post-combustion or oxyfuel techniques3 by capture processes including absorption, adsorption, hybrid processes such as adsorption/membrane system or cryogenic distillation. Nowadays, among a diversity of technologies to capture CO2, adsorption has been vastly applied in many industrial processes including the production of synthesis gas and hydrogen with high contents of CO2. Physical adsorption is a compelling technology applied to CO2 due to the use of low-cost adsorbents that exhibits low heat capacity, fast kinetics, high CO2 adsorption capacity in addition to thermal,
Synthesis Optimization of MCM-41 for CO
2Adsorption Using Simplex-centroid Design
Cíntia de Castro Costaa*, Dulce Maria de Araújo Melob, Antonio Eduardo Martinellic,
Marcus Antônio de Freitas Melod, Rodolfo Luiz Bezerra de Araújo Medeirose,
João Andrade Marconid, Joana Maria de Farias Barrosf
aPost-Graduation Programs in Petroleum Science – PPGCEP, Universidade Federal
do Rio Grande do Norte – UFRN, CEP 59072-970, Natal, RN, Brazil
bChemical Institute, Universidade Federal do Rio Grande do Norte – UFRN,
CEP 59072-970, Natal, RN, Brazil
cDepartment of Materials Engineering, Universidade Federal do Rio Grande do Norte – UFRN,
CEP 59072-970, Natal, RN, Brazil
dDepartment of Chemical Engineering, Universidade Federal do Rio Grande do Norte – UFRN,
CEP 59072-970, Natal, RN, Brazil
ePost-Graduation Programs in Materials Science and Engineering – PPGCEM, Universidade Federal
do Rio Grande do Norte – UFRN, CEP 59072-970, Natal, RN, Brazil
fCentro de Educação e Saúde, Universidade Federal de Campina Grande - UFCG,
CEP 58175-000, Cuité, PB, Brazil
Received: March 21, 2015; Revised: August 10, 2015
There is a growing concern on the relationship between anthropogenic carbon dioxide and climate changes. A promising approach is the adsorption technology using mesoporous MCM-41 materials that can be easily synthesized to depict structures adequate to the low of gas. The aim of this study was to improve the synthesis of MCM-41 using cationic surfactant mixtures and apply the resulting materials to CO2 adsorption. To that end, the simplex-centroid design was applied to optimize CO2 adsorption from seven mesoporous MCM-41 materials synthesized by the hydrothermal method using surfactants from hydrophobic chains of different sizes. The cationic surfactants used were tetradecyltrimetylammonium bromide, cetyltrimethylammonium bromide, trimethyloctadecylammonium bromide and their mixture at ratios of 1:1 and 1:1:1. The CO2 adsorption was investigated using thegravimetric method at 298 K and pressures up to 40 bar. The resulting materials, labelled C17, C19, C21, C17C19, C19C21, C17C21 and C17C19C21, were characterized by XRD, FTIR, TG and SEM and showed signiicant differences in structure as well as in the mass of CO2 adsorption. The response models showed that the best combination of the surfactants resulted from C17C19 sample, which presented synergistic interactions reaching the highest value of CO2 adsorption (0.62 g CO2/g adsorbent), compared to other samples.
chemical and mechanical stability under extensive cycling. In recent years, considerable efforts in developing new adsorbents have been reported by the scientiic community aiming at optimizing the adsorption technology4.
Since 1990s, the use of mesoporous materials synthesized from M41S has been extensively investigated in areas including environment5,6 catalysis7-9, energy10, and biomedicine11. A wide variety of reports has addressed the versatility of MCM-4112-16 which became the most popular example of the M41S family due to a combination of superior properties, such as high surface area, thermal stability and porous volume that can vary according to the surfactant used. In addition, average pore sizes can vary between 2 and 50 nm17,18. These features yield fast mass transport19, making this material appealing to adsorption processes9. The high adsorption capacity of mesoporous silica for CO2, CH4, N2, H2 and O25 has been reported along with the possibility of adjusting the mesoporous9 improving CO
2 adsorption.
The experimental design of component mixtures is an essential tool to optimize production at reduced costs. Both the time and number of experimentsmay be reduced to obtain reliable results. To study the effect of mixture compositions on a variable outcome, one may use composition modelling. This method basically consists in solving an equation by the least square method to ind results which show the behavior of a dependent variable with respect to each component of a mixture20. The simplex-centroid mixture design was chosen in this study since it is specially used for three-component mixtures. In this case, due to the peculiarity of ternary mixtures represented by only one mixture, planning is known as “simplex-centroid design”21,22. This method was applied here in to study the use of tetradecyltrimetylammonium bromide (TTMABr - C17H38NBr), cetyltrimethylammonium bromide (C19H42NBr) and trimethyloctadecylammonium bromide (DTMABr – C21H46NBr) surfactants in the production of MCM-41for CO2 adsorption.
2. Material and Methods
2.1. Synthesis of MCM-41-type absorbents
Mesoporous materials were synthesized by the hydrothermal method using tetraethylorthosilicate (TEOS) as silica source, sodium silicate, water and three surfactants with different chain sizes as structural conductors12. The surfactants used were tetradecyltrimetylammonium bromide - C17 (C17H38NBr), cetyltrimethylammonium bromide - C19 (C19H42NBr) and trimethyloctadecylammonium bromide - C21 (C21H46NBr). They were mixed in the following ratios: 1:1 C17C19 (C17H38NBr + C19H42NBr); 1:1 C17C21 (C17H38NBr + C21H46NBr), 1:1 e C19C21 (C19H38NBr + C21H46NBr) and 1:1:1 C17C19C21 (C17H38NBr + C19H42NBr + C21H46NBr). The gel with molar composition 4 SiO2: 1 (CnH2n+1N(CH3)3Br: 1 Na2O: 200 H2O was added in a telon autoclave and incubated for a period of 120 h at 373 K. pH was daily adjusted between 9 and 10 using acetic acid 30%. The resulting materials were iltered, washed and dried for 3 h at 373 K, followed by 2 h of calcination at 823 K initially under inert nitrogen atmosphere and subsequently air. After calcination, the materials were characterized by XRD, FTIR, BET,TG and SEM.2.2. Characterization
The calcined samples were characterized by X-ray diffraction (XRD) in a Shimadzu XRD-6000 equipment set to 30 kV and 30 mA, with monochromatic CuKα radiation (λ = 1.5406 Å). The diffraction data were scanned in the 2θ range of 1°-10° at a step size of 0.02°. Nitrogen adsorption/desorption isotherms were measured using a Micromeritics ASAP 2020 equipment. The speciic surface area and porous distribution were obtained using BET and BJH methods applied to the desorption isotherm, respectively23,24. Thermogravimetric analyses were performed using a TA balance model Q500, under N2 atmosphere, under a low of 100 mL/min, between 30 and 800°C. The mass of the samples was 3.0 mg. The heating rate was 10°C min-1. FTIR spectra were obtained in a Shimadzu IR Prestige-21 spectrophotometer, using KBr as dispersing agent. The pellets were prepared using approximately 0.7 mg of material with enough KBr to reach the concentration of 1 wt. %. The material was homogenized and hydraulically pressed under 8 ton. The absorption spectra of MCM-41 were obtained in the medium infrared range of 400-4000 cm-1 with resolution of 4 cm-1. The morphology of the materials was observed by scanning electron microscopy (SSX-550 SHIMADZU).
2.3. Adsorption experiments
The adsorption equilibrium of CO2 for different samples was gravimetrically measured on a Rubotherm Magnetic Suspension balance at 298 K. The methodology employed consisted of three steps: (a) activation of the sample, (b) determinationof the effect of the thrust to correct the values recorded by the balance during adsorption and (c) adsorption of CO2.
a) Activation of the sample
The samples were activated before performing the measurements. The method consisted of lushing the sample with 50 mL/min of Helium gas and heating it up to 393 K. After the sample was suficiently lushed and heated, it was cooled down under vacuum to measure the temperature. The activation process was continuously monitored by a magnetic suspension balance (MSB).The weight of the sample container and sample itself was measured by the MSB during activation. At the end, the mass was measured in vacuum. From this, the activated sample was calculated by subtracting the mass of the empty sample container25.
b) Determining the effect of the thrust
After activation, the thrust effect was corrected to determine the excess amount of adsorbent gas using Equation 1
.
bal
m=m +ρV (1)
where, mbal is the mass recorded by the MSB, ρ is the density of the atmosphere surrounding the sample and V is the volume of the weighed sample26-28.
c) CO2 Adsorption
in balance for each pressure was determined by subtracting the mass from the sample holder. Thus, the capacity of CO2 adsorption was demonstrated by the relationship of the absorbed mass of absorbent with respect to the range of analyzed pressure25,29-31.
2.3.1. Use of statistical tools to evaluate CO2 adsorption
The adsorption of CO2 using different mesoporous materials was evaluated using the simplex-centroid method (Statistic Software. v. 7.0, Tulsa, OK, USA, 2004). Contrary to the factorial experiment planning, where the variables are independent, using mixture planning, components represent ratios instead of independence. These ratios cannot be negative and, if they are presented as fractions of mixture, they should sum up to unit. Such conditions reduce the spatial representation of mixtures, denominated ‘simplex’, to the dimension of (q – 1), where q is the number of components. Therefore, q = 2 corresponds to a straight line, q = 3 an equilateral triangle, q – 1 a tetrahedron and values of q > 4 are impossible to represent in the three-dimensional space. This limitation is a consequence of the interdependence of components (xi) from the mixture given by Equation 2.
q
i 1 2 q
i 1
x x x x 1
= = + + …+ =
∑ (2)
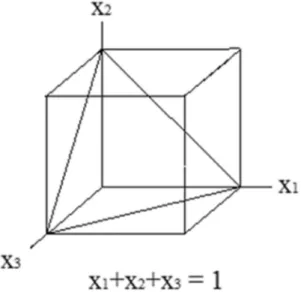
Therefore, the geometrical representation of the experimental space of “q” components consists of all sides, e.g., vertex, edges, and faces of a regular picture of dimension (q – 1). For a mixture of three components, q = 3, the simplex is an equilateral triangle (Figure 1), formed by a diagonal plain contained in a cube where the addition of proportions x1 , x2 and x3 in any side of the triangle is equal to 1.
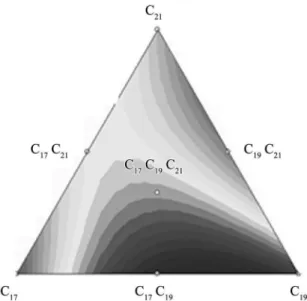
The sides located above the triangle vertex correspond to pure components: C17 (tetradecyltrimetylammonium bromide- C17H38NBr ), C19 (cetyltrimethylammonium bromide - C19H42NBr) and C21 (trimethyloctadecylammonium bromide C21H46NBr). Along the sides the binary mixtures can be found and, inally, the spot inside the triangle corresponds to the ternary mixture C17C19C21 (C17H38NBr + C19H42NBr + C21H46NBr). The mixture response is represented by the contour line32, 33. The model was adjusted using combinations of component ratios chosen to set the experimental planning. The “simplex-centroid” model developed by Scheffé34 yields responses of all subsets of components in the mixture where they appear in equal proportions. A number of (24-1) observations are used to reduce the number of experiments and still adjust an especial cubic model. In order to obtain regression equations, the model must be adjusted to experimental data. Experiments involving response models with independent variables have shown that Y can be estimated using polynomials derived from Taylor series35. Mixture modelling is common in simple computations. Linear, quadratic and especial cubic models are described by the following Equations 3-5, respectively:
Y=β1x1 2x2+β +β3x3 (3)
Y=β1x1 2x2+β +β3x3+ 12x1x2β + 13x1x3β +β23x2x3 (4)
Y 1x1 2x2 3x3 12x1x2
13x1x3 23x2x3 123x1x2x3
β β β β
β β β
= + + + +
+ + (5)
Where βi are interaction coefficients of first, second, and third orders, calculated for x factors x, and y is the experimental response36,37. In a mixture of 3 components to be optimized, those models should be gradually expanded, taking into consideration the effect of three pure components of the linear model, binary interactions, and an interaction of the three factors of the quadratic model and special cubic one.
The planning which allows to adjust the special cubic model without additional experiments of varied components is the simplex-centroid34,38 and, for this reason, it is the most used one. According to this planning for 3 components, e.g. in this study A = C17H38NBr; B = C19H42NBr and C = C21H46NBr, experiments must include 7 different mixtures: 3 experiments with pure components (1.00 A, B, and C), corresponding to the vertex of the diagram), 3 experiments with binary mixtures (0.50 A and B, 0.50 A and C and 0.50 B and C), corresponding to the mid-points of the edges, and a central point (0.33 A, B and C), corresponding to the centroid of the diagram (Figure 2). The response of the model was CO2 adsorption (Table 1). The necessary calculations to build and evaluate the models were performed using the least square solution of the Statistic Software. v. 7.0 computer program.
Figure 1. Representation of the experimental space “simplex” of three independent variables.
Table 1. Trials obtained by planning simplex-centroid.
Trials Proportion of the surfactants at MCM-41(%) C17H38NBr C19H42NBr C21H46NBr
1 100 0 0
2 0 100 0
3 0 0 100
4 50 50 0
5 50 0 50
6 0 50 50
3. Results and Discussion
3.1. X-ray diffraction
X-ray diffracton patterns of samples C17, C19, C21, C17C19, C17C21, C19C21 and C17C19C21 are shown in Figure 3. All the samples presented proiles typical of MCM-41, with the presence of major diffraction peaks (100), (110) and (200) of the hexagonal mesoporous phase. It can also be observed that the material which contains a mixture of surfactants in the pores showed higher intensity peaks, especially C17C19. It is interesting to notice that the surfactant of longest hydrophobic chain, DTMA+, used in the synthesis of sample C
21 was the one which presented the lowest peak intensity. Selvam and co-authors reported that surfactants with high molecular weight (≥C18) are dificult to solubilize, which can explain the behavior reported for sample C2113.
3.2. BET and BJH analyses
The physico-chemical parameters of samples C17, C19, C21, C17C19, C17C21, C19C21 and C17C19C21 are listed in Table 2. The speciic surface area was determined according to the BET method whereas the distribution of pores was estimated by BJH algorithm. It can be observed that sample C17C19 presented the highest crystallinity observed (DRX, Figure 3) along with highest surface area and pore volume.
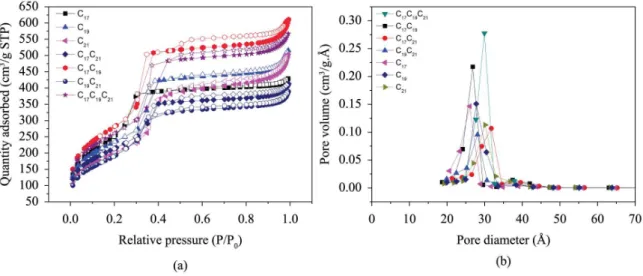
The adsorption/desorption isotherms for N2 and the pore size distribution of calcined samples can be seen in Figure 4. According to IUPAC classiication, the sample depicted in Figure 4a showed type IV isotherm and type H1 hysteresis, typical of mesoporous material with capillary condensation, suggesting the presence of particles of even size regularly ordered15,23. In Figure 4b, it can be observed pore size distributions in the range of 26 and 35 A. It can also be observed that samples C17C19C21 and C17C19 depicted uniform mesoporous distributions. Conversely, samples C21and C17C21, which used DTMA+ surfactant in their synthesis, presented poor mesoporous uniformity.
The main vibrational frequencies and their respective attributions are shown in Figure 5. For calcined samples, the stretch between C-H from groups, CH2 and CH3 corresponding to TTMA+, CTMA+and DTMA+ used on sample formation
of MCM-41 was absent. This conirmed the eficiency of the calcination process39.
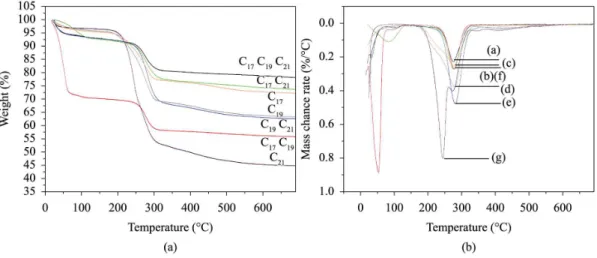
Figure 6 shows TG/DTG proiles of C17, C19, C21, C17C19, C17C21, C19C21 and C17C19C21 samples. Three mass loss events can be observed and were all characteristic of the MCM-41 mesoporous material. The irst one corresponded to loss of adsorbed water, the second one to the decomposition of surfactants present in the pores of the material and, inally, the third event corresponded to condensation of silanol groups from internal pore surfaces40. TG/DTG plots (Figure 6) showed faster deterioration of samples with mixtures of surfactants in the pores of the MCM-41 structure. The temperature range of the deterioration of surfactants and the percentage of mass loss are shown in Table 3.
SEM images of calcined samples are shown in Figures 7 and 8. The images reveal that the morphology of the material is similar for all samples and depicted clusters of hollow vermiform tubes which tend to curl over the surface. There are reports of MCM-41 morphologies that include spherical, rodlike, discoids and gyroids, in addition to millimeter-to-micrometer sized particles and hollow spheres, hollow tubes, wormlike, monolithic gels, thin ilms, among Figure 2. Three-component simplex-centroid experimental model.
Table 2. Physico-chemical parameter of materials.
Samples SBET a
(m2/g)
ao b
(nm) Dpc
(nm) Vpd
(Cm³/g) Tw
e
(nm)
C17
C19
C21
1014 840 723
4.34 4.68 4.89
2.66 3.21 3.49
0.77 0.87 0.83
1.67 1.47 1.39 C17C19 1039 2.92 2.92 1.03 1.02 C17C21 772 3.20 3.20 0.72 0.72 C19C21 723 3.02 3.02 0.67 0.67
C17C19C21 935 3.13 3.13 0.95 0.95
aBET surface area. bHexagonal unit cell (a
0=2d100/ 3).
cPore diameter calculated by BJH theory. dPore volume. ePore wall thickness (T
w=a0-dBJH).
others. Images similar to those reported here in can also be seen elsewhere41-43.
The results of the adsorption tests of C17, C19, C21, C17C19, C17C21, C19C21 and C17C19C21 samples are shown in Table 4. The experimental design revealed that trial 4 depicted the best result, with CO2 adsorption of 0.62g/g at 40 bar. These results can be explained by the synergetic effect of physisorption and chemisorption on MCM-41 associated with
the high surface area and the uniform mesoporous channels of MCM-41. The shape and curvature of pores were claimed to be important for the diffusion of molecules through the structure and the ultimate adsorption capacity16. Thus, it was expected that the best CO2 adsorption performance would be obtained by the highest surface area material, the highest pore volume, and the high degree of uniformity25.
Table 5 shows the coeficients to build the quadratic model obtained by statistical analysis. The limit of 95% reliabilitywas adopted. It can be observed that the quadratic model was best itted to experimental data once the value of p was below 0.05 to the limit of reliability of 95%. Figure 4. (a) Isotherms and (b) Pore distribution curves, based on the BET and BJH method, respectively.
Figure 5. FTIR from calcined samples C17, C19, C21, C17C19, C17C21,
C19C21 and C17C19C21.
Table 3. Temperature range of deterioration of the surfactants occluded in pores from samples.
Samples Range of
temperature (°C) Mass loss (%)
C17 165-318°C 18.30 C19 176-326°C 26.11
C21 179-323°C 43.53
C17C19 243-323°C 11.39
C17C21 216-352°C 13.72 C19C21 218-342°C 22.40 C17C19C21 222-336°C 10.95
Table 4. Simplex-Centroid mixture design.
Trials
Proportion of surfactants design MCM-41(%)
Adsorption of CO2
(g/g) C17 C19 C21
1 100 0 0 0.48
2 0 100 0 0.58
3 0 0 100 0.42
4 50 50 0 0.62
5 50 0 50 0.52
6 0 50 50 0.46
Figure 6. TG (a) and DTG (b) proiles of C17, C19, C21, C17C19, C17C21, C19C21 and C17C19C21 samples.
Figure 7. SEM images of calcined samples (a) C17, (b) C19 and (c) C21.
In the current work, the obtained quadratic model which represents the CO2 adsorption at the simplex-centroid planning is represented by Equation 6.
. . .
. . – .
17 19 21
17 19 17 21 19 21
Y 47 97 C 57 97 C 41 97 C
36 45 C C 28 45 C C 15 54 C C
= + + +
+ (6)
The analysis of the statistically signiicant terms from the adjusted model suggested that in the adjusted equation the components interact synergistically, increasing the capacity of CO2 adsorption, except for C19C21. From the Equation 6, it can be seen that the effect of trimethyloctadecylammonium bromide - C21 (C21H46NBr) associated with cetyltrimethylammonium bromide - C19 (C19H42NBr) used in the formation of MCM-41 C19C21 interacted decreasing the capacity of CO2 adsorption, as it can be established by the negative value of the coeficient. This may be attributed to the relatively lower surface area of this material and its low degree of uniformity as inferred from BJH (Figure 4b) and XRD data (Figure 3).Thus, there exists a clear correlation between high pressure CO2 adsorption data and both surface area and pore ordering25.
Table 6 shows the results from analysis of the adsorption variance of CO2. It can be observed that the quadratic model best adjusted the experimental data, once the value of p<0.05 and the coeficient of regression R-Sqrwas 0.99.
The quality of the adjustment shown in Table 6 is given by the coeficient of determination, R2, deined by Equation 7.
2 R
T
SQ R
SQ
= (7)
However, high values of R2 do not necessarily imply that the model is adequate. Therefore, it is very important the parallel use of the adjusted value of 2
A
R, deined by Equation 8
(
)
(
)
/
/
2 R
A
T
SQ n p
R 1
SQ n 1
− = −
− (8)
Models with high 2 A
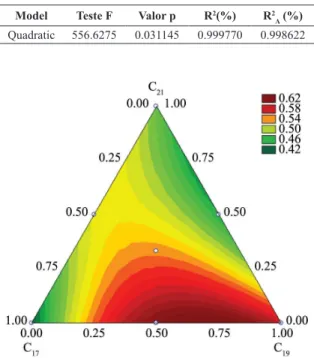
R values are generally preferable44. Figure 9 shows the response models of C17, C19, C21, C17C19, C17C21, C19C21 and C17C19C21 components. The result demonstrates that the region between vertex C17 and C19 is the one which showed the best CO2 adsorption rate. Comparing with the results shown in Table 4, it can be observed that sample C17C19 presented high synergistic interaction reaching
Figure 9. Response models for CO2 adsorptionof C17, C19, C21, C17C19,
C17C21, C19C21 andC17C19C21 samples.
the best value of adsorption of CO2 (0.62 g CO2/g adsorbent) among all samples analyzed.
4. Conclusions
Mesoporous C17, C19, C21, C17C19, C17C21, C19C21 andC17C19C21 materials showed well-deined hexagonal structure after calcination. By statistical planning of the mixtures, it was
possible to determine the best combination rate among the surfactants tested to maximize CO2 adsorption. The response models showed that the best combination of the surfactants resulted from C17C19 sample, which presented synergistic
interactions reaching the highest value of CO2 adsorption (0.62 g CO2/g adsorbent), compared to all other samples. Moreover, that sample showed highest crystallinity, surface area and pore volume. By statistical planning, it was clear
that there was a synergistic interaction of the surfactants from different hydrophobic chains in the formation of MCM-41 and CO2 adsorption.
Acknowledgements
The authors gratefully acknowledge the Reine and Catalysis Laboratories, (NUPRAR/LCR) at UFRN, the
Post-Graduation Programs of Petroleum Science and Engineering and Materials Science and Engineering (PPGCEP/PPGCEM) and CAPES-Brazil for their inancial support and scholarship provided.
Table 5. Regression analysis for CO2 adsorption from MCM-41
samples.
Component Coeficient p-Value*
C17 47.9773 0.003452
C19 57.9773 0.002856
C21 41.9773 0.003945
C17C19 36.4545 0.020874
C17C21 28.4545 0.026736
C19C21 -15.5455 0.048871
*Factors in which p-value is less than the level chosen of signiicance (0.05) are considered to have a statistically signiicant effect over CO2 adsorption..
Table 6. Analysis of variance (ANOVA) from quadratic model.
Model Teste F Valor p R2(%) R2 A (%)
References
1. Intergovernmental Panel on Climate Change – IPCC. Greenhouse gas emissions accelerate despite reduction efforts. IPCC; 2007. Available from: <http://ipcc.ch/pdf/ar5/pr_wg3/20140413_pr_ pc_wg3_en.pdf>. Access in: 20/08/2014.
2. Casas N, Schell J, Blom R and Mazzotti M. MOF and UiO-67/ MCM-41 adsorbents for pre-combustion CO2 capture by PSA: Breakthrough experiments and process design. Separation and Purification Technology. 2013; 112:34-48. http://dx.doi. org/10.1016/j.seppur.2013.03.042.
3. Figueroa JD, Fout T, Plasynski S, McIlvried H and Srivastava RD. Advances in CO2 capture technology-The U.S. Department of Energy’s Carbon Sequestration Program. International Journal of Greenhouse Gas Control. 2008; 2(1):9-20. http:// dx.doi.org/10.1016/S1750-5836(07)00094-1.
4. Yu CH, Huang CH and Tan CS. A review of CO2 capture by absorption and adsorption. Aerosol and Air Quality Research. 2012; 12:745.
5. Belmabkhout Y, Guerrero RS and Sayari A. Adsorption of CO2-containing gas mixtures over amine-bearing pore-expanded MCM-41 silica: application for CO2 separation. Adsorption. 2011; 17(2):395-401. http://dx.doi.org/10.1007/s10450-011-9348-0.
6. Santos DO, Santos MLN, Costa JAS, Jesus RA, Navickiene S, Sussuchi EM, et al. Investigating the potential of functionalized MCM-41 on adsorption of Remazol Red dye. Environmental Science and Pollution Research. 2013; 20(7):5028-5035. http:// dx.doi.org/10.1007/s11356-012-1346-6. PMid:23334547.
7. Kresge CT, Leonowicz ME, Roth WJ, Vartuli JC and Beck JS. Ordered mesoporous molecular sieves synthesized by a liquid-crystal template mechanism. Nature. 1992; 359(6397):710-712. http://dx.doi.org/10.1038/359710a0.
8. Aboul-Gheit AK, Abdel-Hamid SA, Mahmoud AS, El-Salamony RA, Valyon J, Mihályi MR, et al. Mesoporous Ti-MCM-41 materials as photodegradation catalysts of 2,4,6-trichlorophenol in water. Journal of Materials Science. 2011; 46(10):3319-3329. http://dx.doi.org/10.1007/s10853-010-5219-4.
9. Ma H, Baino F, Fiorilli S, Brovarone CV and Onida B. Al-MCM-41 inside a glass–ceramic scaffold: A meso–macroporous system for acid catalysis. Journal of the European Ceramic Society. 2013; 33(9):1535-1543. http://dx.doi.org/10.1016/j. jeurceramsoc.2013.01.004.
10. Xu W, Gao L, Wang S and Xiao G. Biodiesel production in a membrane reactor using MCM-41 supported solid acid catalyst.
Bioresource Technology. 2014; 159:286-291. http://dx.doi. org/10.1016/j.biortech.2014.03.004. PMid:24657760.
11. Popova M, Szegedi A, Yoncheva K, Konstantinov S, Petrova GP, Aleksandrov HA, et al. New method for preparation of delivery systems of poorly soluble drugs on the basis of functionalized mesoporous MCM-41. Micropor. Microporous and Mesoporous Materials. 2014; 198:247-255. http://dx.doi. org/10.1016/j.micromeso.2014.07.044.
12. Beck S, Schmitt KD, Higgins JB and Schlenkert JL. New family of mesoporous molecular sieves prepared with liquid crystal templates. Journal of the American Chemical Society. 1992; 14(27):10834-10843. http://dx.doi.org/10.1021/ja00053a020.
13. Selvam P, Bhatia SK and Sonwane CG. Recent Advances in Processing and Characterization of Periodic. Industrial & Engineering Chemistry Research. 2001; 40(15):3237-3261. http://dx.doi.org/10.1021/ie0010666.
14. Meynen V, Cool P and Vansant EF. Verified syntheses of mesoporous materials. Microporous and Mesoporous
Materials. 2009; 125(3):170-223. http://dx.doi.org/10.1016/j. micromeso.2009.03.046.
15. Lin LY and Bai H. Continuous generation of mesoporous silica particles via the use of sodium metasilicate precursor and their potential for CO2 capture. Microporous and Mesoporous Materials. 2010; 136(1-3):25-32. http://dx.doi.org/10.1016/j. micromeso.2010.07.012.
16. Kamarudin KSN and Alias N. Adsorption performance of MCM-41 impregnated with amine for CO2 removal. Fuel Processing Technology. 2013; 106:332-337. http://dx.doi.org/10.1016/j. fuproc.2012.08.017.
17. IUPAC Technical Reports and Recommendations. Reporting physisorption data for gas/solid systems with special reference to the determination of surface area and porosity (Recommendations 1984). Pure and Applied Chemistry. 1985; 57(4):603-619. http:// dx.doi.org/10.1351/pac198557040603.
18. Ghorbani F, Younesi H, Mehraban Z, Celik MS, Ghoreyshi AA and Anbia M. Preparation and characterization of highly pure silica from sedge as agricultural waste and its utilization in the synthesis of mesoporous silica MCM-41. Journal of the Taiwan Institute of Chemical Engineers. 2013; 44(5):821-828. http://dx.doi.org/10.1016/j.jtice.2013.01.019.
19. Hedin N, Andersson L, Bergström L and Yan J. Adsorbents for the post-combustion capture of CO2 using rapid temperature swing or vacuum swing adsorption. Applied Energy. 2013; 104:418-433. http://dx.doi.org/10.1016/j.apenergy.2012.11.034.
20. Montgomery DC. Design and analysis of experiments. 4th ed. New York: John Wiley & Sons; 1997.
21. Altieri C, Bevilacqua A, Perricone M and Sinigaglia M. Using a simplex centroid to study the effects of pH, temperature and lactulose on the viability of Bifidobacterium animalis subsp. lactis in a model system. Anaerobe. 2013; 23:23-26. http:// dx.doi.org/10.1016/j.anaerobe.2013.07.008. PMid:23916721.
22. Abdullah N and Chin NL. Simplex-centroid mixture formulation for optimised composting of kitchen waste. Bioresource Technology. 2010; 101(21):8205-8210. http://dx.doi.org/10.1016/j. biortech.2010.05.068. PMid:20624604.
23. Brunauer S, Emmett PH and Teller E. Gases in multimolecular layers. Journal of the American Chemical Society. 1938; 60(2):309-319. http://dx.doi.org/10.1021/ja01269a023.
24. Barrett EP, Joyner LG and Halenda PP. The determination of pore volume and area distributions in porous substances. I. Computations from nitrogen isotherms. Journal of the American Chemical Society. 1951; 73(1):373-380. http://dx.doi. org/10.1021/ja01145a126.
25. Costa CC, Melo DMA, Melo MAF, Mendoza ME, Nascimento JC, Andrade JM, et al. Effects of different structure-directing agents (SDA) in MCM-41 on the adsorption of CO2. Journal of Porous Materials. 2014; 21(6):1069-1077. http://dx.doi. org/10.1007/s10934-014-9857-9.
26. Staudt R, Saller G, Tomalla M and Keller JU. A note on gravimetric measurements of gas-adsorption equilibria. Berichte der Bunsengesellschaft fur Physikalische Chemie. 1993; 97(1):98-105. http://dx.doi.org/10.1002/bbpc.19930970117.
27. Keller JU and Staudt R. Springer, gas adsorption equilibria: experimental methods and adsorptive isotherms. Spriger: New York; 2005.
28. Rouquerol F, Rouquerol J and Sing K. Adsorption by powders and porous solids:– principles, methodology and applications. San Diego: Academic Press; 1999.
30. Chowdhury P, Bikkina C, Meister D, Dreisbach F and Gumma S. Comparison of adsorption isotherms on Cu-BTC metal organic frameworks synthesized from different routes. Microporous and Mesoporous Materials. 2009; 117(1-2):406-413. http:// dx.doi.org/10.1016/j.micromeso.2008.07.029.
31. Chowdhury P, Mekala S, Dreisbach F and Gumma S. Adsorption of CO, CO2 and CH4 on Cu-BTC and MIL-101 metal organic frameworks: Effect of open metal sites and adsorbate polarity.
Microporous and Mesoporous Materials. 2012; 152:246-252. http://dx.doi.org/10.1016/j.micromeso.2011.11.022.
32. Cornell JA. Experiments with mixtures: designs, models and the analysis of mixtures data. 1st ed. New York: John Wiley & Sons; 1981.
33. Cornell JA. How to run mixture experiments for products quality. New York: American Society for Quality Control; 1990.
34. Scheffé H. The simplex-centroid design for experiments with mixtures. Journal of the Royal Statistical Society. Series B. Methodological. 1963; 25:235.
35. Box GE, Hunter WG and Hunter JS. Statistics for experimenters. New York: John Wiley& Sons; 1978.
36. Cornell JA. Experiments with mixtures: a review. Tecnhometrics. 1973; 15(3):437-455. http://dx.doi.org/10.1080/00401706.197 3.10489071.
37. Cornell JA. Experiments with mixtures: designs, models and the analysis of mixture data. 2nd ed. New York: John Wiley & Sons; 1990.
38. Reis C and Andrade JC. Planejamento experimental para misturas usando cromatografia em papel. Quimica Nova. 1996; 19:313.
39. Flanigen EM and Sand LB, editors. Molecular sieve zeolites-1. In: Flanigen EM, Khatami H and Szymanski HA. Infrared structural studies of zeolite frameworks. Washington: ACS Publication; 1971. v. 101. p. 201-229. http://dx.doi.org/10.1021/10.1021/ ba-1971-0101.ch016.
40. Park M and Komarneni S. Adsorption breakthrough behavior: unusual effects and possible causes. Microporous and Mesoporous Materials. 1998; 25:75. http://dx.doi.org/10.1016/S1387-1811(98)00173-5.
41. Shylesh S, Jha RK and Singh AP. Assembly of hydrothermally stable ethane-bridged periodic mesoporousorganosilicas with spherical and wormlike structures Micropor. Microporous and Mesoporous Materials. 2006; 94(1-3):364-370. http://dx.doi. org/10.1016/j.micromeso.2006.04.012.
42. Balkus KJ Jr, Scott AS, Gimon-Kinsel ME and Blanco JH. Oriented films of mesoporous MCM-41 macroporous tubules via pulsed laser deposition Micropor. Microporous and Mesoporous Materials. 2000; 38(1):97-105. http://dx.doi.org/10.1016/ S1387-1811(99)00178-X.
43. Wang XS and Guo XW. Synthesis, characterization and catalytic properties of low cost titanium silicalite. Catalysis Today. 1999; 51(1):177-186. http://dx.doi.org/10.1016/S0920-5861(99)00020-6.