ISSN 0104-6632 Printed in Brazil
www.abeq.org.br/bjche
Vol. 33, No. 04, pp. 1091 - 1102, October - December, 2016 dx.doi.org/10.1590/0104-6632.20160334s20150088
*To whom correspondence should be addressed
Brazilian Journal
of Chemical
Engineering
THE BRAZILIAN EXPERIENCE WITH ETHANOL
FUEL: ASPECTS OF PRODUCTION, USE,
QUALITY AND DISTRIBUTION LOGISTICS
J. Belincanta
1*, J. A. Alchorne
1,2and M. Teixeira da Silva
11
PETROBRAS, Research and Development Center, Av. Horacio Macedo, 950, Cidade Universitária, ZIP 21941-915, Ilha do Fundão, Rio de Janeiro - RJ, Brazil.
Phone: + (55) (21) 2162-5049
*
E-mail: [email protected]; [email protected] E-mail: [email protected]; [email protected]
2
GORCEIX Foundation, Rua Carlos Walter Marinho Campos, 57, Vila Itacolomy, ZIP 35400-000, Ouro Preto - MG, Brazil.
(Submitted: February 19, 2015 ; Revised: July 10, 2015 ; Accepted: July 14, 2016)
Abstract - The reduction in the availability of fossil fuel increased the search for alternative fuel sources (for example, ethanol). In the Brazilian market, light duty vehicles can be fueled with gasohol (18 up to 27.5 %v/v of anhydrous ethanol in gasoline) and/or hydrous ethanol. To minimize the risk of water-induced phase separation of gasoline-ethanol blends, anhydrous ethanol is blended into gasoline at the distribution terminal, rather than distributing it through pipelines. Pure ethanol can be distributed through pipelines or trucks, and in pipeline cases almost all are not exclusive. To monitor the ethanol quality, several fuel sampling points are indicated: storage tanks, pipelines, and ship, if applicable. For these samples, it is important to evaluate the following parameters indicative of product quality: hydrocarbon and water amount, color, conductivity, and acidity. Monitoring ethanol storage, transport and distribution is important to maintain the ethanol quality until the final consumer.
Keywords: Ethanol fuel; Production; Quality; Logistics; Polyduct transport.
INTRODUCTION
The reduction in petroleum reserves, the perspec-tive of supply disruptions, price volatility, as well as environmental issues, have led to the consideration of alternative and renewable liquid fuels to replace conventional petroleum-derived fuels.
Oil remains the world’s leading fuel, with 32.6% of global energy consumption. Renewable energy accounts for 3.0% of global energy consumption, but the trend is the growth of its use (BP Statistical Re-view of World Energy, 2015).
The dominant biofuel in many countries is etha-nol, that has been used as blend component in gaso-line or as pure fuel, as in Brazil. The main benefit of
ethanol is that it can be produced from various re-newable raw materials and the life cycle assessment (a tool for evaluating environmental effects of the fuel based on the production, usage and disposal) is an advantage for this fuel compared to fossil fuels (Larsen et al., 2009). Ethanol can be produced from biomass such as sugar cane (mainly in Latin Ameri-ca), wheat and sugar beet (mainly in Europe), corn (mainly in the United States), and other grains. The production of ethanol from biomass involves fermen-tation and distillation, basically.
1092 J. Belincanta, J. A. Alchorne and M. Teixeira da Silva
Brazilian Journal of Chemical Engineering 2015). In Brazil around 56% is hydrous ethanol and
44% is anhydrous ethanol(Boletim Mensal dos
Com-bustíveis Renováveis, 2014; Brazilian Energy
Bal-ance, 2014).
The US Renewable Fuel Standard (RFS; Subtitle A) of the Energy Independence Security Act (EISA) of 2007 has made it a requirement to increase the production of ethanol and advanced biofuels, starting at 9 billion gallons in 2008, to 36 billion gallons for total renewable biofuels by 2022. Comparing 2000 and 2011, the sources of US gasoline supply (by volume) changed from 1% to 10% for ethanol, which reduced the imported crude oil.
In Europe, Directive 2009/28/EC (RED) requires a 20% share of total energy from renewable sources, and places a mandatory 10% minimum target, to be achieved by all Member States, for the share of bio-fuels in transport petrol and diesel consumption by 2020. A 10% share on an energy basis represents about a 14% share of road fuels on a volumetric ba-sis (CONCAWE, 2009). At the same time, an amend-ment was adopted to Directive 98/70/EC1 ("The Fuel Quality Directive") which introduced a mandatory target to achieve by 2020, a 6% reduction in the greenhouse gas intensity of fuels used in road transport. Directive 2009/30/EC sets regular blend maxim at 10%v/v of ethanol (E10), or oxygen maxi-mum content of 3.7 %m/m.
In Brazil, the total area is 850 million hectares and around 0.8% is used for sugar cane production. Nowadays, the sugar cane production is around 72 ton per hectare (635 thousand ton for 2014/2015 pro-duction) and ethanol production can reach 7 thousand liters per hectare (1 hectare = 2.47 acres). In 2014, the ethanol production was 28.1 billion liters (Boletim
Mensal dos Combustíveis Renováveis, 2015).
Ac-cording to the Brazilian Sugarcane Industry Associa-tion (UNICA), for the 2012/2013 crop, 53% of the revenue was provided by sugar, 42% by ethanol, 3% by electricity, and 2% by others (Boletim Mensal dos Combustíveis Renováveis, 2014).
Figure 1 shows the location of ethanol plants in Brazil. They are concentrated in the center-south and northeast Brazil.
USE OF ETHANOL IN BRAZIL
The use of ethanol as an automotive fuel is a quite old practice and, in Brazil, since 1931 it has been the target of numerous government measures with respect to its addition to gasoline.
The addition of ethanol to Brazilian gasoline had the initial goal of reducing imports of petroleum
derivatives and, in a second moment, solves the problem of ethanol over production due to the falling sugar price in the international market.
The addition of ethanol to Brazilian gasoline was random and the percentage added varied depending on the harvest of ethanol and sugar price on the inter-national market. But in 1979, with the consolidation of ProAlcool (program to motivate the ethanol pro-duction and use, started in 1975), the government fixed the addition of 20 %v/v of anhydrous ethanol to gasoline. It is important to point out that, during the four years of the program, vehicles were con-verted to use neat ethanol and in 1979 the first etha-nol powered car, with engine designed to run on neat ethanol, left the assembly lines.
In 2003 production started of flexible fuel vehi-cles (FFVs) that can operate with any mixture of hydrous ethanol and gasohol (blend of anhydrous ethanol and gasoline). The ethanol content in gaso-hol, which should be in the range of 18-27.5 % v/v, is fixed by the government and depends on market forces.
In response to these facts, Brazilian ethanol pro-duction has grown over the past decades. In 2013 ethanol represented 4.8% of the final energy con-sumption in Brazil, while gasoline represented 9.4%. In 2013, renewable energy (hydraulic, firewood, sugar cane products, and others) in Brazil represented around 46% of the total primary energy production (258.3 x 10⁶ toe)(Brazilian Energy Balance, 2014).
Figure 2 shows the Brazilian automobile fleet evolution in terms percentage depending on the fuel used. Recently, most new vehicles in Brazil are FFVs. Of the total amount of light vehicle licensing in Brazil, the FFVs accounted for something around 88%.
PRODUCTION PROCESS AND
DISTRIBUTION LOGISTICS OF ETHANOL IN BRAZIL
It is known that water can be removed from etha-nol only to a certain degree by traditional distillation methods, and then another relatively energy costly process removes the remaining water, a fact that makes anhydrous ethanol approximately 20–25% more energy demanding to produce than the etha-nol/water azeotrope (hydrous ethanol) (Larsen et al., 2009).
co li o ti g et ti th b S
ro li
Figur
(http:/
Figu
Hydrous e onsumer, but ine (known xygenate fue ion station, a asoline type thanol blend ion and distr he environm lending mus teinicke, 201
In Brazil, a oad, and the ines or railro
The Brazilian
Brazilian J
re 1: Ethano
//ethanolprod
ure 2: Brazili
ethanol is ma t anhydrous
as type A, el) directly i and the pro e C. It is no ds remain sto
ribution, as t ment with su st occur shor 12).
around 90% remaining 1 oad, used as
Experience with
Journal of Chemic ol plants di ducer.com/up
ian automob
arketed direc ethanol is m
that does n in the trunk duct obtaine ot advisable ored in the a they can abs ubsequent ph rtly before u
of ethanol is 10% is trans
“return freig
Ethanol Fuel: As
cal Engineering V stribution in ploads/posts/w
ile fleet evol
ctly to the fi mixed with ga not contain a
at the distrib ed is known e that gasoli reas of prod orb water fr hase separati use (Anton a
s transported sferred by pi ght”. Up to n
spects of Product
Vol. 33, No. 04, n Brazil. So
web/2013/12
lution depend
inal
aso-any bu-n as
ine- duc-rom ion; and
d by ipe-now
pip tot cou
ate tio (lo op wa wa (ve pip jun cia
tion, Use, Quality
pp. 1091 - 1102, urce: NIPE-2/brazilcanere
ding on the f
pelines are tal 7,100 km
untry, around As to futur ed in March, on and opera ogistics, load peration of po
ays) that inv aterways (ba
essels). Log pelines and w nction with t ally in the ce
y and Distribution
October - Decem -UNICAMP,
egions_1387
fuel used. So
not exclusiv m of pipelin
d 900 km are e logistics, L 2011) is res ation of the ding, unloadi orts and ons olves multim arges), highw um (2014) waterways w the existing ntral part of
n Logistics
ember, 2016 IBGE and 9047012391
ource: ANFAV
ve for ethan nes for liquid
e used to tran Logum Logi sponsible for Ethanol Log ing, handling shore termin modal transp ways (trucks forecasts th which will o
distribution the country.
10
CTC .jpg).
AVEA.
nol. From th d fuels in th nsfer ethanol istics SA (cr r the constru gistics Syste g and storag als and wate port: pipeline s) and coast he creation perate in co system, esp
093
pe-1094 J. Belincanta, J. A. Alchorne and M. Teixeira da Silva
Brazilian Journal of Chemical Engineering Thus, ethanol quality in the distribution system is
routinely required.
ETHANOL QUALITY ASPECTS
For fuels to be useful in the transportation sector, they must have specific physical properties that al-low efficient distribution, storage and combustion.
Ethanol storage, transport and distribution moni-toring is important to maintain the ethanol quality until the final consumer.
Brazilian Ethanol Specification (ANP Resolution nº 19/2015) presents the parameters that are con-trolled by the producer/provider/operator, distribu-tion and importer.
Producer/provider/operator and importer are re-sponsible to emit the Quality Certificate, that must contain the results for color and appearance, total acidity, electrical conductivity, density, pH (hydro-gen ionic potential), and alcohol, sulfate, iron, so-dium, copper, and sulphur content.
Distribution is responsible for emiting the Ac-cordance Bulletin that must contain the results for color and appearance, electrical conductivity, den-sity, pH and alcohol content.
If the ethanol was transferred by pipelines or for
imported fuel, the Certificate and the Bulletin must also contain the result for evaporation residue and hydrocarbon content. Otherwise, if the ethanol was transferred by waterway, it must also contain the result for evaporation residue, hydrocarbon, and chlo-ride content. Water, ethanol, and methanol content are required in the case of doubts of quality, or im-ported fuel.
Petrobras also monitors, in pipelines, ship and trucks, parameters such as color, appearance, electri-cal conductivity, density, alcohol and hydrocarbon content.
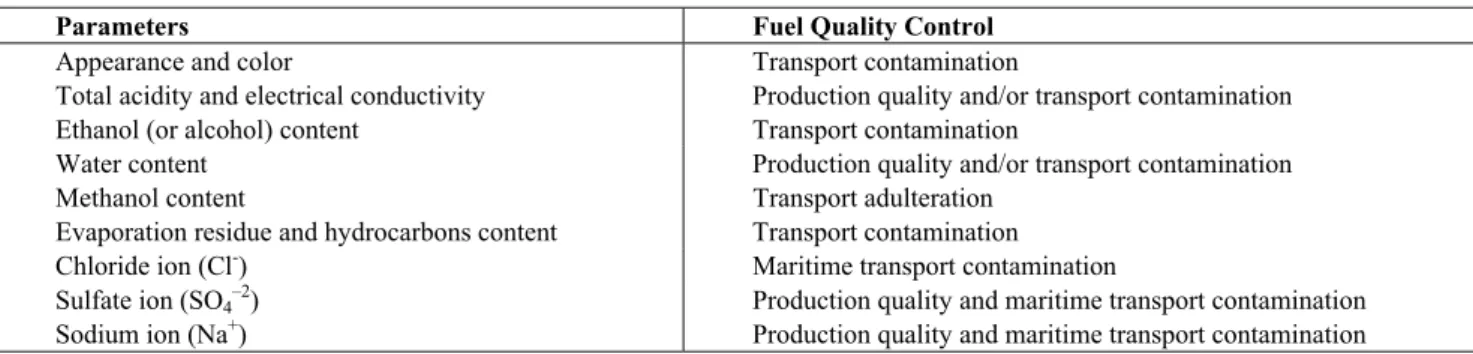
Table 1 lists some ethanol parameters reported in the ANP Resolution, and their relation to fuel quality control. Table 2 shows ethanol characteristics and their effects on the vehicle.
In cases where ethanol is mixed with gasoline, the automotive industry’s guiding document towards improved and harmonized market fuel quality is the Worldwide Fuel Charter (2013). Up to 10% by vol-ume of ethanol is permitted by existing regulations, and ethanol should meet the Ethanol Guidelines pub-lished by the WWFC Committee (Ethanol Guide-lines, 2009).
In the transport system, ethanol can be contami-nated by products remaining in the tanks and lines, inadequate operational maneuvers, problems with
Table 1: Ethanol parameters and quality control.
Parameters Fuel Quality Control
Appearance and color Transport contamination
Total acidity and electrical conductivity Production quality and/or transport contamination
Ethanol (or alcohol) content Transport contamination Water content Production quality and/or transport contamination
Methanol content Transport adulteration Evaporation residue and hydrocarbons content Transport contamination
Chloride ion (Cl-) Maritime transport contamination
Sulfate ion (SO4–2) Production quality and maritime transport contamination
Sodium ion (Na+) Production quality and maritime transport contamination
Table 2: Ethanol characteristics and their effects at the vehicle.
Parameters Vehicle Performance Vehicle Protection
Total acidity and pH Corrosion
Density and ethanol (or alcohol) content
Drivability (Air/Fuel Ratio)
Water content Drivability/fuel consumption Corrosion Methanol Content Fuel consumption (energy content)
Evaporation Residue Deposit formation
chloride ion (Cl-) Corrosion
Electrical conductivity, sulfate ion (SO4–2) and sodium ion (Na+)
Corrosion/Deposit formation
Iron (Fe) Deposit formation/ Wear
Copper (Cu) Deposit formation (catalyzes
The Brazilian Experience with Ethanol Fuel: Aspects of Production, Use, Quality and Distribution Logistics 1095
Brazilian Journal of Chemical Engineering Vol. 33, No. 04, pp. 1091 - 1102, October - December, 2016 sealing systems, incorporation of solids due to
corro-sion of lines, relocation of cargo ships and product adulteration.
To monitor the ethanol quality in this system, seve-ral fuel sampling points are indicated: storage tanks, pipelines (at pumping units - beginning, middle and end of pumping ethanol), service station, and ship, if applicable.
Petrobras conducted a follow-up study of ethanol transported by pipelines after 1, 3 and 5 hours and in the final 500 m3. It was found that the conductivity, water content, hydrocarbons and acidity are higher in the beginning than at 3 hours. The reduction depends on the sample analyzed. Changes in the product quali-ty were not observed during transportation after this period. As noted, the greatest contamination of the ethanol may occur at the start of pumping, as ex-pected, and differences in color are caused by differ-ent pollutants or differdiffer-ent concdiffer-entrations.
It is important to mention that anhydrous ethanol in Brazil must receive a dye. In some cases the dye is added by the sugarcane industry and in others by the company responsible for the final product distribu-tion. The anhydrous ethanol with dye cannot be trans-ported by pipeline due to other products pumped in polyducts.
For storage of the ethanol in the production or distribution centers, tanks with floating ceiling and dome are normally used to minimize water absorp-tion and vapor emissions. Another opabsorp-tion is to use a fixed ceiling with floating membrane.
Carbon steel for tanks and pipelines works fine with ethanol fuel as long as it does not contain ionic impurities that increase its corrosiveness. Stainless steel is the best material for ethanol tanks, pipelines, and components, but it is expensive compared to most other materials used for fuel tanks and piping. Some carbon steel tanks are coated internally with an epoxy to prevent corrosion over time, but it is nec-essary to evaluate each epoxy type, because some are not compatible with ethanol. In Brazil, years of practical experience have shown that ethanol can be distributed using these materials without major problems.
Another material commonly found in fuel storage and dispensing is aluminum. When exposed by removal of nickel plating, aluminum was found to be susceptible to widespread pitting. The exposure of the substrate accelerated corrosion due to a combina-tion of galvanic coupling of dissimilar metals and the increased conductivity of the environment (Kass et al., 2012).
If aluminum and magnesium alloys are attacked by alcohol fuel blends, another type of corrosion is
observed, called ‘‘dry corrosion’’ (Kruger et al., 2012; Keuken, 2013).
Several studies show the corrosion behavior of several aluminum alloys in ethanol fuels. Kruger et al. (2012) investigated this topic by immersion and polarization tests with anhydrous ethanol with water content between 0.05 %v/v and 0.3 %v/v, and tem-perature in the range between ambient and 80 ºC. They noted that, while high alloyed stainless steels are regarded to be resistant to ethanol fuels of any mixture, for aluminum alloys the addition of water restrains the corrosion. Steels and other metals will corrode if the water content in the fuel mixture is high enough to promote phase separation.
Park et al. (2011) examined the effects of dis-solved oxygen on the corrosion of aluminum alloy at high temperature (100 ºC) for E20 fuel (a blend of 20 %v/v of anhydrous ethanol in gasoline) by electrochemical tests and surface analyses. They no-ticed that the water formed by dissolved oxygen in this fuel enhanced the corrosion resistance of the alu-minum alloy by promoting the formation of a protec-tive surface film.
Keuken (2013) studied the conductivity of E10 (dry, with 0.2% and 0.5% of water) adding salt water (0.1 to 1.0%, of 3 grams per liter solution). For the same amount of salt water (0.5% to 1.0%, because for low concentrations the salt precipitates out), dry E10 presented higher conductivity than E10 with 0.2 and 0.5% of water. The author concluded that it is necessary to stipulate a minimum water content in fuel ethanol for direct blending of E5, E10 and higher blends to avoid alcoholate (alkoxide) corro-sion, and it is also necessary to set a maximum water content for these fuels to ensure that phase separation issues will not occur. It is worth mentioning that E10 and E5, respectively, correspond to blends of 10 %v/v and 5 %v/v of ethanol in gasoline.
trans-10 p co n ob b co ea d th su am it (2 et fo in is n fi th n m en re th H g ce g p et th p so ex p li d is an o la p li 096
orted in fron orrosion.
For maritim ot used for e bserve if the le with ethan ondition "Fr ach tank ves etection of h he wall resid
uch as nitro mount of CO ty and caus 2006) showe thanol-water Regarding or quality an ndicated that s not recomm
ol, one in a b irst one show he second on ot advisable meability and nvironment. PREPAR LOGIST Logisticall efineries wou he finished p However, the asoline at di enters (Bech asoline-ethan ipeline to a thanol is hy he fuel is i resent in exi olubility in t xample), and ipes.
Figure 3 il ine and etha oes not have s not pumpin
nd part of th f the gasolin ayer is more
umping rest ine wall.
nt of it; (8)
me transport ethanol. So, s e paint used i nol; vessels m ree for Man"
ssel; perform hydrocarbons
due and test ogen. If an O2 is used, it se quality p ed that increa r mixture inc g storage of
nalysis, some t storing etha mended. Kee bright room wed corrosivi
ne. The stora e, since this d allows abs
RATION AN TICS OF GA
BLE
ly, blending uld be the s product met e majority o istribution ce
htold et al., nol blends avoid increas ydroscopic a
inevitably ex isting pipelin the fuels bein d water coll
llustrates a p anol. It can e affinity wit ng, water te he water is m ne is mixed w e susceptibl arts, ethanol
monitor the
t, usually a d some caution in the inner t must arrive a " to allow th ming "Wall W
s, assessment t chloride; u inert gas w t will increas problems. D asing the eth creases CO2 s small volum e studies don anol in color eping two sa and another ity significan age in plastic material has sorption of w
ND DISTRI ASOLINE-E ENDS ethanol into simplest way the required of ethanol i enters or etha
, 2007). It o cannot be sed water c and in all pi xposed to w nes because ng transporte lects at “low
olyduct flow be observed th water. Wh ends to flow mixed with e with ethanol. e to wet co l moves, cle
J. Belincanta, J
Brazilian Jou e pipeline in
dedicated ship ns are indicat tank is comp at the port in he inspection Wash Test" t of the color use of inert with signific se ethanol ac Dalmolin et
hanol amount solubility. mes of etha ne by Petrob rless glass vi amples of et
in the dark, ntly higher th c bottles is a s a certain p water from
IBUTION ETHANOL
gasoline at y to ensure t d specificatio is blended i
anol product occurs becau distributed ontent becau ipeline syste water. Water of its very l ed (gasoline w points” in
w carrying ga d how gasol en the polyd w to the bott ethanol and p
The water r orrosion. Wh
aning the pi
. A. Alchorne and
urnal of Chemica nner p is ted: ati-the n of for r of gas cant cid-al. t in anol bras ials tha-the han also per-the the that ons. into tion ause via ause ems r is low for the aso-line duct tom part rich hen ipe-Fig wa du tra can pro tra pro tra pa is i be cor uct aff ten con ess wa con pro lin
d M. Teixeira da
al Engineering
gure 3: Pol
ater. (a) pol uring no pum
Due to the ansported by
n drag some oducts) from ansport of eth
oduct, it is r ansported to ssage of a sa indicated to
Impurities a controlled, rrosion inhi ts) and hydr fects the colo nt increases t
ntent. In industry sential facto ater phase of
ndenses, it t oduct, accum ne low-points
Silva
yduct transp yduct durin mping; (c) pu
high solven pipelines or e impurities m the inner wa
hanol in syst recommende reduce cont acrifice produ
reduce the lo and water pr directly or bitor (derive ocarbons aff or and condu the conductiv
or the distrib r for microb f the tank bo tends to sepa mulating in t s) favors the
port with th ng pumping; umping restar
ncy of ethan r stored in me
(metal depo alls. With th tems not exc ed to increas
tamination p duct prior the
osses. resent in the
indirectly. I ed from pet fect the ethan uctivity, and
vity and dec
bution proce bial activity. ottom (as di arate out of tank bottom growth of ae
he presence (b) polydu rt.
nol, when it etallic tanks, sits, corrosio is, for pipelin clusive for th
se the volum problems. Th e ethanol batc
e ethanol mu Impurities lik
troleum pro nol color, iro the water co creases ethan
ess, water is a . The ethano issolved wat
co co ca co sh m d b st g fe th n (S co co ti cr v tr ra d (d se p is m ad te to m p ti er in M tw m tr fo olonies, whi omponents o
The two p aused by mic orrosion and how that w metals and, i
ecrease. Passman e
ial activity torage tanks asoline. How ectant at co hese concent ol blends w Source: Mark The prima ontrol are p ommonly re ion includes radle-to-grav enting water rivial process To minimi ation of gas rous ethanol directly in th ervice statio ipelines.
To ensure s online mixt mated manne
dded are ca emperature. T o the service mixture.
EFFECT
As regard roperties tha ility and com
rties are also n this paper.
Miscibility
Ethanol is wo liquids c mixture proce ractions are b ormed (Figu
The Brazilian
Brazilian J ch are detrim of the fuel ha primary types
crobes are m d fouling (Pas ater increase in the case o
et al. (2009) r in the aque containing wever, ethan ncentrations trations, it is will be susc k Bishop´s C ary pillars o prevention a ecommended system desig ve product s r accumulati s.
ize the risk o soline-ethano l is blended i he tank truck ons rather th
a homogene ture, on the l r, where the lculated bas The moveme e station is su
TS OF ETHA GASO
ds mixtures at are affecte mpatibility w o affected, bu
miscible in w can be mixed
ess, water-wa broken and e ure 4). Becau
Experience with
Journal of Chemic mental to fue andling syste s of infrastru microbiologic ssman, 2013 es the corro of ethanol s
reported evid eous-phase o 10% of eth nol can be u higher than
unlikely tha ceptible to b Chemistry Sit of microbial and remediat d is water c
gn, water rem stewardship. ion in fuel sy
of water-indu ol blends, in into gasoline k) prior to sh han distribut
eous mixture loading platf proportiona ed on produ ent of the tan ufficient to h
ANOL ADD OLINE
of ethanol ed include m with elastome ut they will n
water, which d in any pro ater and etha ethanol-water use the attra
Ethanol Fuel: As
cal Engineering V el and to cert
m.
ucture proble cally influenc
). Some stud osion for so olutions, it c
dence of mic of undergrou hanol in regu used as a dis n 20 %v/v. t gasoline-et biodeteriorat te).
contaminat tion. The m ontrol. Prev moval and go
However, p ystems is no
ced phase se n Brazil anh e at the termi hipping to re ting it throu
the best opt form in an au l volumes to uct density a nk truck enro
homogenize
ITION TO
and gasoli miscibility, vo ers. Other pr not be discus
h means that oportion. In anol-ethanol r attractions actions betwe
spects of Product
Vol. 33, No. 04, tain ems ced dies ome can cro-und ular sin-At tha-tion tion most ven-ood pre-ot a epa- nhy-inal etail ugh tion uto-o be and oute the ine, ola- rop-sed the the at-are een the of as mi Sit Fig wa wa per pa int dro cau att ch ga ev eth ble ga ten the tol rat in ven
tion, Use, Quality
pp. 1091 - 1102, e particles ar the ethanol their freedo ixture is obse
te).
gure 4: Pos
ater molecule
There is a v ater molecul
rsal does ca ss into the w to the hydro ocarbon and use the new tractions that anges in the Anhydrous soline in any er, the presen hanol can ca ending probl soline compo nt in ethanol e mixture dec
The lower lerance, so in tion of ethan
gasoline ble ntional gaso
y and Distribution
October - Decem re so similar,
molecules in om of movem erved (source
sible arrang es are dispers
very slight m es. The natu ause some h water and som ocarbon. New water mole attractions a t are broken,
structure of ethanol is y proportion a
nce of water ause phase lem depends osition, ethan l. Increasing creases the p
the tempera n cold clima nol with high ends. At 21 º line is aroun
n Logistics
ember, 2016 the freedom n water is a ment in pure e: Mark Bisho
gements whe sed througho
mixing of hy ural tendenc hydrocarbon me water mo
w attractions ecules are for are very diff , they introdu
the water. completely and any temp
in the mixtu separation p s on produc
nol content a g the amount
phase separat ature, the low ate condition h water cont ºC water solu nd 150 mL×m
10 m of moveme bout the sam e ethanol, an op´s Chemist
en ethanol an out a solution
drocarbon an cy toward di
molecules lecules to pa s between h rmed, but, b ferent from th
uce significa
miscible wi perature. How ure of gasolin
problems. Th t temperatur and water co t of ethanol tion problem wer the wat ns, phase sep ent may occ ubility in co m-3 (150 ppm
1098 J. Belincanta, J. A. Alchorne and M. Teixeira da Silva
Brazilian Journal of Chemical Engineering In E10, at the same temperature, water solubility is
around 5 to 7 L×m-3 (5,000 to 7,000 ppm) due to ethanol´s hydroscopic properties; however, at -12 ºC a gasoline-ethanol blend will tolerate approximately 3 L×m-3 (3,000 ppm) water. Once the solubility limit is exceeded, phase separation occurs and two phases are formed: an upper gasoline-rich liquid layer and a bottom ethanol-water rich liquid layer (Passman et al., 2009).
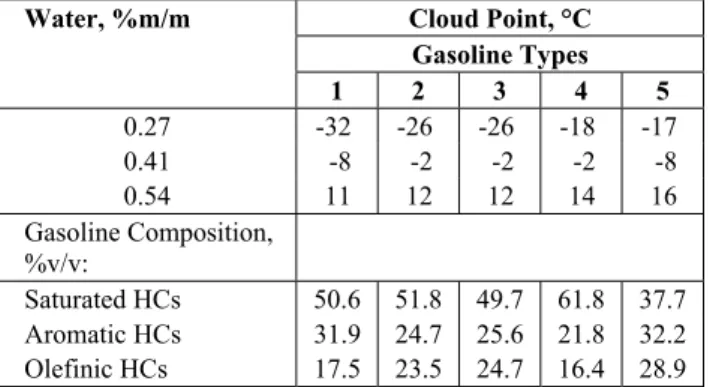
Tables 3 and 4 show experimental results of a study conducted by Petrobras that illustrates these statements about the water tolerance and phase sepa-ration tendency (indicated by the cloud point) of gasoline-ethanol blends.
Table 3 shows cloud point changes with the amount of hydrous ethanol and the gasoline compo-sition in gasoline-ethanol blends. Increasing the hy-drous ethanol fraction decreases the phase separation temperature, and increasing the concentration of aromatics and olefinic hydrocarbons (HCs) also de-creases this temperature.
Table 4 shows that, upon increasing the water content in gasoline-ethanol blends by manual addi-tion, the cloud point also increases.
Table 3: Influence of the ethanol content and of the gasoline composition on the cloud point.
Blends, %v/v Cloud Point, °C
Gasoline Ethanol Water Gasoline Types
1 2 3 4 5 6 88 11.1 0.9 > 35 27 > 35 > 35 > 35 > 35 82 16.7 1.3 > 35 20 27 > 35 22 29 75 23.2 1.8 32 9 16 26 12 19 Gasoline Composition,
%v/v:
Saturated HCs 95.1 59.4 69.2 81.9 66.0 71.8 Aromatic HCs 4.9 27.3 29.8 18.1 25.5 21.2 Olefinic HCs 0.0 13.3 1.0 0.0 8.5 7.0
Table 4: Influence of the water content and of the gasoline composition on the cloud point of gasoline-ethanol blends (E10).
Water, %m/m Cloud Point, °C Gasoline Types
1 2 3 4 5 0.27 -32 -26 -26 -18 -17
0.41 -8 -2 -2 -2 -8
0.54 11 12 12 14 16
Gasoline Composition, %v/v:
Saturated HCs 50.6 51.8 49.7 61.8 37.7 Aromatic HCs 31.9 24.7 25.6 21.8 32.2 Olefinic HCs 17.5 23.5 24.7 16.4 28.9
Investigations by the Process Design Center (PDC) led to research work that revised the under-standing of water tolerances of ethanol-gasoline mixtures and the conditions under which phase sepa-ration occurs. To verify and validate this discovery, covered by international patents WO 2006/137725 A1 and WO 2009/096788 A1, HE Blends BV (a separate entity of PDC) pursued its continuing test programs in Europe, testing vehicles with hydrous blends. The Netherlands experience showed that HE15 (a gasoline-ethanol blend with 15 %v/v of hy-drous ethanol) works well between -10 and +30 ºC ambient conditions (Source: PDC and HE Blends).
During the BEST project (Bio Ethanol for Sus-tainable Transport) more than 10.000 ethanol pow-ered cars were evaluated. HE15 and E10 (a gasoline-ethanol blend with 10 %v/v of anhydrous gasoline-ethanol in gasoline) showed any negative impact on engines in bench and fleet tests. Another conclusion of this study was that HE15 cannot be mixed with E10 or neat petrol and must have a separate infrastructure. Otherwise there is a risk of water separation in the fuel. In Rotterdam HE15 has been demonstrated and introduced successfully. The hydrous ethanol used to form this fuel has a maximum 6.5 %m/m of water.
The strategy behind this hydrous ethanol is to minimize production costs, because less effort/energy is needed to remove water from the ethanol. Because hydrous ethanol is less expensive and more CO2 friendly to produce compared to anhydrous ethanol, there are economic and environmental incentives for the presence of water in the fuel blends. However, as mentioned previously, in cold climate conditions, phase separation of ethanol with high water content and gasoline blends may occur.
Volatility
Volatility refers to a fuel’s ability to change from liquid to vapor, and it is commonly measured by the vapor pressure and the distillation curve. These properties can affect proper engine cold starting, vapor lock tendency in older engines without fuel injection (e.g., carbureted engines), and the quality of starting in engines with fuel injection. Vapor pres-sure is a critical factor in meeting evaporative emis-sion requirements.
Fuels with excessively high vapor pressure may contribute to hot drivability/hot restart problems such as vapor lock. Fuels of too low volatility may con-tribute to poor cold starts and poor warm up perfor-mance in vehicles.
it o o em T re p 1 d g v b g g st v b D w ac an (b 9 S st su an g ar sa et am a p co fl te tu co si et te ti d n li fr to fo et p
ts operation i f the curve ( f engine st missions, an The middle r elated to wa erformance, 50 ºC) rela eposits and asoline typi alues from lends with asoline, the reatly (Ande Figures 5 tudy conduc apor pressur lends, using D5191 and D were used: pr ccordance w nd two type both in acc .2.2011). An igma-Aldric tation. Prem ulfur, 46 %v nd 53 %v/v asoline prese romatics, 28 aturated com thanol, it w mount of ble phase separ erature (20 ontent below In a mixtu lat portion o emperature o ure of two o omposition imple distilla thanol and h emperature. ially flat dis
istillation me ol and hydro iquid. When rom the liqu o that of the h
Figure 5 ormed when thanol blend ressure that The Brazilian Brazilian J in engines. T (up to 70 ºC tarting, eng nd vapor lock
range of the arm-up, acce
while the to ates to the p
oil dilution. ically emph
the distilla no adjustm ese values ( ersen et al., 2 to 7 show th ted by Petro re and disti g respectiv D86. For the
remium and with ANP Re es of ethano cordance w nhydrous et ch and hydro mium gasolin v/v of aroma v of satura ented 850 pp 8 %v/v of o
mpounds. F was not poss ends as with ration was o ºC) for ble w 25 %v/v.
ure, an azeo of the distill of the azeotro or more liqu
of the mixtu ation. This m hydrocarbons This phenom stillation cur
easurement u ocarbons hav n the ethano id, the distil hydrocarbon shows that n gasoline is ds from 0-2
is higher th
Experience with
Journal of Chemic The low tem
) can be rela ine warm-u k (for carbu curve (70-1 eleration, an op range of th
propensity f Industry sp asize T10, ation curves ments made (especially T 2010a).
he experimen obras to eval
illation in g vely the A
blends two d the standar
esolution nº5 ol: anhydrou with ANP R thanol was ous ethanol ne presented atics, <1 %v ated compou pm v/v of sul
olefinics, an For studies sible to eva
anhydrous e observed at l ends with h
otrope manif lation curve ope. An azeo uids in a rati
ure cannot b means that th
s distil at a menon resul rve in the s until the azeo ve been elim ol has distil llation curve ns (CONCAW
t the azeotr s mixed wit 5 %v/v) res han either of
Ethanol Fuel: As
cal Engineering V mperature reg
ated to the e up, evaporat reted vehicle 100 ºC) can nd cold-weat
he curve (abo for combust pecifications T50, and T s. For etha e to the b T50) can v
ntal results o luate aspects gasoline-etha STM metho
base gasolin rd one (both 57, 20.10.20 us and hydro Resolution n
obtained fr from a serv d 5 ppm v/v v/v of olefini unds. Stand lfur, 26 %v/v nd 46 %v/v
with hydro luate the sa ethanol, becau
laboratory te ydrous etha
fests itself a at the boil otrope is a m
o such that be changed he azeotropes nearly const ts in an ess tandard AST otropes of et minated from led complet rapidly retu WE, 2009).
ropes that th ethanol ( sult in a vap f the individ
spects of Product
Vol. 33, No. 04, gion ease tive es). be ther ove tion for T90 anol base vary of a s of anol ods nes h in 011) ous nº7, rom vice of ics, dard v of of ous ame ause em-anol as a ling mix-the by s of tant sen-TM tha-the tely urns are (for apor dual co %v tha vap wi ref ga tho vid of vap Fig ble am inc of inc de vo cur veh the dat go till de dro the Co ph ma Mo de the
tion, Use, Quality
pp. 1091 - 1102, mponents. T v/v, the vapo at of gasoli
por pressure ith several s flect the dif soline tested ors (Henke e
de correlatio pure ethano por pressure
gure 5: Vap
ends, for a te
As shown mounts of eth crease in vol
the distillat creases (from
crease in th olatility) over
rve. It affec hicle, becaus e evaporative The results ta for ethano ood agreemen
lation curves Figure 7 s crease is les ous ethanol r e blend.
ompatibility
Chemical c hysical, chem
aterial result oreover, che gradation pr e fuel and im
y and Distribution
October - Decem The literatur
or pressure d ne. The obs e at 5-10 % studies. The fferent chem d (Andersen
et al., 2010; D ons for calcu
ol. For a tem of pure etha
or pressure c emperature of
in Figure hanol (5 to 1 latility for ap tion curve. A m 10 to 25 %
e distillation r the middle cts the evap
se the more v e losses of th
were compa ol (Andersen
nt in the ch s due to ethan
hows that, ss evident w
results, at th
y with Elasto
compatibility mical or me ting from th emical comp roducts, if a mpair automo
n Logistics
ember, 2016 re reports th
drops to equ servation of %v/v ethanol observed d mical compo
et al., 2010b Dalmolin et a
ulating the v mperature of anol is about
curves for ga f 37.8 °C.
6, the addi 10 %v/v) giv pproximately As the fracti %v/v), there i n temperatur e portion of t porative emi
volatile the f he fuel.
ared to avail
et al., 2010a hange in sha
nol addition. for hydrous when compar he same etha
omers
y refers to c echanical pr hermal-chem
patibility als any, must no otive perform
10 at, beyond 3 ual and belo f a maximu l is consiste difference ma
sitions of th b). Several a
al., 2006) pr vapor pressu f 37.8 °C, th
16 kPa.
asoline-ethan
ition of sma ves the large y the first 30 ion of ethan is a substanti re (increase the distillatio ssions from fuel the great
lable literatu a), and there pe of the di
s ethanol, th red with anh anol amount
changes in th roperties of mical exposur
11
fl ev p u
el su w n et A in h th
ti 100
Figure 6:
with anhy
Figure 7:
with hydro
The ethan luoroelastom valuated sinc otential alter sed in dispen A review o lastomers ex ure to gasoli will increase t eoprene), an thanol conce Accompanyin
ng decrease i igh swelling he effectiven It is impor ion affects t
Distillation drous ethano
Distillation ous or anhyd
nol compatib mers and nitr
ce these mat rnatives to th nser seals an of pertinent s xhibit some le ine. The add
the swelling nd the max entrations bet ng the volum
in the hardne g and increas ness of the se
rtant to poin the results, a
curves for ga ol.
curves for ga drous ethanol
bility of hig rile elastome
terials are co he current ru d o-rings. studies has s evel of swell dition of etha of most elas ximum swel tween 10 %v me increase i ess, and the sed softening eal(Kass et a
t out that the as reported
J. Belincanta, J
Brazilian Jou asoline-ethan
asoline-ethan l.
gh-performan ers needs to onsidered to ubber materi
hown that m ling upon exp anol to gasol
stomers (exc lling occurs v/v and 25 %v
s a correspon combination g would redu
l., 2011). e fuel compo
by Kass et
. A. Alchorne and
urnal of Chemica nol blends. S
nol blends. S
nce be o be ials
most
xpo-line cept at v/v.
nd-n of
uce
osi-al.
(20 cat ten ied ga tw the en pro
co nat 25 rep wi we en
d M. Teixeira da
al Engineering Standard gaso
Standard gaso
011) and M ted that, for nds to increa d NBR/PVC
soline rich i wo times more
e other fuels ts of the ble operties.
Petrobras co mpatibility ted) in gasol %v/v of eth presenting a ith 50 %v/v ere chosen b
gine operatio Silva
oline (a) and
oline (a) and
aciel et al. the fuels te ase elastomer
blend samp in olefins (cy
e swelling th s, and less e nd and less
onducted a s with elastom line-ethanol hanol, 18 % mixture of of hydrous because they on (nitrile fo
d premium ga
d premium ga
(2013). The ested, the aro r swelling. T ples that were
yclohexene) han for samp extraction of change in th
study to evalu omers (nitril
blends (thre %v/v of ethan
f 50 %v/v of ethanol). Bo y are more or diaphragm
asoline (b),
asoline (b),
e former ind omatic conte The latter stu e exposed to and observe ples exposed
f the constit he mechanic
uate aspects e and fluor e blends: wi nol, and a fu f gasohol fu oth elastome impactful o ms) and sealin di-ent ud-o a
ed to tu-cal
The Brazilian Experience with Ethanol Fuel: Aspects of Production, Use, Quality and Distribution Logistics 1101
Brazilian Journal of Chemical Engineering Vol. 33, No. 04, pp. 1091 - 1102, October - December, 2016 function (fluorinated for “O” rings). The base
gaso-line (gasogaso-line without ethanol) had 324 ppm v/v of sulfur, 26 %v/v of aromatics, 23 %v/v of olefinics, and 51 %v/v of saturated compounds.
The elastomer samples were immersed in each fuel at 60 ºC for 7, 14 and 28 days, and the changes in the weight, hardness, and mechanical properties (traction) studied. In general, the aged samples showed a reduction in the hardness, and an increase in the mass variation, tensile strength and E-modu-lus. For the hardness, mass variation, tensile strength and E-modulus results, it was observed for all sam-ples that the changes occurred with 7 days of immer-sion and, after that, the results remained almost un-changed. Maciel et al. (2013) indicated that this kind of change occurs by the first day and, after that, re-mains almost constant.
The mass variation increased after elastomer im-mersion, more for nitrile elastomers, and less for gasohol - hydrous ethanol blends. Maciel et al. (2013) observed that pure ethanol resulted in a de-crease in weight, different from the one observed for gasoline samples with ethanol (gasohol).
Comparing the results obtained with nitrile and fluorinated elastomer, the latter showed the best fuel resistance.
CONCLUSIONS
This paper considers some issues related to etha-nol: production, quality, use, logistics transportation and the effects of its addition to gasoline on some properties (miscibility, volatility and elastomeric materials compatibility). Procedures are indicated to minimize the risk of water-induced phase separation of gasoline-ethanol blends and to monitor the ethanol quality.
It is important to evaluate the following parame-ters indicative of ethanol quality: hydrocarbon and water amount, color, conductivity, and acidity.
Monitoring ethanol storage, transport and distri-bution are important to maintain the ethanol quality until the final consumer.
REFERENCES
Andersen, V. F., Anderson, J. E., Wallington, T. J., Mueller, S. A. and Nielsen, O. J., Distillation curves for alcohol-gasoline blends. Energy Fuels, 24, pp. 2683-2691 (2010a).
Andersen, V. F., Anderson, J. E., Wallington, T. J., Mueller, S. A. and Nielsen, O. J., Vapor pressures
of alcohol – gasoline blends. Energy Fuels, 24, pp. 3647-3654 (2010b).
ANP Resolution nº7, 9.2.2011, Available at: <http:// nxt.anp.gov.br/nxt/gateway.dll/leg/resolucoes_anp/ 2011/fevereiro/ranp%207%20-%202011.xml> (Accessed: September 15, 2014).
ANP Resolution nº19, 15.4.2015, Available at: <http:// nxt.anp.gov.br/NXT/gateway.dll/leg/resolucoes_an p/2015/abril/ranp%2019%20-%202015.xml> (Accessed: July 10, 2015).
Anton, C. and Steinicke, H., In Statement Bioenergy – Chances and Limits. German National Academy of Sciences Leopoldina, Edition 08/2012, pp. 45-46 (2012).
Bechtold, R., Thomas, J. F., Huff, S. P., Szybist, J. P., Theiss, T. J., West, B. H., Goodman, M. and Tim-bario, T. A., Technical issues associated with the use of intermediate ethanol blends (>E10) in the U.S. Legacy Fleet: Assessment of Prior Studies. Oak Ridge National Laboratory. ORNL/TM-2007/37 (2007).
The BEST experiences with low blends in diesel and petro fuels. BEST WP3 Low Blends Final Report. In European Project BEST-Bioethanol for Sustai-nable Transport, (2010).
Boletim Mensal dos Combustíveis Renováveis nº 75, Abril 2014; Boletim Mensal dos Combustí-veis RenováCombustí-veis nº 86, Março 2015. Available at: <http://www.mme.gov.br/spg/menu/publicacoes. html> (Accessed: July 10, 2015).
BP Statistical Review of World Energy, June 2015. Available at: <http://www.bp.com/content/dam/ bp/pdf/Energy-economics/statistical-review-2015/ bp-statistical-review-of-world-energy-2015-full-report.pdf> (Accessed: July 10, 2015).
Brazilian Energy Balance, Final Report, 2014. Available at: <https://ben.epe.gov.br/downloads/ Relatorio_Final_BEN_2014.pdf> (Accessed: Oc-tober 23, 2014).
CONCAWE, Volatility and vehicle driveability per-formance of ethanol/gasoline blends: A literature review. Report nº8/09. Brussels. October 2009. Available at: <http://www.sappro.ch/images/pdf_ doc_divers_anglais/Concawe%202009%20-%20 Report%2008%20-%20Volatility%20and%20 vehicle%20driveability%20performance%20of% 20ethanol-gasoline%20blends:%20a%20literature %20review.pdf> (Accessed: December 15, 2014). Dalmolin, I., Skovroinski, E., Biasi, A., Corazza, M.
L., Dariva, C. and Vladimir Oliveira, J., Solubil-ity of carbon dioxide in binary and ternary mix-tures with ethanol and water. Fluid Phase Equilib-ria, 245, pp. 193-200 (2006).
1102 J. Belincanta, J. A. Alchorne and M. Teixeira da Silva
Brazilian Journal of Chemical Engineering
oica.net/wp-content/uploads/ethanol-guideline-final-26mar09.pdf> (Accessed: November 20, 2014).
HE Blends BV, Available at: <http://www. heblends. com/> (Accessed: February 20, 2013).
Henke, S., Kadlec, P. and Bubnik, Z., Physico-chem-ical properties of ethanol – compilation of exist-ing data. Journal of Food Engineerexist-ing, 99, pp. 497-504 (2010).
Kass, M. D., Theiss, T. J., Janke, C. J. and Pawel, S. J., Compatibility Study for Plastic, Elastomeric, and Metallic Fueling Infrastructure Materials Ex-posed to Aggressive Formulations of Ethanol-Blended Gasoline. Oak Ridge National Labora-tory. ORNL/TM-2012/88 (2012).
Kass, M. D., Theiss, T. J., Janke, C. J., Pawel, S. J. and Lewis, S. A., Intermediate Ethanol Blends In-frastructure Materials Compatibility Study: Elas-tomers, Metals, and Sealants. Oak Ridge National Laboratory. ORNL/TM-2010/326 (2011).
Keuken, H., In: Corrosion Issues of Ethanol Blends and the Effect of Water. Proceedings of the 4th In-ternational Conference on Biofuels Standards, United States, November 13-15 (2013).
Kruger L., Tuchscheerer, F., Mandel, M., Muller, S. and Liebsch, S., Corrosion behaviour of alumin-ium alloys in ethanol fuels. J. Mater. Sci., 47, pp. 2798-2806 (2012).
Larsen, U., Johansen, T. and Schramm, J., Ethanol as a fuel for road transportation. In IEA Implement-ing Agreement on Advanced Motor Fuel (2009). Logum. Available at: <http://www.logum.com.br/ php/
a-logum.php> (Accessed: December 12, 2014).
Maciel, A. V., Machado, J. C. and Pasa V. M. D., The effect of temperature on the properties of the NBR/PVC blend exposed to ethanol fuel and dif-ferent gasolines. Fuel, 113, pp. 679-689 (2013). Mark Bishop’s Chemistry Site. Available at: <http://
www.mpcfaculty.net/mark_bishop/solubility_entr opy.htm> (Accessed: November 07, 2014). Park, I. J., Yoo, Y. H., Kim, J. G., Kwak, D. H. and
Ji, W. S., Corrosion characteristics of aluminum alloy in bio-ethanol blended gasoline fuel: Part 2. The effects of dissolved oxygen in the fuel. Fuel, 90, pp. 633-639 (2011).
Passman, F. J., Microbial contamination and its con-trol in fuels and fuel systems since 1980 - A re-view. International Biodeterioration & Biodegra-dation, 81, pp. 88-104 (2013).
Passman, F. J., Lewis, R. P., Palmer, J. L. and Reid, H., In Effect of Ethanol on Microbial Proliferation in Unleaded Gasoline Microcosm. Proceedings of the 11th International Conference of Stability, Han-dling and Use of Liquid Fuels – IASH, October 18-22 2009, Prague, Czech Republic (2009). PDC, Process Design Center, Available at: <http://
www.process-design-center.com/shared/hydrous-ethanol/Patents/> (Accessed: February 20, 2013). Renewables 2015 Global Status Report, REN 21.
Available at: <http://www.ren21.net/wp-content/ uploads/2015/06/GSR2015_KeyFindings_lowres. pdf> (Accessed: July 10, 2015).