ABSTRACT:Objectives: To analyze the dietary proile of participants who used two health promotion services located in socially vulnerable areas in a Brazilian metropolis. Methods: A cross-sectional comparative study was conducted with participants (n = 370) aged ≥ 20 years who joined two services of the Academias da Cidade program in Belo Horizonte, Minas Gerais, Brazil. The study participants engaged in physical activity and nutritional education actions directed by the services from 2009 to 2010. The sociodemographic and economic conditions and health and nutrition proiles of each individual were assessed. Results: Participants from a high social-risk who used the service did not demonstrate adequate intake of vegetables (54.6 versus 43.6%; p = 0.038), sweets (33.5 versus 23.2%; p = 0.030), soft drinks (28.5 versus 11.9%; p < 0.001), artiicial juice (34.7 versus 22.6%; p = 0.011), and processed meat (48.8 versus 32.7; p = 0.002). However, in the other service, lower social vulnerability, a higher prevalence of abdominal adiposity (60.7 versus 43.0%; p = 0.004) and consumption of high-fat meat products (53.0 versus 36.5%; p = 0.002) was observed. Conclusion: Participants who used both services demonstrated inadequate food intake compatible with the development of chronic disease proiles. However, the participants in each service were distinct from each other. This suggests that promotion of healthy eating should to contemplate the territory and its interface with people health.
Keywords: Feeding. Health promotion. Health services. Social vulnerability. Nutrition. Public health. Health status.
The dietary proile of socially vulnerable
participants in health promotion
programs in a brazilian metropolis
Peril alimentar de usuários de serviços de promoção
da saúde em vulnerabilidade social em uma metrópole brasileira
Raquel de Deus MendonçaI, Paula Martins HortaI,
Luana Caroline dos SantosI, Aline Cristine Souza LopesI
IUniversidade Federal de Minas Gerais – Belo Horizonte (MG), Brazil.
Corresponding author: Aline Cristine Souza Lopes. Escola de Enfermagem, Departamento de Nutrição, Universidade Federal de Minas Gerais. Avenida Professor Alfredo Balena, 190, 3º andar, sala 316, Santa Eigênia, CEP: 30130-100, Belo Horizonte, MG, Brazil. E-mail: [email protected]
Conlict of interests: nothing to declare – Financial support: Fundação de Amparo à Pesquisa do Estado de Minas Gerais for inancing the project number CDS APQ-0376-4.08/07
INTRODUCTION
In recent years, public health services have had to meet several challenges related to the alarming increase in the incidence of non-communicable diseases (NCDs) resulting from a rapidly aging population and increased global urbanization¹. The World Health Organization (WHO) recommends that current public health services integrate public health action plans through primary health care to ensure healthier communities. Public policies that intervene to provide protection for individuals against determinants that negatively afect public health will be essential².
One of the most important health determinants is social vulnerability. Research conducted by the Brazilian Ministry of Health in 2012 established that prevalence of NCDs is higher among individuals with lower levels of education3. This relation was also observed in individuals who spent less time participating in physical activity and demonstrated patterns of low quality food consumption3. Individuals who are socioeconomically disadvantaged or undergo long periods of income deprivation typically demonstrate low quality dietary intake. In addition, a low-cost diet is characterized by a higher caloric density, inadequate vitamin and mineral content, and increased prevalence of disease4.
Several Brazilian cities and states have developed initiatives to promote health, prevent, and control prevalence of NCDs in populations with high social vulnerability. Health promotion services that ofer regularly physical activity and nutritional guidance have
RESUMO:Objetivo: Analisar o peril alimentar de usuários de dois serviços de promoção da saúde localizados em áreas de elevada vulnerabilidade social de uma metrópole brasileira. Métodos: Estudo transversal realizado com todos os usuários (n = 370) com 20 anos ou mais de idade que ingressaram em duas Academias da Cidade de Belo Horizonte, Minas Gerais para prática regular de exercícios físicos e ações de educação nutricional, no período de 2009 a 2010. Avaliou-se condições sociodemográicas, econômicas, peril nutricional e de saúde. Resultados: Usuários do serviço com maior vulnerabilidade social apresentaram maior frequência de consumo inadequado de hortaliças (54,6 versus 43,6%; p = 0,038), doces (33,5 versus 23,2%; p = 0,030), refrigerantes (28,5 versus 11,9%; p < 0,001), sucos artiiciais (34,7 versus 22,6%; p = 0,011) e embutidos (48,8 versus 32,7%; p = 0,002). Contudo, no outro serviço, com menor vulnerabilidade social, observou-se maior prevalência de obesidade abdominal (60,7 versus 43,0%; p = 0,004) e consumo de carnes gordurosas (53,0 versus 36,5%; p = 0,002). Conclusão: Os usuários de ambos os serviços apresentaram peril alimentar inadequado e compatível com o desenvolvimento de doenças crônicas não transmissíveis, mas distintos entre si. Este fato sugere que ações de promoção da alimentação saudável devem contemplar o território e sua interface com a saúde das pessoas.
been proposed in the cities of Aracajú (SE), Vitória (ES), Curitiba (PR), Recife (PE), and Rio de Janeiro (RJ)5.
The capital city of the state of Minas Gerais, Belo Horizonte, has also implemented a health promotion service called Academia da Cidade Program to improve the quality of life of residents of the city. Individuals may enroll in the service spontaneously or through health care professional referral. The programs provide nutritional counseling and guided physical activity for individuals who live in areas of high social vulnerability6. Analysis of the programs demonstrated positive changes in the anthropometric proile and food consumption patterns of participating individuals7,8.
The Academias da Cidade Program provides important beneits to socioeconomically disadvantaged individuals with unhealthy lifestyles who are more likely to develop NCDs5. Understanding the dietary choices of socially vulnerable individuals will enable programs such as Academias da Cidade to formulate efective action plans. The aim of this study was to analyze the feeding proile of individuals who accessed the Academias da Cidade health promotion services located in areas characterized by high levels of social vulnerability in a Brazilian metropolis.
METHODS
DESIGN AND SAMPLE
This study was conducted in the city of Belo Horizonte, state of Minas Gerais, Brazil. Belo Horizonte is a municipality divided into nine administrative regional centers with an estimated population of 2,412,9379. The expected prevalence of obesity in 2012 for Belo Horizonte residents aged ≥ 20 years was 14.5% and occurrence rates for systemic arterial hypertension and diabetes mellitus were 25.9 and 6.6%, respectively3. This municipality has focused on strategies to enhance public health policies and inter-sectors actions for health promotion in more socially vulnerable populations.
The study sample was comprised of individuals ≥ 20 years who used two separate services (Service I and Service II) of the Academias da Cidade Program between August 2009 and November 2010. All members of the Academias da Cidade program agreed to participate in the study and all of the study participants engaged in morning physical exercise during the data collection period. At the time of this study, the services of the Academias da Cidade Program were the only services available with regular nutrition intervention accompanied by promotion of physical activity. It is also important to highlight that the two services were open in the morning.
infrastructure), cultural (access to education), economic (access to work and income), legal (access to legal assistance), and survival safety (access to health services, public social welfare, and safe food). The index varies between 0 – 1.0, and the closer the value is to 1.0, the higher the social vulnerability of the population10. Therefore, based on this index scale, we identiied that Service II was located in a region of higher social vulnerability when compared to Service I. Consent to participate in the study was considered after inclusion criteria were illed. All individuals provided written and informed consent for their participation in the study. The project was approved by ethics committees from both the Federal University of Minas Gerais (103/07) and from Belo Horizonte City Hall (087/2007).
MEASURES
Data were obtained from individuals upon their arrival at the service site. The data on each study participant’s socioeconomic and demographic conditions, health proile, food consumption, and anthropometry were acquired by properly trained nutrition students and nutritionists who administered a 40 minute examination.
The socioeconomic and demographic data evaluated included participant’s age, sex, professional occupation, level of education, number of household members, and family per capita income.
The health proile of each participant was investigated based on self-referral for NCDs and attempts to lose weight in the six-month period prior to the study were searched. This study used self-referral criteria similar to those reported by national research studies3.
Anthropometric assessment was conducted by measuring weight, height, waist circumference (WC), and hip circumference (HC) using techniques recommended by the WHO11. From these data, the body mass index (BMI, kg/m²) and the waist to hip ratio [WHR = WC (cm)/HC (cm)] were calculated.
Classiication of nutritional status of adults based on their BMI was performed according to WHO11 cut-points and Nutrition Screening Initiative12 classiications were used for the elderly. Adults with levels of undernourishment from I to III were classiied as underweight, and individuals with obesity levels I to III were classiied as overweight. The WC and WHR indices were classiied using the criteria recommended by the WHO13.
Participants were asked about their eating habits and food consumption frequency to determine their dietary proiles. Snacking habits between meals, drinking habits at mealtimes, and eating while watching television were investigated. Additionally, the intake of chicken skin and meat with apparent fat were also investigated. All variables described above were obtained from the interviewees’ report.
ANALYTIC STRATEGY
The data were analyzed using descriptive analysis and evaluation of variable distribution by the Kolmogorov-Smirnov normality test. Furthermore, the χ2 test was used to compare proportions. The level of signiicance was noted at p < 0.05. The Epi Info program (version 3.4.3), and the Statistical Package for the Social Sciences software (version 17.0) were used for the analysis.
RESULTS
There were 370 total participants in the study. Service I included 168 participants and Service II included 202 participants, with a mean age of 48.7 ± 13.6 years. There were a Table 1. Criteria to evaluate the food consumption frequency of participants who used the health
promotion services.
Food Recommendation Criterion adopted for adequate intake
Fruits 3 portions a day ≥ 3 portions a day
Vegetables 3 portions a day ≥ 3 portions a day
Beans Daily 5 – 7 times a week
Meats Daily 5 – 7 times a week
Milk and dairy products 3 portions a day ≥ 3 portions a day
Sweets 2 times a week or less ≤ 2 times a week
Stufed cookies* Not available ≤ 2 times a week
Regular sot drinks* Special occasions or reduce consumption ≤ 2 times a week
Artiicial juice* Consume moderately ≤ 2 times a week
Ice cream* Consume moderately ≤ 2 times a week
Fried food Avoid or reduce consumption ≤ 2 times a week
Snacks and sandwiches Occasionally < 2 times a month
Stufed meat products Occasionally < 2 times a month
Pork fat Occasionally < 2 times a month
Industrialized sauces Avoid Rare/never
Egg Daily Restrict (< 2 times a week)
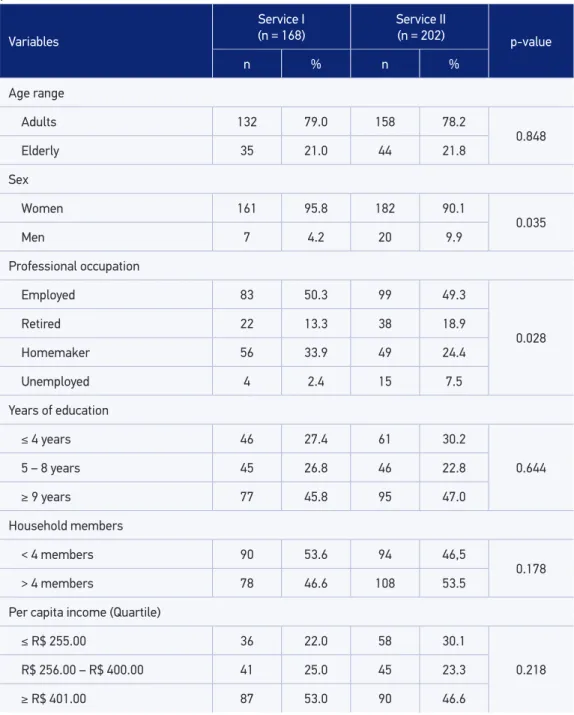
higher percentage of women in both services (95.8% for Service I and 90.1% for service II). In addition, there were statistical diferences between the two services in terms of the number of employed individuals (p = 0.028) (Table 2).
Variables
Service I
(n = 168) Service II (n = 202) p-value
n % n %
Age range
Adults 132 79.0 158 78.2
0.848
Elderly 35 21.0 44 21.8
Sex
Women 161 95.8 182 90.1
0.035
Men 7 4.2 20 9.9
Professional occupation
Employed 83 50.3 99 49.3
0.028
Retired 22 13.3 38 18.9
Homemaker 56 33.9 49 24.4
Unemployed 4 2.4 15 7.5
Years of education
≤ 4 years 46 27.4 61 30.2
0.644
5 – 8 years 45 26.8 46 22.8
≥ 9 years 77 45.8 95 47.0
Household members
< 4 members 90 53.6 94 46,5
0.178
> 4 members 78 46.6 108 53.5
Per capita income (Quartile)
≤ R$ 255.00 36 22.0 58 30.1
0.218 R$ 256.00 – R$ 400.00 41 25.0 45 23.3
≥ R$ 401.00 87 53.0 90 46.6
Note: The response rate decreased the overall sample size.
Systemic arterial hypertension was considered the most prevalent NCD (37.7% of participants in Service I and 39.3% in Service II). Both services presented a similar pattern of disease distribution (Table 3).
Participants of Service I were at high-risk for developing metabolic complications associated with abdominal obesity (p = 0.004). Both services had a high prevalence of overweight individuals (75.6% for Service I and 70.3% for Service II) and participants at high-risk for cardiovascular disease determined by WHR (65.1% for Service I and 57.5% for Service II) (Table 3).
The results from our analysis indicated that a signiicantly higher number of participants in Service I (70.1%) had attempted to lose weight in the six-month period prior to the interview when compared to participants in Service II (53.0%, p = 0.001). A follow up on participants in both services who had attempted to lose weight with the help of a health professional was not conducted on 76.2% of the total 223 individuals. Attempting to lose weight without the help of a health professional prevailed among participants of Service I (84.1 versus 70.8%, p = 0.018). Dietary restriction combined with physical activity was the
Table 3. Anthropometric and health proiles of participants who used the health promotion services.
Variables
Service I (n = 168) Service II (n = 202)
p-value
n % n %
Diseases and Grievances
Systemic arterial hypertension 63 37.7 79 39.3 0.757
Hypercholesterolemia 45 28.5 65 33.3 0.328
Hypertriglyceridemia 22 14.5 23 12.5 0.597
Diabetes mellitus 17 10.4 17 8.8 0.606
Body Mass Index Classiication
Underweight 3 1.8 8 4.1
0.318
Eutrophy 38 22.6 50 25.6
Overweight 127 75.6 137 70.3
Waist circumference Classiication – Risk of metabolic complications
No risk 36 21.4 59 30.6
0.004
High risk 30 17.9 51 26.4
Very high risk 102 60.7 83 43.0
Waist-to-hip ratio Classiication – Risk of cardiovascular diseases
No risk 58 34.9 82 42.5
0.144
With risk 108 65.1 111 57.5
most common behavior (40.2%) among participants in Service I, whereas dietary restriction alone prevailed among participants in Service II (38.7%).
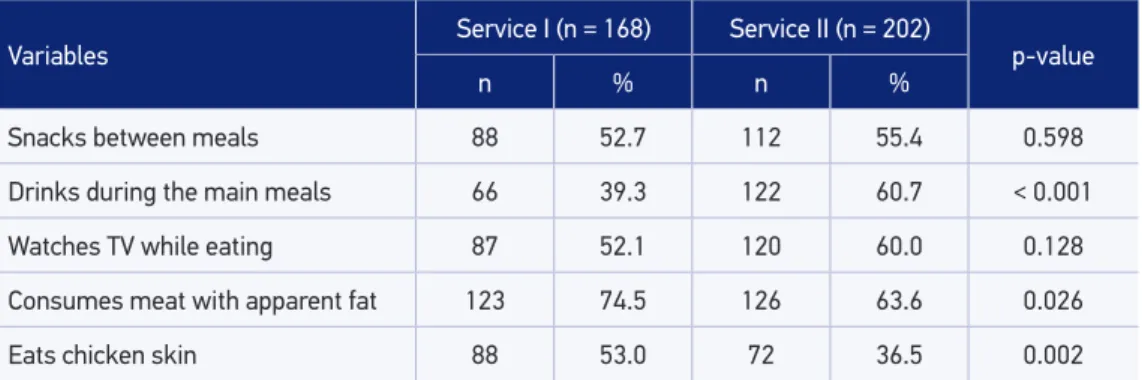
Participants in Service I exhibited a higher prevalence of eating chicken skin (p = 0.026) and meat with apparent fat (p = 0.002), and Service II participants showed a higher prevalence of liquid intake during lunch and dinner (p < 0.001) (Table 4). In addition, more than 50.0% of the individuals of both health promotion services demonstrated inadequate fruit and milk intake. The comparison of food frequency consumption patterns between the services showed that adequate intake of vegetables (p = 0.038), sweets (p = 0.030), regular soft drinks (p < 0.001), artiicial juice (p = 0.011), and processed meats (p = 0.002) was more common among Service I participants (Table 5).
DISCUSSION
Participants in Services I and II demonstrated signiicant diferences regarding food intake patterns. Participants in Service II (located in the more social vulnerability area) consumed greater amounts of ultra-processed food high in sugar, whereas Service I participants reported adequate intake of vegetables and fatty meat.
The results from this study indicated that participants in Service I who resided in environments with less social vulnerability consumed more fatty meats, whereas users from Service II consumed more ultra-processed food. This is in concordance with a recent survey among Brazilians that indicated that the ultra-processed food consumption has increased in people with lower incomes16. In addition, a study of 3,835 low-income adult participants in the National Health and Nutrition Examination Survey (NHANES 1999– 2004) also demonstrated that low-income adults consumed increased processed meats, high sugar items, such as candy, ready-to-eat desserts, and sweetened beverages, in excess while consumption of whole grains, fruits, vegetables, ish, and legumes has decreased17.
The diferences regarding dietary habits of participants in the separate health services could be related to the lack of availability of high-quality foods and lack of access to
Table 4. Eating habits among participants who used the health promotion services.
Variables Service I (n = 168) Service II (n = 202) p-value
n % n %
Snacks between meals 88 52.7 112 55.4 0.598
Drinks during the main meals 66 39.3 122 60.7 < 0.001
Watches TV while eating 87 52.1 120 60.0 0.128
Consumes meat with apparent fat 123 74.5 126 63.6 0.026
Eats chicken skin 88 53.0 72 36.5 0.002
Table 5. Inadequate food consumption patterns among participants who used the health promotion services.
Variables
Service I
(n = 168) Service II (n = 202) p-value
n % n %
Fruits 113 67.7 153 75.7 0.085
Vegetables 72 43.6 107 54.6 0.038
Beans 28 16.7 24 12.0 0.200
Meats 27 16.1 36 17.9 0.640
Milk and dairy 132 78,6 171 85.9 0.064
Sweets 39 23.2 67 33.5 0.030
Stufed cookies 7 4.2 13 6.5 0.325
Regular sot drinks 20 11.9 57 28.5 <0.001
Artiicial juice 38 22.6 69 34.7 0.011
Ice cream 4 2.4 8 4.0 0.401
Fried food 52 31.0 78 39.2 0.100
Snacks and sandwiches 57 33.9 72 36.0 0.678
Meat stufed products 55 32.7 98 48.8 0.002
Pork fat 17 10.1 20 10.1 0.983
Industrialized sauces 67 39.9 84 42.4 0.622
Egg 20 11.9 26 13.0 0.752
Note: The response rate decreased the overall sample size.
information in socially vulnerable areas. The ability to access information about healthier lifestyle choices promotes voluntary changes in dietary practices18. For example, a higher number of individuals from Service I attempted to lose weight in the six-month period prior to the study when compared to participants in Service II, which its with recommendations for weight loss and healthy lifestyles promoted by several associations and government entities14,19,20. The participants’ preference for calorie restriction or changes in diet and increased physical activity was relected in increased energy expenditure. In addition, the attempt to lose weight could also result from increased consumption of vegetables and decreased intake of sugar rich food19.
less variety22,23. In addition, Service II was located in an area of high social vulnerability with poor housing conditions, less urban infrastructure and work opportunities, limited access to health care, and deiciencies in guaranteed food security10 that all deterred the purchase of food outside the neighborhood22,23. These characteristics may contribute signiicantly to the observed dietary proiles of each service group in our study24-26.
Studies have shown that urban areas with insuicient resources to provide high-quality education have more local grocery stores, bars, fast food restaurants, and eating establishments that commercialize unhealthy products in comparison to supermarkets and shops that specialize in fresh fruits and vegetables24,25. Additionally, a majority of the establishments that sell ready-to-eat food do not ofer nutritional content of the products, thus making it diicult for individuals to choose healthy food27. These indings indicate that in order to provide adequate access to healthy food, the assessment of insuicient intake of healthy food should encompass understanding both the family and external environments26.
Participants in Service II demonstrated increased intake of high-sugar beverages including soft drinks and artiicial juice, which may explain the increased intake of liquids during main meals for these participants. High-sugar beverages with low satiating power provide excessive calories and rapidly absorbed sugar, and are associated with being overweight. This was veriied in an eight-year cohort study in the United States with 51,603 nurses from 1991 to 1999, in which increased intake of high-sugar beverages was positively associated with weight gain and risk of developing type II diabetes independently of other risk factors28.
Participants in Service I demonstrated a higher intake of fat and saturated fat from fatty meat, chicken skin, and meat with apparent fat. This increased consumption may have contributed to the diferences observed in WC. Indeed, Wang and Beydoun analyzed national studies to identify that North American individuals with a higher daily intake of meat demonstrated higher dietary caloric intake that was directly associated with increased WC29. In this study, participants of both services presented a low intake of fruits and vegetables. This is in contrast to the high intake of ultra-processed food (artiicial juice, fried food, processed meats, and snacks). This proile corroborates results from a Brazilian survey that showed that increased consumption of ready-to-eat products was associated with reduced intake of natural or minimally processed food16.
The study corroborates the hypothesis that social vulnerability may interfere with healthy nutrition practices. It is crucial to understand the experiences of socially vulnerable populations in order to implement eicacious public health strategies to confront health problems in this group. It is well known that the components of a social environment are direct determinants of an individual’s quality of life. Therefore, implementation of appropriate programs that promote healthy eating and exercise habits may provide a positive impact on quality of life21.
empowerment. Individuals will then be able to recognize that a healthy lifestyle is their responsibility and work to improve their access to quality healthy food30.
CONCLUSION
The results from this study indicated that participants of the Academia da Cidade program exhibited inadequate intake of healthy food and dietary proiles compatible with the development of NCDs. This suggests that consideration of sociodemographic conditions, infrastructure for accessible food, and an individual’s autonomy for making healthier food choices should be considered when promoting healthy diet programs in socially vulnerable populations.
1. Popkin BM, Adair LS, Ng SW. Global nutrition transition and the pandemic of obesity in developing countries. Nutr Rev 2012; 70: 3-21.
2. World Health Organization. Primary Health Care: Now More than Ever. Geneva; 2008.
3. Brasil. Ministério da Saúde. Secretaria de Vigilância em Saúde. Secretaria de Gestão Estratégica e Participativa. Vigitel Brasil 2012: Vigilância de Fatores de Risco e Proteção para Doenças Crônicas por Inquérito Telefônico. Brasília: Ministério da Saúde, 2013. 4. Andrieu E, Darmon N, Drewnowski A. Low-cost
diets: more energy, fewer nutrients. Eur J Clin Nutr 2006; 60: 434-6.
5. Brasil. Avaliação de Efetividade de Programas de Atividade Física no Brasil. Brasília: Ministério da Saúde, 2011.
6. Dias MAS, Lopes ACS, Bicalho K, Mourão M, Alves MN, Evangelista PA, et al. Promoção à saúde e articulação intersetorial. In: Magalhães Junior HM, (Org.) Desaios e inovações da gestão do SUS em Belo Horizonte: a experiência de 2003 a 2008. Belo Horizonte: Mazza Edições; 2010.
7. Mendonça RD, Lopes AC. The effects of health interventions on dietary habits and physical measurements. Rev Esc Enferm USP 2012; 46: 573-9. 8. Machado CH, Carmo AS, Horta PM, Lopes ACS,
Santos LC. Efetividade de uma intervenção nutricional associada à prática de atividade física. Cad Saúde Coletiva 2013; 21(2): 148-53.
9. Brasil. Instituto Brasileiro de Geograia e Estatística (IBGE). Contagem da população 2007 e estimativas da população 2007. Brasília: Instituto Brasileiro de Geograia e Estatística; 2008.
10. Nahas MIP. Metodologia de construção de índices e indicadores sociais como instrumentos balizadores da gestão municipal da qualidade de vida urbana: uma síntese da experiência de Belo Horizonte. In: Hogan DJ, Baeninger R, Cunha JMP, Carmo RL (Orgs). Migração e ambiente nas aglomerações urbanas. Campinas: UNICAMP, 2001. p. 461-487.
11. World Health Organization. Physical status: The use and Interpretation of Anthropometry. Geneva; 1995. 12. Nutrition Screening Initiative. Nutrition interventions manual for professionals caring for older Americans. Washington: The Nutrition Screening Initiative, 1994. 13. World Health Organization. Waist circumference and waist-hip ratio: report of WHO expert consultation. Geneva; 2008.
14. Brasil. Ministério da Saúde. Secretaria de Atenção à Saúde. Departamento de Atenção Básica. Guia Alimentar para População Brasileira. Brasília: Ministério da Saúde; 2010.
15. Santos RD; Sociedade Brasileira de Cardiologia. III Diretrizes Brasileiras Sobre Dislipidemias e Diretriz de Prevenção da Aterosclerose do Departamento de Aterosclerose da Sociedade Brasileira de Cardiologia. Arq Bras Cardiol 2011; 77: 1-48.
16. Martins APB, Levy RB, Claro RM, Moubarac JC, Monteiro CA. Participação crescente de produtos ultraprocessados na dieta brasileira (1987-2009). Rev Saúde Pública 2013; 47: 656-65.
17. Leung CW, Ding EF, Catalano PJ, Vilamor E, Rimm EB, Willet WC. Dietary intake and dietary quality of low-income adults in the Supplemental Nutrition Assistance Program. Am J Clin Nutr 2012; 96(5): 977-88.
18. Brug J. Determinants of healthy eating: motivation, abilities and environmental opportunities. Fam Pract 2008; 25: i50-5.
19. World Health Organization. Obesity: preventing and managing the global epidemic. Geneva; 2000. 20. World Health Organization. Global strategy on diet,
physical activity and health. Geneva: World Health Organization, 2004.
21. Ferreira VA, Magalhães R. Obesidade e pobreza: o aparente paradoxo. Um estudo com mulheres da Favela da Rocinha, Rio de Janeiro, Brasil. Cad Saúde Pública 2005; 21: 1792-800.
22. Hendrickson D, Smith C, Eikenberry N. Fruit and vegetable access in four low income food deserts communities in Minnesota. Agric Human Values 2006; 23: 371-83.
23. Walker RE, Keane CR, Burke JG. Disparities and access to healthy food in the United States: a review of food deserts literature. Health Place 2010; 16: 876-84. 24. Duran AC, Diez Roux AV, Latorre MR, Jaime PC.
Neighborhood socioeconomic characteristic and diferences in the availability of healthy food stores and restaurants in Sao Paulo, Brazil. Health & Place 2013; 23: 39-47.
25. Franco M, Diez Roux AV, Glass TA, Caballero B, Brancati FL. Neighborhood characteristics and availability of healthy foods in Baltimore. Am J Prev Med 2008; 35: 561-7. 26. Popkin BM. What can public health nutritionists
do to curb the epidemic of nutrition-related noncommunicable disease? Nutr Rev 2009; 67: 79-82. 27. Sanches MZ, Canella DS, Duran ACFL, Jaime PC.
Disponibilidade de informação nutricional em restaurantes no município de São Paulo. Demetra 2013; 8(1): 9-22. 28. Schulze MB, Manson JE, Ludwig DS, Colditz GA,
Stampfer MJ, Willet WC, et al. Sugar-sweetened beverages, weight gain, and incidence of type 2 diabetes in young and middle-aged women. JAMA 2004; 292: 927-34.
29. Wang Y, Beydoun MA. Meat consumption is associated with obesity and central obesity among US adults. Int J Obes 2009; 33(6): 621-8.
30. Campos GWS, Barros RB, Castro AM. Avaliação de política nacional de promoção da saúde. Ciên Saúde Coletiva 2004; 9(3): 745-749.
Received on: 11/11/2013