482
Original Article
Comparison of LDL-Cholesterol Direct Measurement
with the Estimate Using the Friedewald Formula
in a Sample of 10,664 Patients
Caio Maurício Mendes de Cordova, Carlos Rudi Schneider, Iara Deise Juttel,
Maurício Mendes de Cordova
Blumenau, SC - Brazil
Departamento de Ciências Farmacêuticas/FURB and Laboratório Santa Isabel de Análises Clínicas, Blumenau, SC
Mailing addrress: Caio M. M. de Cordova - Departamento de Ciências Farmacêuticas/FURB, Campus III - Rua Antônio da Veiga, 140 - CP 1507 Cep 89010-971 - Blumenau, SC, Brazil
E-mail: [email protected]
Received for publication: 09/10/2003 Accepted for publication: 02/18/2004 English version by Stela Maris Costalonga
Objective
To compare direct measurement of LDL-cholesterol (LDL-C) determined by a homogeneous method with LDL-cholesterol es-timation determined by the Friedewald formula in a large hete-rogeneous population.
Methods
The measurements of total cholesterol (TC) and triglycerides (TG) were performed using traditional enzymatic methods. The measurements of HDL-C and LDL-C were performed using direct methods with no precipitation, and the estimation of the LDL-C fraction was calculated using the Friedewald formula.
Results
On linear regression analysis, the 2 methods had extremely significant correlation coefficients (P < 0.001). However, the Friedewald formula had a positive bias in regard to the direct method, more pronounced with TC levels > 201 mg/dL. This positive bias also occurred in regard to TG levels ≤ 150 mg/dL. No bias was observed between the methods for TG levels ranging from 151 to 200 mg/dL and from 201 to 300 mg/dL. On the other hand, for TG levels ranging from 301 to 400 mg/dL, this bias of the Friedewald formula became negative.
Conclusion
The Friedewald formula did not have a homogeneous per-formance for estimating LDL-C levels in samples with different TG levels as compared with that of the direct method, what could launch doubts on patients classification on the risk of developing coronary artery disease.
Key words
cholesterol, LDL-C, direct LDL, Friedewald formula
Coronary artery disease accounts for the greatest number of deaths of adult individuals worldwide 1. Several studies have shown
the correlation existing between the increased levels of cholesterol in low-density lipoproteins (LDL-C) and the risk of developing that disease2,3. The III Brazilian Consensus on Dyslipidemias stratifies
the following ranges of LDL-C levels for assessing the risk of develo-ping coronary artery disease: desirable, below 130 mg/dL; border-line, between 130 and 159 mg/dL; and high, above 160 mg/dL 4.
These ranges are very narrow, and the National Cholesterol Educa-tion Program (NCEP) established that clinical laboratories should use methodologies for measuring LDL-C levels with a total analyti-cal error < 12%, imprecision < 4%, and inaccuracy < 4% 1. The
reference method for determining LDL-C is β-quantitation5, which
requires ultracentrifugation of the samples, which is not feasible in laboratory routine. Therefore, most laboratories estimate LDL-C levels with the Friedewald formula, based on the concentrations of total cholesterol, the cholesterol present in high-density lipo-proteins (HDL-C), and triglycerides 6. However, the error of
deter-mining LDL-C through that estimation comprises the addition of the analytical errors of the 3 parameters used in the calculus, which usually does not meet the NCEP criteria for total error. In addition, the use of that formula has severe limitations and cannot be applied to samples containing triglyceride (TG) levels > 400 mg/dL, to samples with chylomicrons, and to samples of patients with dysbetalipoproteinemia (Fredrickson Type III) 7. Some authors
have demonstrated that that formula should not be used in certain groups of patients, such as patients with diabetes, hepatopathies, or nephropathies, even with triglyceride levels < 400 mg/dL 8.
Recently, several homogeneous methods have been developed by different manufacturers for the direct measurement of LDL-C levels, expecting that the NCEP criteria are met, as well as that the medical community’s need to prevent coronary artery disease and myocardial infarction are fulfilled. These methods seem to be better than the previous ones that use selective chemical precipi-tation or immunoprecipiprecipi-tation, which are laborious and have a significant bias as compared with the reference method 7, 9.
483
Methods
This study assessed the blood samples of 10,664 patients who sought our laboratory to undergo total cholesterol, LDL-C, HDL-C, and triglyceride measurements from January 2000 to December 2002. Their ages ranged from 14 to 93 years; 5,846 (54.82%) were females, and 4,818 (45.18%) were males. Blood samples were collected after a 12- to 14-hour fast, incubated in a hot-water bath for 15 minutes for coagulation, and centrifuged at 2,000 x g for 5 minutes. The serum was separated and the assays were performed on the same day of sample collection.
The measurements of the triglycerides and total cholesterol were performed with the reagents Triglycerides FS (DiaSys Diag-nostic Systems GmbH & Co. KG, Holzheim, Germany), and Cho-lesterol (BioSystems S.A., Barcelona, Spain), respectively, ac-cording to the specifications of the manufacturers, in a Spectrum CCX II device (Abbott Diagnostics, Abbott Park, IL, USA). The tests were calibrated with the CCX Multicalibrator Set (Abbott), with curves of 3 points.
The LDL-C measurement with the homogeneous method was performed with the reagent LDL-C Select FS (DiaSys), according to the specifications of the manufacturer. The method is based on the selective protection of LDL-C with the addition of reagent 1 [Good’s buffer, pH 6.8, 22 mmol/L, cholesterol esterase ≥
2 kU/L, cholesterol oxidase ≥ 2 kU/L, N-(2-hydroxy-3-sulfopropyl)-3,5-dimethoxyaniline (H-DAOS) 0.43 mmol/L, catalase ≥ 400 kU/L, final concentrations]. The cholesterol of the other lipopro-teins is processed by cholesterol oxidase, and the hydrogen peroxide formed is broken down by catalase. After 5 minutes, with the addition of reagent 2 (Good’s buffer, pH 7.0, 22 mmol/L, 4-ami-noantipyrine 0.68 mmol/L, peroxidase ≥ 3 kU/L, final concentra-tions), LDL-C is released for enzymatic processing and development by the Trinder reaction. All reagents are stable fluids. According to the manufacturer, no interference occurs with triglyceride levels up to 1,000 mg/dL, bilirubin up to 50 mg/dL, hemoglobin up to 500 mg/dL, or ascorbic acid up to 50 mg/dL. The tests were performed using special programming in a Spectrum CCX II device (Abbott) calibrated with TruCal (DiaSys).
For samples with triglyceride levels < 400 mg/dL, the LDL-C level was estimated using the Friedewald formula: LDL-C = TC – HDL-C – (TG/5) 6.
The HDL-C measurement was performed using a homogeneous method without precipitation with the HDL-C Immuno FS reagent (DiaSys). The method is based on the formation of immunocom-plexes of LDL and VLDL lipoproteins and chylomicrons with human anti-β lipoprotein antibodies after the addition of reagent 1 (Good’s buffer, pH 7.0, 26 mmol/L, 4-aminoantipyrine 0.60 mmol/L, pe-roxidase 1,600 U/L, ascorbate oxidase 1,800 U/L, final concen-trations, and sheep antibodies anti human-β lipoproteins). Then, enzymatic processing of HDL-C occurred with the addition, after 5 minutes, of reagent 2 [Good’s buffer, pH 7.0, 26 mmol/L, cho-lesterol esterase 800 U/L, chocho-lesterol oxidase 4,000 U/L, sodium N-ethyl-N-(2-hydroxy-3-sulfopropyl)-3,5-dimethoxy-4-fluoroaniline 0.16 mmol/L]. All reagents are stable fluids. According to the manufacturer, no interference occurs with triglyceride levels up to 1,200 mg/dL, bilirubin up to 40 mg/dL, hemoglobin up to 500 mg/dL, or ascorbic acid up to 50 mg/dL. The tests were performed using special programming in a Spectrum CCX II device (Abbott) calibrated with TruCal (DiaSys).
The coefficient of variation of the tests performed was deter-mined by analysis of the results obtained during 20 consecutive days using Accumark control serum aliquots (Sigma Diagnostics, St. Louis, MO, USA), 111K6403 lot.
The comparison between the LDL-C measurement methods, homogeneous and estimation through the Friedewald formula, was performed according to the Passing and Bablok method 10,
using analysis of correlation expressed by the equation y = bx + a, where bis the gradient of the line and represents the propor-tional error, and ais the intersection in the y axis and represents the constant error. To improve the comparison between the me-thods, the samples were stratified according to total cholesterol levels (70-150 mg/dL, 151-200 mg/dL, 201-250 mg/dL, and 251-550 mg/dL) and to triglyceride levels (≤ 150 mg/dL, 151-200 mg/dL, 201-300 mg/dL, and 301-400 mg/dL).
The statistical analysis of the results was performed with the aid of GraphPad InStat and GraphPad Prism software (San Diego, CA, USA). The significance level adopted was P < 0.05. Mean, standard deviation, and coefficient of variation were calculated with the aid of Excel software (Microsoft).
Results
The coefficient of variation of the LDL-C measurement using the homogeneous method was 4%. The coefficients of variation of the total cholesterol, triglyceride, and HDL-C measurements were 3%, 4%, and 3%, respectively. In regard to LDL-C measuments, the National Cholesterol Education Program (NCEP) re-commends imprecision ≤ 4% 1. The measurements performed in
our laboratory met that criterion.
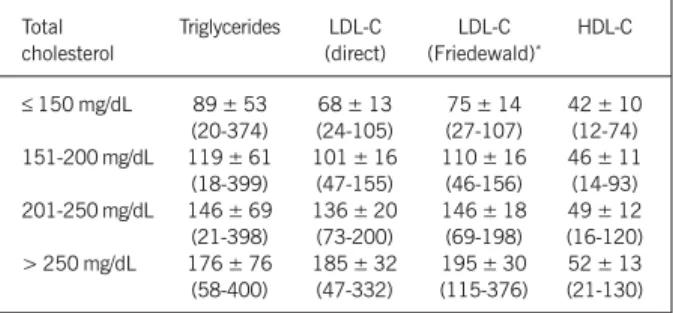
The concentrations of total cholesterol and lipoproteins obtained in this study in regard to the different triglyceride levels are shown in table I. The concentrations of triglycerides and lipoproteins in regard to the different levels of total cholesterol are shown in table II.
The comparison of the methods [homogeneous LDL-C (x) versus calculated LDL-C (y)] resulted in the following regression equations:
y = 0.6905 x+ 27.9, for total cholesterol levels between 70 and 150 mg/dL; y = 0.6387 x + 44.8, for total cholesterol levels between 151 and 200 mg/dL; y = 0.6039 x+ 63.7, for total cholesterol levels between 201 and 250 mg/dL; and y = 0.7256 x
484
dL (6.5% ± 10.5%), respectively. The results of these comparisons are summarized in table III and figure 1.
The comparison of the methods [homogeneous LDL-C (x) versus calculated LDL-C (y)] resulted in the following regression equations:
y = 0.9746 x+ 17.6, for triglyceride levels ≤ 150 mg/dL; y = 0.9593x+ 12.6, for triglyceride levels between 151 and 200 mg/ dL;y = 0.9459 x+ 6.7, for triglyceride levels between 201 and 300 mg/dL; and y = 0.8999 x- 0.1, for triglyceride levels between 301 and 400 mg/dL. In those different triglyceride levels, the correla-tion coefficients between the methods of 0.9426, 0.9332, 0.9345, and 0.9072, respectively, were extremely significant (< 0.001). However, the LDL-C estimate using the Friedewald formula also tends towards producing greater results as compared with those obtained in LDL-C measurements through the homogeneous method for triglyceride levels up to 150 mg/dL, in which a mean difference of 14 ± 13 mg/dL (12.8% ± 9.2%) was found, with a constant error of +17.6 mg/dL, and a proportional error of –3%. With trigly-ceride levels between 151 and 200 mg/dL, this deviation tends towards decreasing, with a mean difference of 7 ± 14.5 mg/dL (5.3% ± 9.5%), a proportional error of -4%, and a constant error of +12.6 mg/dL. With triglyceride levels between 201 and 300 mg/dL, this deviation almost does not exist: 2 ± 15.3 mg/dL (0.8% ± 10%), with a proportional error of -5% and a constant error of +6.7 mg/dL. On the other hand, with triglyceride levels between 301 and 400 mg/dL, the LDL-C estimate with the Friedewald formu-la tends towards producing lower values, with a mean difference of -16 ± 19.4 mg/dL (-10.3% ± 12.4%), as compared with the LDL-C measurement using the homogeneous method, in which a
proportional error of -10% and a constant error of -0.1 mg/dL are observed (tab. III and fig.2).
Discussion
This study aimed at assessing the performance of a homoge-neous method for direct LDL-C measurement, as compared with the LDL-C estimate by using the Friedewald formula. Despite the technological innovations, the Friedewald formula continues to be used in many laboratories, and its application has been recom-mended by the III Brazilian Consensus on Dyslipidemias for samples with triglyceride levels up to 400 mg/dL. However, as already reported by other authors 9,11-17 and ourselves, the homogeneous
methods and the Friedewald formula are not capable of providing identical results. This conclusion is also evident when the results of the samples of this study are analyzed according to their res-pective levels of total cholesterol and triglycerides.
Assessing the results according to the different levels of total cholesterol, the LDL-C estimate through the Friedewald formula was observed to have an extremely significant correlation (P <
0.001), as compared with the direct method (tab. II). However, the correlation coefficients between the 2 methods are not extre-mely close (0.6105 to 0.7822) (tab. III). In fact, the Friedewald formula has a positive deviation or bias in regard to the direct method. This bias is neither very pronounced with total cholesterol levels between 70 and 150 mg/dL (mean deviation of 7 ± 21 mg/ dL), nor with total cholesterol levels between 151 and 200 mg/dL (8 ± 14.5 mg/dL). But, from total cholesterol levels between 201 and 250 mg/dL onwards, this deviation tends towards increasing, with a mean of 10 ± 15.3 mg/dL. Similarly, with total cholesterol levels > 250 mg/dL, a positive bias of 10 ± 20.4 mg/dL occurs. Therefore, if a patient had an LDL-C level of 125 mg/dL on the direct method, the result by using the estimate of the Friedewald formula could be 139 mg/dL (fig. 1B), considering the linear re-gression equation obtained for total cholesterol levels between 201 and 250 mg/dL (y = 0.6039 x + 63.7). Therefore, although with no statistical significance, theoretically, LDL-C levels of a part of the population could pass from desirable values (< 130 mg/dL) to borderline values (130-159 mg/dL), which are subject to dietary control and even treatment with statins. Similarly, patients classified as within borderline values through the direct method could pass into the high value range (160-189 mg/dL) through estimate calcula-tion by using the Friedewald formula (fig. 1C).
On the other hand, when assessing the results according to the different levels of triglycerides, a pattern of inversion of that bias is observed (tab. I), although the 2 methods have excellent correlation coefficients (0.9072 to 0.9426) (tab. III). With trigly-ceride levels up to 150 mg/dL, a mean positive bias of 14 ± 13 mg/dL is observed for the Friedewald formula. Therefore, theoreti-cally, even without statistical significance, a patient with triglyce-rides < 150 mg/dL and an LDL-C level of 125 mg/dL, by using the direct method, could have an LDL-C level estimated through the Friedewald formula of 139 mg/dL (fig. 2A), considering the linear regression equation for that triglyceride range (y = 0.9746x + 17.6). That hypothetical patient would pass from a desirable LDL-C value to a borderline value. The same would happen to a patient with an LDL-C level of 150 mg/dL measured by the direct method, who would pass from the range of borderline values to that of high values (164 mg/dL) according to the estimate through the formula. Table I - Summary of the measurements of total cholesterol, LDL-C
(direct), LDL-C (Friedewald), and HDL-C according to triglyceride levels, presented as mean ± standard deviation (lowest level found –
greatest level found)
Triglycerides Total LDL-C LDL-C HDL-C
cholesterol (direct) (Friedewald)*
≤ 150 mg/dL 211 ± 43 126 ± 37 140 ± 39 51 ± 12 (73-452) (24-307) (28-327) (12-103) 151-200 mg/dL 234 ± 42 146 ± 39 153 ± 40 46 ± 10 (106-475) (39-321) (41-376) (18-103) 201-300 mg/dL 241 ± 45 152 ± 42 150 ± 43 40 ± 10 (130-455) (56-332) (37-325) (19-103) 301-400 mg/dL 249 ± 47 157 ± 45 141 ± 45 39 ± 10 (87-393) (40-299) (27-278) (14-79)
> 400 mg/dL 265 ± 54 163 ± 57 - 37 ± 9
(152-523) (57-423) (16-71)
* Applied to samples with triglyceride levels ≤ 400 mg/dL.
Table II - Summary of the measurements of triglycerides, LDL-C (direct), LDL-C (Friedewald), and HDL-C according to total cholesterol
levels, presented as mean ± standard deviation (lowest level found – greatest level found)
Total Triglycerides LDL-C LDL-C HDL-C
cholesterol (direct) (Friedewald)*
≤ 150 mg/dL 89 ± 53 68 ± 13 75 ± 14 42 ± 10
(20-374) (24-105) (27-107) (12-74) 151-200 mg/dL 119 ± 61 101 ± 16 110 ± 16 46 ± 11 (18-399) (47-155) (46-156) (14-93) 201-250 mg/dL 146 ± 69 136 ± 20 146 ± 18 49 ± 12 (21-398) (73-200) (69-198) (16-120) > 250 mg/dL 176 ± 76 185 ± 32 195 ± 30 52 ± 13 (58-400) (47-332) (115-376) (21-130)
485
Several authors reported lower results obtained through the direct methods of LDL-C measurement as compared with those obtained through β-quantitation after ultracentrifugation 11,12.
Others, however, reported that bias with a certain reagent, and a perfect correlation with another reagent, although both used de-tergents, but with different principles 13. The reagents used in
this study follow a principle of detergent protection similar to the method used in the study cited, which reported no bias, as com-pared with the reference method. Some authors have also not found that variation in bias in regard to different levels of triglycerides with a method that also uses specific tensoactive agents 12,
diffe-rently from most direct methods 9, 14-18, which may be due to a
difference in the components of the reagents.
In our study, for triglyceride levels between 151 and 200 mg/ dL, that bias decreased to 7 ± 14.5 mg/dL, and, for triglyceride levels between 201 and 300 mg/dL, that bias almost did not exist (2 ± 15.3 mg/dL).
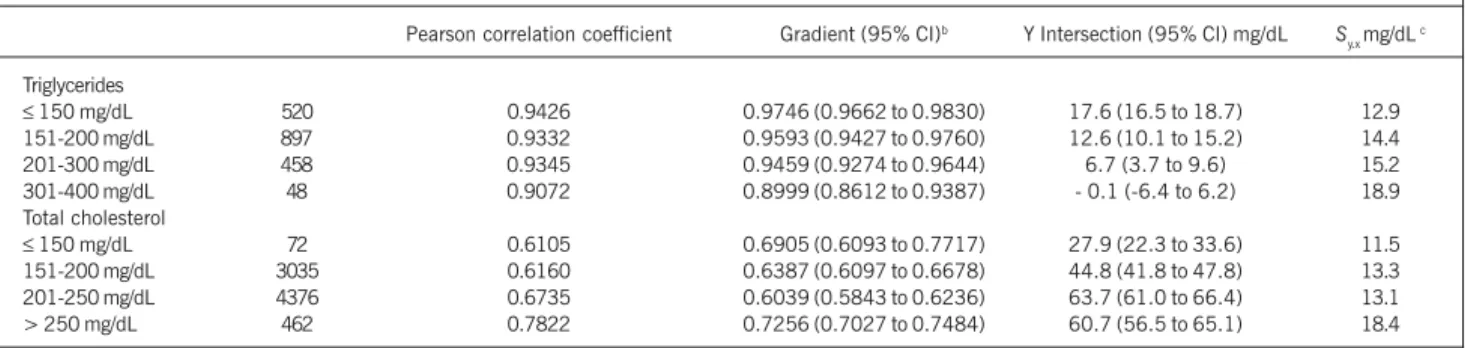
Table III - Summary of the comparison of the direct method for LDL-C measurement with the LDL-C estimate by use of the Friedewald formula, according to the triglyceride and total cholesterol levels, analyzed through linear regression a
Pearson correlation coefficient Gradient (95% CI)b Y Intersection (95% CI) mg/dL S y.x mg/dL
c
Triglycerides
≤ 150 mg/dL 520 0.9426 0.9746 (0.9662 to 0.9830) 17.6 (16.5 to 18.7) 12.9
151-200 mg/dL 897 0.9332 0.9593 (0.9427 to 0.9760) 12.6 (10.1 to 15.2) 14.4
201-300 mg/dL 458 0.9345 0.9459 (0.9274 to 0.9644) 6.7 (3.7 to 9.6) 15.2
301-400 mg/dL 48 0.9072 0.8999 (0.8612 to 0.9387) - 0.1 (-6.4 to 6.2) 18.9
Total cholesterol
≤ 150 mg/dL 72 0.6105 0.6905 (0.6093 to 0.7717) 27.9 (22.3 to 33.6) 11.5
151-200 mg/dL 3035 0.6160 0.6387 (0.6097 to 0.6678) 44.8 (41.8 to 47.8) 13.3
201-250 mg/dL 4376 0.6735 0.6039 (0.5843 to 0.6236) 63.7 (61.0 to 66.4) 13.1
> 250 mg/dL 462 0.7822 0.7256 (0.7027 to 0.7484) 60.7 (56.5 to 65.1) 18.4
aIn the form of y = ax + b, where y = calculated LDL (Friedewald); x = direct LDL; a = gradient of the line; b = y intersection; b CI: confidence interval; cstandard
deviation of the residues y.x
Calculated LDL (mg/dL)
Total cholesterol 70-150 mg/dL
LDL measured (mg/dL) 125
100
75
50
25
0
20 30 40 50 60 70 80 90 100 110
Total cholesterol 201-250 mg/dL
Calculated LDL (mg/dL)
250
200
150
100
50
0
50 75 100 125 150 175 200 225
LDL measured (mg/dL)
Total cholesterol 251-550 mg/dL
Calculated LDL(mg/dL)
400
300
200
100
0
0 50 100 150 200 250 300 350
LDL measured (mg/dL)
A
B
C
Fig. 1 - Graphic representation of the comparison of LDL-C measurement by use of the homogeneous method with LDL estimate by use of the Friedewald formu-la, in the following total cholesterol ranges: 70-150 mg/dL (A); 201-250 mg/dL (B); and > 251-550 mg/dL (C).
Calculated LDL (mg/dL)
Triglycerides <150 mg/dL
LDL measured (mg/dL) 400
300
200
100
0
0 25 50 75 100 125 150 175 200
Triglycerides 151-200 mg/dL
Calculated LDL (mg/dL)
400
300
200
100
0
0 25 50 75 100 125 150 175 200 LDL measured (mg/dL)
Triglycerides 201-300 mg/dL
Calculated LDL (mg/dL)
400
300
200
100
0
0 25 50 75 100 125 150 175 LDL measured (mg/dL)
A
B
C
Fig. 2 - Graphic representation of the comparison of LDL-C measurement by use of the homogeneous method with LDL estimate by use of the Friedewald formu-la, in the following triglyceride ranges: up to 150 mg/dL (A); 151-200 mg/dL (B); 201-300 mg/dL (C); and 301-400 mg/dL (D).
225 250 275 300 325 350
225 250 275 300 325 350
200 225 250 275 300 325 350
Calculated LDL (mg/dL)
LDL measured (mg/dL)
D Triglycerides 301-400 mg/dL
486
On the other hand, in the samples with triglyceride levels between 301 and 400 mg/dL, that bias of the Friedewald formula became negative, with a mean deviation of -16 ± 19.4 mg/dL. This way, as can be demonstrated with our results, a patient with triglyceride levels between 301 and 400 mg/dL and an LDL-C level measured through the direct method of 140 mg/dL could theoretically have an LDL-C level estimated through the Friedewald formula of 126 mg/dL (fig. 2D), considering the linear regression equation for that range of triglyceride levels (y = 0.8999x – 0.1), although no statistical significance was observed. The patient would pass from a borderline LDL-C value to a desirable LDL-C value. The same would happen to a patient with an LDL-C level of 170 mg/dL measured through the direct method, who would pass from the range of high values to the range of borderline values (153 mg/dL).
According to other authors 13,19, one explanation for these
higher LDL-C levels obtained through the direct method as com-pared with those obtained through the Friedewald formula could be the difference in the triglyceride/cholesterol ratio in the VLDL particles in patients with types IIb, III, and IV Fredrickson dyslipi-demias. Triglyceride-rich VLDL particles could induce a negative bias in the direct methods 13. Cholesterol-rich VLDL particles
could induce a positive bias 19. However, this would not explain
the positive bias of the direct method in patients with high trigly-ceride levels in our study.
Another explanation would be the possibility of measuring the cholesterol present in the particles of intermediate-density lipo-proteins (IDL), such as LDL-C, in patients with type III Fredrickson dyslipidemia through some direct methods 13. This could be
hap-pening with the method in question, but that hypothesis cannot explain the tendency in all patients with triglyceride levels between 301 and 400 mg/dL, shown in our study. In fact, as reported by those authors, those patients with type III dyslipidemia would tend to be erroneously classified as type IIb using the direct method for measuring LDL-C, overestimating the LDL-C fraction. However, the estimate through the Friedewald formula does not help in the correct classification, overestimating the VLDL fraction (triglyce-rides/5), because it cannot indicate the presence of IDLs, which could also be suspected only because of the high triglyceride levels. In the specific case of patients with type III dyslipidemia, good communication between the clinician and the laboratory is an excellent contribution to the diagnosis, because the latter would be able to determine whether the method used may overestimate the LDL-C fraction, in the case of the direct method, or the VLDL fraction, in the case of estimate through the Friedewald formula. For LDL-C estimate, the Friedewald formula standardizes the value of the VLDL fraction as the triglyceride level divided by 5. However, the particles found in patients with hypertriglyceridemia (types IIb, III, IV, and V) are usually a heterogeneous mixture of remaining chylomicrons, VLDL, and remaining VLDL (IDLs). As is already known, the triglyceride/cholesterol ratio varies a lot within that range of particles. In fact, according to our results, the LDL-C estimate through the Friedewald formula has good performance in samples with triglyceride levels between 151 and 300 mg/dL, as compared with the direct method. However, in the extremes of that range, in the samples with triglyceride levels < 150 mg/ dL and between 301 and 400 mg/dL, the formula does not have good performance. In fact, according to some authors, the
Frie-dewald formula may erroneously classify up to 25% of the patients with triglyceride levels between 301 and 400 mg/dL 13. That
percentage may be even higher, depending on the method used for measuring HDL-C levels.
Thus, patients with triglyceride levels < 150 mg/dL and desi-rable LDL-C levels measured through the direct method could be being treated based on an LDL-C level estimated through the Friedewald formula. On the other hand, patients with triglyceride levels between 301 and 400 mg/dL and borderline or high LDL-C levels measured through the direct method would not be receiving the appropriate treatment with the results obtained through the use of the Friedewald formula. Obviously, the limits of LDL-C levels for risk classification for coronary artery disease are very narrow, but as those are the values recommended by the III Brazilian Consensus on Dyslipidemias 4, the clinical laboratory should strive
to perform the measurement of that fraction with the best possible diagnostic performance, ie, with the lowest coefficient of variation, and with the best likelihood of correctly classifying the patients for assessing the risk for coronary artery disease.
This study, analyzing a sample with more than 10,000 patients, demonstrated that the direct method used for measuring LDL-C has very good performance, with good reproducibility and a coef-ficient of variation within the requirements of the NCEP, which is hardly obtained with the Friedewald formula. It is worth noting, however, that although one of the objectives was to discuss that the 2 methods do not have identical results, it is still a consensus that the Friedewald formula may be used in patients with trigly-ceride levels up to 400 mg/dL, who have neither chylomicrons, nor IDLs (type III of the Fredrickson classification) 4,20. In fact,
many laboratories still continue to estimate LDL-C levels by using that formula, because of the costs of the reagents for the existing direct LDL-C measuring methods. With a decrease in those costs and a better assessment of the performance of the reagents, the direct methods tend to be more widely used in laboratories, pro-viding a better classification of the patients, with more reliable LDL-C level results, according to the NCEP criteria. Certain popu-lations would benefit extremely by the use of the direct methods, such as diabetic patients, who are naturally prone to developing coronary artery disease, and whose LDL-C levels are not correctly estimated with the Friedewald formula 8.
In the future, new methods may be implemented for determi-ning LDL-C levels, such as one recently described, which is reagent-free and based on infrared spectrophotometric absorption of lipo-proteins21. That method had excellent performance, and its
as-sessment may shed light on the debate about the introduction of new methods for LDL-C measurement.
Recently, some authors reported that 2 direct methods for LDL-C measurement did not have good retrieval of the small, dense LDL subtype (sdLDL), previously separated by ultracentrifu-gation22. The determination of that LDL subtype levels has been
implicated as a more sensitive factor for assessing the risk of developing coronary artery disease than the determination of total LDL-C has. Methods for the routine sdLDL measurement are still being developed, but, in the near future, the laboratories may also be including that parameter in the lipid and lipoprotein profile available for clinicians 23.
ex-487
1. NCEP. National Cholesterol Education Program. Second report of the expert panel on detection, evaluation and treatment of high blood cholesterol in adults (Adult Treatment Panel II). Circulation 1994; 89:1329-1345.
2. Grundy SM. Role of low-density lipoproteins in atherogenesis and development of coronary heart disease. Clin. Chem. 1995; 41:139-146.
3. Gordon T, Kannel WB, Castelli WP et al. Lipoproteins, cardiovascular disease and death. The Framingham Study. Arch. Intern. Med. 1981; 141:1128-1130. 4. SBC. Sociedade Brasileira de Cardiologia. Resumo das III Diretrizes Brasileiras
sobre Dislipidemias e Diretriz de Prevenção da Aterosclerose da Sociedade Brasi-leira de Cardiologia. Arq. Bras. Cardiol. 2001; 77:1-48.
5. Bachorik PS. Measurement of low density lipoprotein cholesterol. In: Rifai N, Warnick GR, Dominiczak MH, eds. Handbook of Lipoprotein Testing. Washington DC: AACC Press, 1997:145-160.
6. Friedewald WT, Levi RI, Fredrickson DS. Estimation of the concentration of low density lipoproteins cholesterol in plasma without use of the ultracentrifuge. Clin. Chem. 1972; 18:499-502.
7. McNamara JR, Conh JS, Wilson PWF et al. Calculated values of low-density lipo-protein in the assessment of lipid abnormalities and coronary disease risk. Clin. Chem. 1990; 36:36-42.
8. Rubies-Prat J, Reveré RJ, Senti M et al. Calculated low-density lipoprotein choles-terol should not be used form management of lipoprotein abnormalities in pa-tients with diabetes mellitus. Diabetes Care 1993; 16:1081-1086.
9. Harris N, Neufeld E, Newburgwe JW et al. Analytical performance and clinical uti-lity of a direct LDL-cholesterol assay in a hyperlipidemic pediatric population. Clin. Chem. 1996; 42:1182-1188.
10. Passing H, Bablock W. Comparison of several regression procedures for method comparison studies and determination of sample size. J. Clin. Chem. Biochem. 1984; 22:431-445.
11. Rifai N, Iannoti E, DeAngelis K et al. Analytical and clinical performance of a ho-mogeneous enzymatic LDL-cholesterol assay compared with ultracentrifugation-dextran sulfate-Mg2+ method. Clin. Chem. 1998; 44:1242-1250.
12. Nauck M, Graziani MS, Bruton D et al. Analytical and clinical performance of a
References
detergent-based homogeneous LDL-cholesterol assay: a multicenter evaluation. Clin. Chem. 2000; 46:506-514.
13. Esteban-Salán M, Guimón-Berdesi A, de la Viuda-Unzueta JM et al. Analytical and clinical evaluation of two homogeneous assays for LDL-cholesterol in hyperli-pidemic patients. Clin. Chem. 2000; 46:1121-1131.
14. Yu HH, Ginsbrug GS, Harris N et al. Evaluation and clinical application of a direct low density lipoprotein cholesterol assay in normolipemic and hyperlipidemic adults. Am. J. Cardiol 1997; 80:1295-1299.
15. Sheikh M, Miller NE. Evaluation of commercial reagent for precipitating human serum low density lipoprotein. Clin. Chem. Acta 1985; 152:213-217. 16. Demacker PN, Hijmans AG, Brenninkmeijer BJ et al. Five methods for determining
low density lipoprotein cholesterol compared. Clin. Chem. 1984; 30:1797-1800. 17. Assmann G, Jabs HU, Nolte W et al. Precipitation of LDL with sulphopolyanions: a comparison of two methods for LDL cholesterol determination. J. Clin. Chem. Clin. Biochem. 1984; 22:781-785.
18. Mulder K, van Leeuwen C, Schouten JA et al. An evaluation of three commercial me-thods for the determination of LDL cholesterol. Clin. Chem. Acta 1984; 143:29-35. 19. Okada M, Matsui H, Ito Y et al. Low-density lipoprotein cholesterol can be
che-mically measured: a new superior method. J. Lab. Clin. Med. 1998; 132. 20. Nauck M, Warnick GR, Rifai N. Methods for measurement of LDL-cholesterol: a
critical assessment of direct measurement by homogeneous assays versus calcu-lation. Clin. Chem. 2002; 48:236-54.
21. Liu KZ, Shaw RA, Man A et al. Reagent-free, simultaneous determination of serum cholesterol in HDL and LDL by infrared spectroscopy. Clin. Chem. 2002; 48:499-506. 22. Usui S, Kakuuchi H, Okamoto M et al. Differential reactivity of two homogeneous LDL-cholesterol methods to LDL and VLDL subfractions, as demonstrated by ul-tracentrifugation and HPLC. Clin. Chem. 2002; 48:1946-54.
23. Le NA. Small, dense low-density lipoprotein: Risk or Mith. Current Atherosclerosis Reviews 2003; 5:22-28.
24. Jensen T, Truong Q, Frandsen M et al. Comparison of a homogeneous assay with a precipitation method for the measurement of HDL cholesterol in diabetic pa-tients. Diabetes Care 2002; 25:1914-8.
cellent performance, with a very low coefficient of variation. In our experience, that method has excellent performance in laboratory routine, is easily automated, and does not suffer from interference, as occurs in precipitation methods 1, which cause additional error
in LDL-C estimated with the Friedewald formula. Other authors 24
reported that, in comparison with the reference method, the direct
method does not provide lower HDL-C levels, as occurs in precipi-tation methods.