Glomerular Filtration and Associated Factors in Hypertensive
Individuals Treated at Primary Care Level
Ana Karina Teixeira da Cunha França¹, Alcione Miranda dos Santos¹, Isabela Leal Calado¹, Elisângela Milhomem
dos Santos¹, Poliana Coelho Cabral², João Victor Leal Salgado¹, Noemia Perli Goldraich
3, Natalino Salgado Filho¹
Universidade Federal do Maranhão¹, São Luís, MA; Universidade Federal de Pernambuco², Recife, PE; Universidade Federal do Rio Grande do Sul3, Porto Alegre, RS - BrazilMailing address: Ana Karina Teixeira da Cunha França • Rua Barão de Itapary, 155, Centro - 65020-070 - São Luís, MA - Brazil E-mail: [email protected]
Manuscript received December 18, 2008; revised manuscript received May 25, 2009; accepted June 22, 2009.
Abstract
Background: In Brazil, arterial hypertension (AH) constitutes one of the main risk factors for chronic kidney disease (CKD). The monitoring of glomerular filtration (GF) is recommended for the assessment of kidney function in hypertensive individuals, as GF decrease precedes symptom onset.
Objective: To assess GF and its associated factors in hypertensive individuals.
Methods: A cross-sectional study was carried out from January to June 2008 in 297 individuals with arterial hypertension (AH) with or without diabetes mellitus (DM), treated at a primary care facility in the city of São Luís, Maranhão. Patients older than 20 years and of both sexes were included in the study. Sociodemographic and nutritional status data, GF rate and microalbuminuria levels in 24-hour urine were assessed, as well as blood pressure, glucose and serum creatinine levels and a lipidogram.
Results: Mean age was 60.6 ± 11.5 years, with a predominance of the female sex (75.1%), overweight/obesity (65.0%) and large waist circumference (60.6%). The prevalence of GF < 60 ml/min was 24.6% in the AH group without DM and 18.3% in the AH group with DM, with no significant difference. For the AH group without DM, there was an association only between reduced GF and age > 65 years, which remained after adjustment. For the AH group with DM, there was an association between reduced GF and age > 65 years, smoking habit and obesity. However, after the adjustment, age and smoking habit remained as associated factors.
Conclusion: In these patients, the prevalence of GF < 60 ml/min was high and after the adjustment, only age > 65 years and smoking habit were shown to be factors associated to GF. This reinforces the need to systematically evaluate GF in hypertensive individuals, aiming at the secondary prevention of chronic kidney disease. (Arq Bras Cardiol 2010;94(6) : 731-738)
Key words: Kidney diseases/therapy/diagnosis; hypertension; hypertension, renovascular; food analysis; disease prevention; diet therapy.
Segura et al4 identified the prevalence of kidney function
deficit in hypertensive individuals (glomerular filtration < 60 ml/min) of 7.6%, using as criterion the measurement of serum creatinine and of 22.3% when they used glomerular filtration (GF) through creatinine clearance. In another study, New et al5 observed a decrease in GF estimated at 31.3% in diabetic
patients versus 6.9% in the general population. Unfortunately, we do not have population studies on CKD in Brazil at the initial stages and the attentions are mainly concentrated on the final stages, when the patient needs dialysis or kidney transplant6.
To adequately evaluate the kidney function is fundamental to attain the diagnosis and establish the adequate treatment for CKD. Therefore, we recommend the monitoring of GF, which is considered the best marker of kidney function in healthy or unhealthy individuals7, considering that its decrease precedes
the onset of kidney failure symptoms.
Considering that the evolution of CKD depends on the quality of the medical care offered long before the
Introduction
Arterial hypertension (AH) is a severe public health problem. It is estimated that more than 30 million Brazilian individuals have AH1, with 12,410,753 of them using the
Brazilian Public Health System (SUS)2. Additionally, more
than one third is unaware of having the disease, and less than one third of the diagnosed hypertensive individuals present adequate pressure levels with the proposed treatment3.
kidney failure onset, it is of utmost importance to estimate the prevalence of this disease at its initial stages - mostly asymptomatic ones -, which can help the development of policies aimed at its prevention and control. Furthermore, knowing the associated factors and attaining the early diagnosis of CKD allows the establishment of adequate treatment and prevents the progression to the final stage of the disease, of which therapy requires dialysis or kidney transplant.
The present study aims at assessing GF and associated factors in hypertensive individuals with or without diabetes treated at primary care level, as they are considered high-risk for the development of CKD.
Methods
A cross-sectional analytical study was carried out with hypertensive patients, with or without diabetes, from January to June 2008; the patients were recruited through the Program for Patients with Hypertension and Diabetes (HyperDia Program) of the Ministry of Health, among those being treated at the Basic Health Unit (BHU) of Vila Embratel in São Luís, state of Maranhão, Brazil.
The present study was approved by the Ethics Committee of Hospital Universitário of the Federal University of Maranhão (Protocol #1977/2007), according to the ethical norms established for research involving human subjects.
The sample calculation was carried out considering a population of 559 hypertensive individuals without diabetes mellitus (DM) and 116 hypertensive individuals with DM that participated in the program, with an expected prevalence of GF < 60 ml/min/1.73 m2 of 22.3%, with a 4% margin of error
and a confidence level of 95%. The total number of patients was estimated at 188 hypertensive individuals without DM and 91 with DM. With the objective of correcting eventual losses during the data collection process, we decided to increase the sample by 5%, totaling 307 hypertensive individuals, of which 100 had DM.
This study included hypertensive individuals aged 20 years or older, of both sexes and who agreed to participate. The exclusion criteria were: pregnant women, patients with any type of consumptive chronic disease (cancer or AIDS) and those undergoing SRT.
The selection process was started by obtaining a list from the BHU that contained the names of the hypertensive individuals treated through the HyperDia Program. Subsequently, a simple random selection was carried out by drawing lots, without replacement. The patients were located by the community health agents (CHA) of the Family Health Program (FHP) and when they came to the hospital, they were informed about the study.
The patients that agreed to participate were previously advised on the 24-hour urine collection technique. They were also asked to come to the BHU, on the day of their regular visit, on a 12-hour fast and to bring the collected urine sample. The patients received information on the urine collection technique in person, in addition to written instructions and recipients for the collection.
On the day of the regular visit to the BHU, the patients
initially answered a structured questionnaire that contained sociodemographic data and clinical history. At this moment, the arterial pressure was measured and the nutritional assessment was carried out. A blood sample was also collected and the 24-hour urine sample was received. Subsequently, the biological material (blood and urine) was sent to the Laboratory of Clinical Analysis of the Presidente Dutra University Hospital of the Federal University of Maranhão (HUPD-UFMA).
The level of schooling was evaluated as years of schooling and categorized as < 8 years or > 9 years. The criterion of socioeconomic status classification was categorized in classes.8
Every patient that declared having smoked at any time during his or her life, regardless of the moment and the amount of cigarettes, was considered a smoker. Similarly, patients that reported the consumption of any amount of alcoholic beverages, regardless of the frequency, were considered alcohol consumers.
The arterial pressure (AP) of each patient was measured with a digital sphygmomanometer (Omron™), through the indirect method, with the patient at rest, in the sitting position. Two measurements were performed, the first in the middle of the interview and the second at the end of the interview. The highest AP value was used. Controlled AP was considered when the systolic blood pressure (SBP) was < 140 mmHg and the diastolic blood pressure (DAP) was < 90 mmHg, for hypertensive individuals without associated diabetes and SBP < 130 mmHg and DBP < 80 mmHg for hypertensive individuals with associated diabetes1.
The anthropometric assessment of the patients consisted of measurement of weight (in kilograms), in a portable digital scale (Plena™), and height (in meters), in a stadiometer (Alturexata™). The waist circumference (WC) and the hip circumference (HC) were also measured with an inextensible measuring tape. The WC (in cm) was obtained at midpoint between the last rib and the iliac crest, at the moment of expiration, and the HC (in cm) at the largest perimeter region between the waist and the thigh.
The assessment of the patients’ nutritional status was carried out through the body mass index (BMI), the WC and the waist-to-hip ratio (WHR). The BMI was calculated by dividing the body weight in kilograms by the square height in meters. A cutoff of 25.0 kg/m2 was used for eutrophic, 25.0 to 29.9 kg/
m2 for overweight and ≥ 30.0 kg/m2 for obese individuals. The
WC and WHR were obtained in order to evaluate the pattern of body fat distribution. The WHR was obtained through the ratio between the WC and the HC. The adopted cutoffs for very high risk regarding the WC were 88 cm and 102 cm and high-risk, regarding the WHR, of 0.85 and 1.00 for women and men, respectively, according to the classification of the World Health Organization (WHO)8.
The GF was evaluated through endogenous creatinine clearance in 24-hour urine. The staging of CKD was carried out in five stages, according to the recommendation of the National Kidney Foundation9 (Chart 2).
When a kidney function deficit was identified (GF< 60ml/min), the patients were referred to the Ambulatory of Nephrology of the HUPD-UFMA, a reference service in the city of São Luís, for specialized evaluation and treatment.
The qualitative variables are presented as frequencies and percentages and the quantitative ones as means and standard deviation (mean ± SD). To compare the quantitative variables of the hypertensive group without diabetes with the hypertensive group with diabetes, the Student’s t test was used; for the qualitative variables, the Chi-square test and Fisher’s Exact test were used. The normality of the quantitative variables was analyzed through the Shapiro-Wilk test.
Poisson’s regression model was used to identify the factors associated with GF in each group and the level of significance was established at 5%. The prevalence ratios (PR) and their respective 95% confidence intervals (95%CI) were also estimated.
Chart 1 - Laboratory parameters: analytic methods and reference values
Parameters Methods Normal reference values
Total cholesterol Enzymatic < 200.0 mg/dl1
HDL-cholesterol Roschlan et al > 40.0 mg/dl - AH without DM> 45.0 mg/dl - AH with DM11
LDL-cholesterol Friedewald < 100.0 mg/dl1
Triglycerides Enzymatic < 150.0 mg/dl1
Fasting glycemia Enzymatic < 100.0 mg/dl - Normal
2
90 - 130 mg/dl - Desirable for DM2
Glycated
hemoglobin Immunoturbidimetric < 7.0%2
Serum creatinina Optimized Kinetic U.V. < 1.2 mg/dl3
Creatinine
clearance Immunoturbidimetric > 60 ml/min4 Microalbuminuria Immunoturbidimetric 30.0 - 300.0 mg/day4 Sources: V Brazilian Guidelines of Arterial Hypertension, 20061; American Diabetes Association, 20072; Normal reference value for the method3; National Kidney Foundation, 20024.
Chart 2 - Chronic kidney disease staging
Stage Description min/1.73m²)GF (ml/
I Kidney lesion with normal or increased GF > 90 II Kidney lesion with mild GF decrease 60-89 III Kidney lesion with moderate GF decrease 30-59 IV Kidney lesion with marked GF decrease 15-29 V Functional kidney failure or undergoing SRT < 15
SRT- substitutive renal therapy. Source: National Kidney Foundation, 2002.
The variables that presented p value < 0.20 were considered in Poisson’s multivariate regression model. The selection of variables was carried out by the stepwise method by elimination. Only the variables with a p value < 0.10 remained in the final model. The data were analyzed using the statistical program STATA 9.0.
This study received financial support from the Fundação de Amparo à Pesquisa e ao Desenvolvimento Científico e Tecnológico do Maranhão (FAPEMA - The Foundation for The Support of Research and Scientific and Technological Development of the State of Maranhão).
Results
A total of 297 hypertensive individuals that participated in the HyperDia Program and were treated at a BHU in São Luís were evaluated. There was a loss of 3.3% (n=10) due to lack of data for the analysis of kidney function or refusal to participate in the study. Thus, the final sample consisted of 199 hypertensive patients without DM and 98 with DM, according to the files of the HyperDia Program.
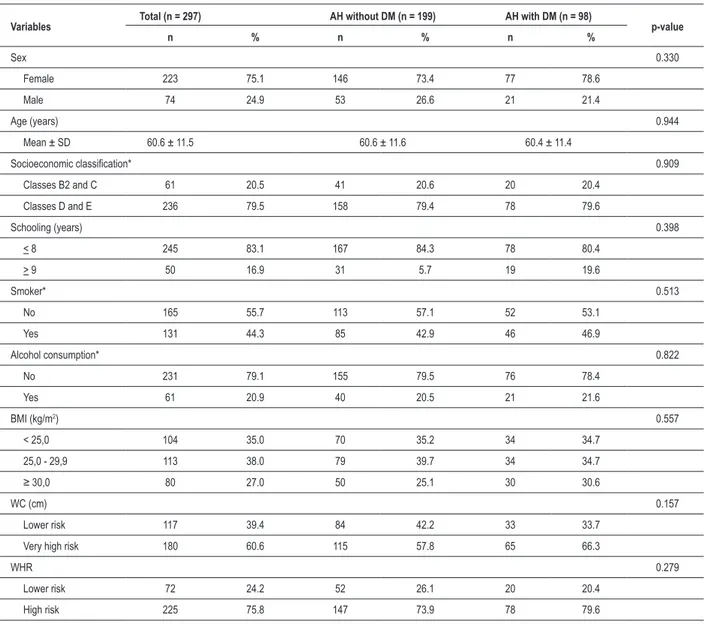
The mean age was 60.6 ± 11.5 years and there was a predominance of the female sex (75.1%), fewer than 9 years of schooling (83.1%) and socioeconomic classes D and E (79.5%). The percentage of smokers was 44.3% and of alcohol consumers was 20.9% (Table 1). The consumption of alcohol was associated with age < 65 years for the hypertensive individuals with DM (p = 0,046).
A higher prevalence of overweight (38.0%) and obese (27.0%) individuals was observed, according to the BMI. Among the obese hypertensive individuals, 85.3% were aged < 65 years and there was a significant association (p= 0.002). The distribution of abdominal fat was altered in 60.6% according to the WC and in 75.8% according to the WHR (Table 1).
As for the sociodemographic and anthropometric characteristics (Table 1), no statistically significant differences were observed between the AH group without DM and the AH group with DM.
The mean SBP and DBP values were 149.9 ± 1.7 mmHg and 89.2 ± 0.9 mmHg for the AH group without DM and 145.5 ± 2.0 mmHg and 86.5 ± 1.0 mmHg for the AH group with DM, respectively. There was a statistically significant difference (p < 0.0001).
The GF predominated within the interval between 60 and 89 ml/min/1.73 m2 for both groups. The percentage of
reduced GF (< 60 ml/min/1.73m2) was 24.6% in the AH group
without DM and 18.3% in the AH with DM. No statistically significant difference was observed regarding GF between the two groups (Table 2).
In patients with reduced GF (< 60 ml/min/1.73 m2), serum
creatinine was altered (> 1.2 mg/dl) in only 20.4% in the AH group without DM and in 44.4% in the other group (data not presented in a table).
In the AH group without DM, only age > 65 years (PR = 2.20; 95%CI = 1.24-3.90) presented a significant association with reduced GF (< 60 ml/min/1.73 m2). In the AH group
Table 1 - Demographic, socioeconomic and anthropometric characteristics of hypertensive individuals undergoing treatment
Variables Total (n = 297) AH without DM (n = 199) AH with DM (n = 98) p-value
n % n % n %
Sex 0.330
Female 223 75.1 146 73.4 77 78.6
Male 74 24.9 53 26.6 21 21.4
Age (years) 0.944
Mean ± SD 60.6 ± 11.5 60.6 ± 11.6 60.4 ± 11.4
Socioeconomic classiication* 0.909
Classes B2 and C 61 20.5 41 20.6 20 20.4
Classes D and E 236 79.5 158 79.4 78 79.6
Schooling (years) 0.398
< 8 245 83.1 167 84.3 78 80.4
> 9 50 16.9 31 5.7 19 19.6
Smoker* 0.513
No 165 55.7 113 57.1 52 53.1
Yes 131 44.3 85 42.9 46 46.9
Alcohol consumption* 0.822
No 231 79.1 155 79.5 76 78.4
Yes 61 20.9 40 20.5 21 21.6
BMI (kg/m2) 0.557
< 25,0 104 35.0 70 35.2 34 34.7
25,0 - 29,9 113 38.0 79 39.7 34 34.7
≥ 30,0 80 27.0 50 25.1 30 30.6
WC (cm) 0.157
Lower risk 117 39.4 84 42.2 33 33.7
Very high risk 180 60.6 115 57.8 65 66.3
WHR 0.279
Lower risk 72 24.2 52 26.1 20 20.4
High risk 225 75.8 147 73.9 78 79.6
* n measured lower than total n; AH - arterial hypertension; DM - diabetes mellitus; Socioeconomic classiication - Brazilian Association of Survey Enterprises (ABEP); BMI - body mass index; WC - waist circumference; WHR - waist-to-hip ratio.
Table 2 - Glomerular iltration of hypertensive individuals undergoing treatment
GF
ml/min/1.73m2 stagesCKD
AH without DM (n = 199) AH with DM (n = 98)
p-value
n % n %
> 90 I 69 34.7 33 33.7 0.864
60 - 89 II 81 40.7 47 48.0 0.235
30 - 59 III 45 22.6 18 18.3 0.400
15 - 29 IV 3 1.5 0 0.0
-< 15 V 1 0.5 0 0.0
associated. Still considering this group, alcohol consumption and obesity (PR = 0.21; 95%CI = 0.04-0.93) were more frequent in patients with GF > 60 ml/min/1.73 m2 (Table 3).
At the adjusted analysis for AH group without DM, age > 65 years (PR = 2.20; p = 0.007) remained associated with reduced GF. Similarly, for the other group, only age > 65 years (PR = 5.10; p = 0.005) and smoking status (PR = 2.86; p = 0.073) remained associated.
Discussion
In this study there was a predominance of GF between 60 and 89 ml/min/1.73 m2, which corresponds to stage II
of CKD for both groups. The prevalence of reduced GF (< 60 ml/min/1.73 m2) was 24.6% in the AH group without
DM and 18.3% in the AH group with DM. Kramer et al10,
in Brazil, found a prevalence of 12.7% of reduced GF in diabetic patients, with or without associated AH. European studies demonstrated a prevalence of reduced GF in 22.3% of hypertensive individuals4, in 31.3% of diabetics and in 6.9%
of the general population5.
Although DM is the main cause of patients undergoing SRT in developed countries11, in Brazil 35.8% of the cases
are attributed to AH, followed by diabetes, with 25.7%6. In
the present study, the fact that the hypertensive patient was diabetic did not increase the risk for GF decrease. This situation can be attributed to the more careful monitoring of kidney function in hypertensive patients with associated diabetes5.
The female sex was predominant in the study sample. However, the male sex presented a higher risk for reduced GF in the two groups assessed in the study, although there was no significant association. The predominance of the female sex, a common finding in several studies with hypertensive populations12-15 can be attributed to the fact that women
more frequently seek systematic medical attention16 and
to the higher prevalence of these patients registered at the HyperDia Program17. Another possible explanation is that
women present a higher frequency of AH from the sixth decade on18, and a higher life expectancy at birth (76.5
years) when compared to men16.
The mean age of 60.6 years reflects the aging process of the brazilian population16. Didier and Guimaraes13 found,
in the suburbs of the city of Salvador, state of Bahia, Brazil, a mean age of 58.1 ± 9.9 years in hypertensive individuals and other authors observed a prevalence of AH between 49.3% and 71.6% in individuals aged 60 years or older12,15.
Age ≥ 65 years presented a significant association with reduced GF in both groups at the non-adjusted analysis and so it remained after the adjustment. National10,20 and
international studies4,19 also observed a statistical significance
of reduced GF with age. These findings confirm the increase in AP and CKD with age.
Regarding the socioeconomic situation, 79.5% of the patients belonged to the lower socioeconomic classes (classes D and E) and this adverse situation was much more unfavorable than the one found by Lessa et al12, in the city of Salvador, which
showed a frequency of 59.3% of hypertensive individuals in these classes. Similarly, the low level of schooling observed (up to 8 years of schooling) was higher than the 62.2% estimated
for the brazilian population16. It is possible that such situation,
among hypertensive individuals, brings difficulties for the understanding of the disease and the importance of treatment adherence. Stummer et al13 emphasize that individuals in the
lower socioeconomic classes and with lower levels of schooling present a lower probability of receiving adequate management in the treatment of hypertension.
The high percentage of smokers observed in the sample is also mentioned in other studies with hypertensive individuals13,14. Paradoxically, Boing and Boing17 found
lower values (18.2%) for patients registered at the HyperDay Program. This dissimilarity may be explained by the diversity of definition attributed to the smoking status, established by these authors as smoking one or more cigarettes a day during the interview period. In this study, smoking was significantly associated with a reduced GF in hypertensive individuals with DM, and so it remained after the adjusted analysis. As shown in the literature21, the habit of smoking increases the risk of
kidney function decrease and it is a modifiable factor. Considering the diversity of the criterion adopted for alcohol consumption, some authors present discrepancies in their findings. In this study, 17.5% of the patients reported consuming alcohol. For the AH group with DM, there was a significant association with alcohol consumption and reduced GF; however, after the adjusted analysis, this association was no longer observed. This might be attributed to the fact that age > 65 years is significantly associated with reduced GF and a lower frequency of alcohol consumption in these patients. The excess of body weight was predominant in our sample, considering the BMI as indicator. Of the assessed patients, 65% presented overweight/obesity. A similar prevalence of excess weight was observed in hypertensive individuals by Sturmer et al13 - in 75.4% of the patients. In this study, the patients with
reduced GF presented a lower prevalence of overweight and obesity, but there was a significant association only for obesity in the AH group with DM.
Some epidemiological studies have suggested that excess weight can be a risk factor for CKD22,23. On the other hand,
a population study22 observed that presenting overweight/
obesity at 20 years of age or at some time in the past had an association with increased risk for CKD, although no association was found with excess weight at the moment of the interview.
In this study, the association observed between obesity and reduced GF can be explained by the loss of weight as a consequence of the CKD progress, as a spontaneous decrease in protein consumption occurs with the decrease in the GF, increasing the risk for malnutrition24,25.
Additionally, such association was not significant after the adjustment, which can be attributed to the confusion between the variables age and obesity.
The World Health Organization (WHO) emphasizes that the BMI, although it is a good measure of obesity, does not consider the variation in body fat distribution and it is not capable of detecting the increase in body fat that occurs with age26. Thus, other indicators were measured.
Table 3 - Non-adjusted analysis of the demographic and clinical-laboratory characteristics of hypertensive individuals undergoing treatment according to the glomerular iltration
Variables
AH without DM (n = 199)
RP (IC95%)
AH with DM (n = 99)
PR (95%CI)
GF < 60 GF > 60 GF < 60 GF > 60
n % n % n % n %
Sex 0.205 0.514
Female 32 65.3 114 76.0 13 72.2 64 80.0
Male 17 34.7 36 24.0 1.46 (0.81-2.63) 5 27.8 16 20.0 1.41 (0.50-3.96)
Age (yr)* 0.007 0.002
< 65 20 41.7 101 67.3 5 29.4 61 76.3
> 65 28 58.3 49 32.7 2.20 (1.24-3.90) 12 70.6 19 23.7 5.11 (1.80-14.50)
Smoker 0.393 0.040
No 25 51.0 88 59.1 5 27.8 47 58.8
Yes 24 49.0 61 40.9 1.28 (0.73-2.23) 13 72.2 33 41.2 2.94 (1.05-8.24)
Alcohol consumption 0.737 0.013
No 38 77.6 117 80.9 18 100.0 58 73.4
-Yes 11 22.4 29 19.9 1.21 (0.57-2.19) 0 0.0 21 26.6 -BMI (kg/m2)
< 25,0 22 44.9 48 32.0 - 11 61.1 23 28.7
-25,0 - 29,9 18 36.7 61 40.7 0.72 (0.39-1.35) 0.312 5 27.8 29 36.3 0.45 (0.16-1.31) 0.144 > 30,0 9 18.4 41 27.3 0.57 (0.26-1.24) 0.159 2 11.1 28 35.0 0.21 (0.04-0.93) 0.040
WC (cm) 0.214 0.150
Lower risk 25 51.0 59 39.3 9 50.0 24 30.0
Very high risk† 24 49.0 91 60.7 0.70 (0.40-1.23) 9 50.0 56 70.0 0.51 (0.20-1.28)
WHR 0.558 0.441
Lower risk 11 22.5 41 27.3 5 27.8 15 18.8
High risk 38 77.5 109 72.7 1.22 (0.62-2.39) 13 72.2 65 81.2 0.67 (0.24-1.87)
AP Control 0.502 0.499
Yes 25 51.0 67 44.7 3 16.7 20 25.0
No 24 49.0 83 55.3 0.82 (0.47-1.44) 15 83.3 60 75.0 1.53 (0.44-5.30)
Fasting glycemia 0.708 >0.999
Desirable 46 93.9 138 92.0 9 50.0 40 50.0
High 3 6.1 12 8.0 0.80 (0.25-2.57) 9 50.0 40 50.0 1.00 (0.40-2.52)
Glycated hemoglobin (%)* - 0.167
< 7,0 - - - 11 68.8 35 47.3
> 7,0 - - - 5 31.2 39 52.7 0.47 (0.17-1.37)
Total cholesterol (mg/dl) 0.956 0.329
< 200 20 40.8 62 41.3 6 33.3 38 47.5
> 200 29 59.2 88 58.7 1.02 (0.57-1.80) 12 66.7 42 52.5 1.63 (0.61-4.34)
LDL cholesterol (mg/dl)* 0.962 0.260
< 100 8 16.3 25 16.7 1 5.6 14 18.2
> 100 41 83.7 125 83.3 1.02 (0.48-2.17) 17 94.4 63 81.8 3.19 (0.42-23.95)
HDL cholesterol 0.200 0.343
Desirable 37 75.5 96 64.0 5 27.8 33 41.2
Low 12 24.5 54 36.0 0.65 (0.34-1.25) 13 72.2 47 58.8 1.65 (0.59-4.62)
Triglycerides (mg/dl) 0.124 0.520
< 150 39 79.6 99 66.0 12 66.7 46 57.5
> 150 10 20.4 51 34.0 0.58 (0.29-1.16) 6 33.3 34 42.5 0.72 (0.27-1.93)
Microalbuminuria (mg/24h)* 0.906 0.474
No 41 85.4 125 86.2 14 82.4 57 73.1
Yes 7 14.6 20 13.8 1.05 (0.47-2.34) 3 17.6 21 26.9 0.63 (0.18-2.20)
significant association with reduced GF. The consequence of abdominal adiposity in relation to kidney function impairment has been little documented and it is a noteworthy subject, considering its frequent association with hypertension and diabetes, which are the main causes of CKD in the world. Some studies have shown an association between the central distribution of fat, measured by the WHR, with hypertension14,27, microalbuminuria28 and CKD29.
It has been well established that a strict control of AP is very important to minimize the progression of CKD9,30. The
control of AP did not present a significant association with reduced GF, which can be justified by the lack of AP control also in the hypertensive individuals with GF >60 ml/min/1.73 m2. It is noteworthy the fact that these patients present a high
frequency of overweight and abdominal fat distribution, which contributes to the worsening of hypertension, as observed in other studies3,12,14,15.
The maintenance of glycemia within the normal range for diabetics is fundamental for the prevention or decrease of macro and microvascular complications31. Its inclusion
is recommended in the strategy of CKD prevention in diabetic patients30-33. In this study, the glycemic control was
not associated to reduced GF, corroborating the findings by Kramer et al10.
The increase in serum creatinine is a relatively late parameter for the detection of renal lesion, as it presents alteration only after the patient loses more than 50% of the GF capacity34. Of the patients with reduced GF, 79.6% of the
individuals with AH without DM and 55.6% of those with AH and DM still presented serum creatinine levels within the normal range, demonstrating the low sensitivity of this marker for the early diagnosis of CKD. That confirms the importance of the measurement of GF, measured or estimated based on the serum creatinine, to evaluate kidney function in clinical practice2,3,9,30. In this regard, among the recommendations of
the Kidney Diseases Outcomes Quality Initiative (K-DOQI)9,
is the sue of equations that aim at identifying renal patients faster and at a lower cost. The two most frequently used equations are the Cockcroft-Gault, from 1976 and the MDRD, developed during the study of the same name (Modification of Diet in Renal Disease - MDRD). However, these formulas, although recommended, still need validation in large samples, in individuals at very early stages of kidney dysfunction and in elderly individuals35,36.
Microalbuminuria significantly increases with the reduced GF4. Therefore, its measurement constitutes an important
element in the early diagnosis and follow-up of CKD9,30.
In this study, the frequency of microalbuminuria found in the patients with reduced GF was 14.6% in the AH group without DM and 17.6% in the AH group with DM. National studies report a prevalence of microalbuminuria of 9.5% and 13.7% in hypertensive individuals undergoing treatment37,38.
Such variations in prevalence can be attributed to differences in the methods of analysis of urinary excretion of albumin, due to variation sin age ranges, ethnicity or comorbidities in the studied groups39. It is also important to mention
that the anti-hypertensive treatment is capable of reducing microalbuminuria40.
Microalbuminuria did not present any association with GF. A possible explanation would be that the patients with reduced GF presented a lower frequency of excess weight and abdominal fat distribution in the AH group without DM, although there was no statistical significance. For the AH group with DM, the better glycemic control must be added, through the glycated hemoglobin levels. Maybe the combination of these factors contributed to the reduced microalbuminuria in these patients.
As this is a cross-sectional study, it was not possible to establish a causal association between the GF and associated factors in hypertensive individuals, but one can infer an association between these conditions. Another limitation is that the drug therapy was not assessed, which can interfere with the GF. However, one must consider that all patients were registered at and participated in the HyperDia Program and received the essential medications recommended by the Ministry of Health, available at all BHU.
The percentage of reduced GF observed in the study population was high. That reinforces the need for systematic assessment of GF through creatinine clearance or estimated by equations that have been well established in the literature, as the serum creatinine is a relatively late parameter. It is also important to remember that smokers, as well as those aged > 65 years need special attention, as these factors were strongly associated with GF.
These findings reinforce the need to promote the continuing education for healthcare teams involved in the treatment of these patients, sponsoring the prevention and diagnosis of CKD at the early stages, when it is still possible to prevent the progression to the final stages, of which treatment requires dialysis or kidney transplant.
Acknowledgements
The authors wish to thank CNPq and FAPEMA for the financial support, Hospital Universitário Presidente Dutra and
Unidade de Saúde Vila Embratel and the patients who accepted to participate in the study.
Potential Conflict of Interest
No potential conflict of interest relevant to this article was reported.
Sources of Funding
This study was partially funded by FAPEMA.
Study Association
References
1. Sociedade Brasileira de Cardiologia. Sociedade Brasileira de Hipertensão. Sociedade Brasileira de Nefrologia. V Diretrizes brasileiras de hipertensão arterial. Rev Bras Hipertens. 2006; 13(4):260-312.
2. Brasil. Ministério da Saúde do Brasil. Secretaria de Atenção à Saúde. Departamento de Atenção Básica. Hipertensão arterial sistêmica. n.15. Brasília; 2006.
3. Chobanian AV, Bakris GL, Black HR, Cushman WC, Green LA, Izzo JL Jr, et al. The Seventh Report of the Joint National Committee on Prevention, Detection, Evaluation, and Treatment of High Blood Pressure. The JNC 7 report.JAMA. 2003; 289(19):2560-72.
4. Segura J, Campo C, Ruilope LM. How prevalent and frequent is the presence of mild renal insufficiency in essential hypertension?. J Clin Hypertens (Greenwich). 2002; 4(5):332-6.
5. New JP, Middleton RJ, Klebe B, Farmer CKT, Lusignant S, Stevens PE, et al. Assessing the prevalence, monitoring and management of chronic kidney disease in patients with diabetes compared with those without diabetes in general practice. Diabet Med. 2007; 24(4):364-9.
6. Sociedade Brasileira de Nefrologia. Censo geral 2008.[ Acesso 2008 out.10]. Disponível em:http://www.sbn.org.br/
7. Bostom AG, Kronenberg F, Ritz E. Predictive performance of renal function equations for patients with chronic kidney disease and normal serum creatinina levels. J Am Soc Nephrol. 2002; 13(8):2140-4.
8. World Health Organization (WHO). Obesity: preventing and managing the global epidemic. Report of a WHO consultation on obesity. Geneva; 1998.
9. National Kidney Foundation - NKF. K/DOQI clinical practice guidelines for chronic kidney disease: evaluation, classification and stratification. Am J Kidney Dis. 2002; 39(Suppl. 1):1-266.
10. Kramer CK, Leitão CB, Pinto LC, Silveiro SP, Gross JL, Canani LH. Clinical and laboratorial profile of patients with type 2 diabetes with low glomerular filtration rate and normoalbuminuria. Diabetes Care. 2007; 30(8):1998-2000. 11. U.S. Renal Data System:USRDS 2001 Annual Data Report:Atlas of
End-Stage Renal Disease in the United States,2001. Bethesda:National Institutes of Health, National Institutes of Health, National Institutes of Diabetes and Digestive and Kidney Diseases; 2001.
12. Lessa I, Magalhães L, Araújo MJ, Almeida Filho N, Aquino E, Oliveira MMC. Hipertensão arterial na população adulta de Salvador (BA) – Brasil. Arq Bras Cardiol. 2006; 87(6):747-56.
13. Sturmer G, Dias-da-Costa JS, Olinto MTA, Menezes AMB, Gigante DP, Macedo S. O manejo não medicamentoso da hipertensão arterial sistêmica no Sul do Brasil. Cad Saúde Pública. 2006; 22(8):1727-37.
14. Fuchs FD, Gus M, Moreira LB, Moraes RS, Wiehe M, Pereira GM, et al. Anthropometric Indices and the Incidence of Hypertension: A Comparative Analysis. Obesity Research. 2005; 13(9):1515-7.
15. Costa JSD, Barcellos FC, Sclowitz ML, Sclowitz IKT, Castanheira M, Olinto MTA, et al. Prevalência de hipertensão arterial em adultos e fatores de risco associados: um estudo de base populacional urbana em Pelotas, Rio Grande do Sul, Brasil. Arq Bras Cardiol. 2007; 88(1):59-65.
16. Instituto Brasileiro de Geografia e Estatística - IBGE. Síntese de indicadores sociais: uma análise das condições de vida da população brasileira - 2008. [Acesso em 2008 ago.22]. Disponível em: <http://www.ibge.gov.br/ home/estatistica/população/condicaodevida/indicadoresminimos/ sinteseindicsociais2008/indic_sociais2008.pdf>
17. Boing AC, Boing AF. Hipertensão arterial sistêmica: o que nos dizem os sistemas brasileiros de cadastramentos e informações em saúde. Rev Bras
Hipertens. 2007; 14(2):84-8.
18. Kearney PM, Whelton M, Reynolds K, Muntner P, He J. Global burden of hypertension: analysis of worldwide data. Lancet. 2005; 365:217-23. 19. O’Hare AM, Choi AI, Bertenthal D, Bacchetti P, Garg AX, Kaufman JS, et al.
Age affects outcomes in chronic kidney disease. J Am Soc Nephrol. 2007; 18(10):2758-65.
20. Passos VMA, Barreto SM, Costa-Lima MFF. Detection of renal dysfunction base on serum creatinine levels in a Brazilian community. The Bambuí Health and Ageing Study. Braz J Med Biol Res. 2003; 36(3):393-401.
21. Ritz E, Ogata H, Orth SR. Smoking: a factor promoting onset and progression diabetic nephropathy. Diabetis Metab. 2000; 26(Suppl 4):S54-S63. 22. Ejerblad E, Fored CM, Lindblad P, Fryzek J, McLaughlin JK, Nyrén O. Obesity
and risk for chronic renal failure. Am Soc Nephrol. 2006; 17(6):1695-702.
23. Hsu C, McCulloch CE, Iribarren C, Darbinian J, Go AS. Body mass index and risk for end-stage renal disease. Ann Intern Med. 2006; 144(1):21-8. 24. Ikitzler TA, Greene JH, WIngard RL, Parker RA, Hakim RM. Spontaneous
dietary protein intake during progression of chronic renal failure. J Am Soc Nephrol. 1995; 6(5):1386-91.
25. Chertow GM, Hsu C, Johansen K. The enlarging body of evidence: obesity and chronic kidney disease. J Am Soc Nephrol. 2006; 17(6):1501-2.
26. World Health Organization (WHO). Physical Status: the use and interpretation of anthropometry. Geneva: 1995. (WHO Technical Report Series 854). 27. Pereira RA, Sichieri R, Marins VMR. Razão cintura/quadril como preditor de
hipertensão arterial. Cad Saúde Pública. 1999; 15(2): 333-44.
28. Mulyadi L, Stevens C, Munro S, Lingard J, Bermingham M. Body fat distribution and total body fat as risk factors for microalbuminúria in the obese. Ann Nutr Metab. 2001; 45(2):67-71.
29. Elsayed EF, Sarnak MJ, Tighiouart H, Griffith JL, Kurth T, Salem DN, et al. Waist-to-hip ratio, body mass index, and subsequent kidney disease and death. Am J Kidney Dis. 2008; 52(1): 29-38.
30. Sociedade Brasileira de Nefrologia. Diretrizes brasileiras de doença renal crônica. J Bras Nefrol. 2004; 26(3 supl 1):1-49.
31. Intensive blood-glucose control with sulphonylureas or insulin compared with conventional treatment and risk of complications in patients with type 2 diabetes.(UK PDS33).UK Prospective Diabetes Study. (UKPDS) Group. Lancet. 1998; 352:837-53.
32. Sociedade Brasileira de Diabetes. Diretrizes da Sociedade Brasileira de Diabetes. Tratamento e acompanhamento do Diabetes Mellitus. Rio de Janeiro; 2007.
33. American Diabetes Association - ADA. Standards of medical care in diabetes - 2007. Diabetes Care. 2007; 30(Suppl .1):S4-41.
34. Shemesh O, Golbetz H, Kriss JP, Meyers BD. Limitations of creatinine as a filtration marker in glomerulopathic patients. Kidney Int. 1985; 28(5):830-8. 35. Jungers P, Chauveau P, Descamps-Latscha B, Labrunie M, Giraud E, Man
NK,et al. Age and gender related incidence of chronic renal failure in a French urban area: A prospective epidemiologic study. Nephrol Dial Transplant. 1996;11:1542-6.
36. Jager KJ, van Dijk PC, Dekker FW, Stengel B, Simpson K, Briggs JD: The epidemic of aging in renal replacement therapy: An update on elderly patients and their outcomes. Clin Nephrol .2003;60:352-60.