Marc Gouw
Dissertation presented to obtain the Ph.D degree in Bioinformatics
Instituto de Tecnologia Química e Biológica António Xavier | Universidade Nova de LisboaMarc Gouw
Dissertation presented to obtain the Ph.D degree in Evolutionary Biology Instituto de Tecnologia Química e Biológica António Xavier | Universidade Nova de Lisboa
Bioinformatics for comparative cell biology
This thesis and the years of work and inspiration put into it would not have been possible without the help of many people.
First of all, I just generally want to thank everyone for being so great. Especially those who in any way contributed to making the past few years in Portugal and at the IGC such a wonderful experience: without all of you, my life and this thesis would have turned out very different indeed.
A special thanks to all of the past and present members of the Computational Genomics Laboratory, who have always been kind enough to be unforgivingly critical of my work, and equally enthusiastic to go enjoy a beer on a Friday afternoon. And especially Beatriz Ferreira Gomes and Yoan Diekmann, who were essential to my PhD project: You have been truly inspiring collogues and close friends. A lot of this work would not have been possible without you. The epicmtoc-explorer.org, and indeed this thesis would also not have been possible without Renato Alves. I blame you, your programming genius and incredible patience for teaching me so much.
I also really want to thank my ever so important supervisors Jos´e Pereira-Leal and M´onica Bettencourt-Dias. Your guidance, supervision and support over the past few years has been invaluable. Also Zita Carvalho-Santos, who’s initial work laid the foundation of what turned into the major part of my PhD.
The IGC is a wonderful place to study. I wanted to thank Prof. Howard and Prof. Coutinho for giving me the opportunity to be part of the IGC. I wanted to thank Thiago Carvalho, and ´Elio Sucena for providing a lot of practical and scientific support. Jorge Carneiro also provided incredibly useful feedback and advice throughout various parts of this project. Also my thesis committee Patr´ıcia Beldade and Nuno Moreno, you provided excellent advice (especially towards the end of my PhD), for which I will always be grateful.
There are many at the IGC who I value incredibly as colleagues and friends, to whom I cannot express enough gratitude. Barbara Vreede, your never-ending excitement with science and life in general is truly inspiring (and highly contagious). I can’t thank you enough for making the IGC a special place (and for being my gateway to coming to Portugal in the first place). And Dani Bodor, your vast knowledge, curiosity and excitement at the world of cell biology and beyond are incredible, just as your ability to catch a hammer.
There are also a few people I would like to thank for helping me get this thesis finished. Jarek Surkont provided great feedback on chapter 3. Renato Alves & Ricardo Leite for their comments and suggestions on chapter2.
away, I know you guys always have my back. And the love of my life Iria, for her endless support while I was writing this thesis, but more generally for being such a wonderful person and part of my life.
Thank you all !!!
Financial Support
Esta disserta¸c˜ao teve o apoio financeiro da FCT e do FSE no ˆambito do Quadro Comunit´ario de Apoio, bolsa de doutoramento #SFRH/BD/51628/2011 e da Funda¸c˜ao Calouste Gulbenkian.
This dissertation had the financial support from FCT and FSE through the Quadro Comunitrio de Apoio, doctoral fellowship #SFRH/BD/51628/2011 and Funda¸c˜oo Calouste Gulbenkian.
Software
This thesis was written entirely using the free and open source software programs LATEX, Inkscape & Python.
Cover image
For hundreds of years biologists have studied the naturally occurring diversity in plant and animal species. The invention of the electron microscope in the first half of the 1900’s reveled that cells also can be incredible complex (and often stunningly beautiful). However, despite the fact that the field of cell biology has existed for over 100 years we still lack a formal understanding of how cells evolve: It is unclear what the extents are in cell and organelle morphology, if and how diversity might be constrained, and how organelles change morphologically over time.
The emergence of the eukaryotic cell over 1 billion years ago marks one of evolutions major transitions. In this branch of life the cellular architecture evolved from a relatively simple plan to a highly complex and compartmental-ized system of organelles. One of the most powerful ways to study evolution is to study diversity across a broad range of different species: The “compara-tive” approach to biology. In the context of eukaryotic evolution we call this “comparative cell biology”, which we explore in this thesis.
In this thesis we study two model systems for “comparative cell biology”: Microtubule Organizing Centers (MTOCs) in chapters2and3and RabGTPases in chapter 4. Each of these chapters explores a different angle of cellular evolution, and each chapter proposes new bioinformatics tools to enable a “comparative cell biology” approach.
The first chapter addresses evolution of MTOCs from a purely morphological perspective. In order to achieve this we created mtoc-explorer.org, a community driven web-resource in which we collected ultrastructural data on MTOCs from over 100 species. Using this data we were able to determine some of the fundamental principles of the evolution of shape in organelles. We show that although diversity is a prominent theme in MTOC evolution, the total set of possible morphologies is constrained by functional requirements. In doing so we uncover a “spandrel” in cell biology: The requirement for microtubule based motility constraints the overall architecture of a cell’s mitotic apparatus. Lastly we develop a model to measure ancestrality of organelles, and show convergent evolution of complex organelles in cells.
Using a bioinformatics technique called “phylogenetic profiling” we ask how well we can use the presence and absence of a gene across multiple species to predict if a gene is functionally involved in the biogenesis or maintenance of the cilium. We found that the major improvements in “comparative cell biology” predictions are obtained by maximizing the taxonomic distribution of the species analyzed (representing as many eukaryotic lineages as possible).
Lastly in chapter4we explore the comparative approach using only sequence data. Rabs are a family of GTPases that are master regulators of intracellular trafficking, and are present in all major eukaryotic species. Each different family of Rabs is known to participate in different cellular processes. Therefore being able to identify which family a Rab belongs to allows one to make functional predictions about which processes can occur in a cell. In order to make these predictions possible, a bioinformatics pipeline the Rabifier and accompanying databaseRabDB.org were developed.
Durante centenas de anos os bi´ologos tˆem estudado a diversidade natural que ocorre em todas as esp´ecies vegetais e animais. A inven¸c˜ao do microsc´opio electr´onico na primeira metade do s´eculo passado, ajudou a revelar que as c´elulas tamb´em podem ser incrivelmente complexas (e muitas vezes de uma beleza apaixonante). No entanto e apesar do facto de que o ramo da biologia celular existe h´a mais de 100 anos, ainda n˜ao temos um conhecimento formal de como as c´elulas evoluem: n˜ao ´e claro a vastid˜ao das c´elulas e da morfologia dos organelos, e se e de que maneira, a diversidade pode ser limitante, e de que modo os organelos a mudam sua morfologia ao longo do tempo.
O aparecimento da c´elula eucari´otica h´a mais de 1000 milh˜oes de anos traduz-se numa das mais importantes transi¸c˜oes evolutivas. Neste ramo a arquitetura celular evoluiu a partir de um esbo¸co relativamente simples para um sistema altamente complexo e compartimentalizado de organelos.
Uma das formas mais poderosas para estudar a evolu¸c˜ao ´e estudar a di-versidade atrav´es de uma ampla gama de diferentes esp´ecies: a “abordagem comparativa” para a biologia. No contexto da evolu¸c˜ao eucari´otica design´amos como “Biologia celular comparativa”, a abordagem utilizada nesta tese.
Dois sistemas modelo ser˜ao estudados usando “biologia celular compar-ativa”: o Centro organizador de microt´ubulos (MTOCs) nos captulos 2 e 3 e RabGTPases no cap´ıtulo 4. Em cada um destes cap´ıtulos exploramos um ˆangulo diferente da evolu¸c˜ao celular, e em cada um deles propomos novas abordagens e ambientes de trabalho bioinform´aticos no ˆambito da “biologia celular comparativa” . O primeiro cap´ıtulo aborda a evolu¸c˜ao de MTOCs a partir de uma perspectiva puramente morfol´ogica. De modo a alcan¸car este objectivo, criamos amtoc-explorer.org, uma ferramenta web impulsionada pela comunidade, onde foram recolhidos os dados ultra-estruturais de MTOCs de mais de 100 esp´ecies.
Contents
1 General Introduction 1
1.1 Diversity, Cells and Bioinformatics . . . 1
1.2 The Microtubule Organizing Centers of Eukaryotes . . . 6
1.3 Ontologies for Cell Biology . . . 14
1.4 Morphology Databases for Cell Biology . . . 20
1.5 Outline of this thesis . . . 23
2 The Evolutionary Cell Biology of Cilia and Centrosomes 25 2.1 Introduction. . . 27
2.2 Results. . . 30
2.3 Discussion . . . 52
2.4 Methods . . . 58
2.5 Supplementary Material . . . 65
3 Associating Genes to Organelles in Eukaryotes Using Phyloge-netic Profiling 69 3.1 Introduction. . . 71
3.2 Results and Discussion . . . 77
3.3 Conclusion . . . 89
3.4 Materials and Methods. . . 93
4 The Evolution of Rab GTPases 97 4.1 Introduction. . . 99
4.2 Results and Discussion . . . 102
4.3 Conclusions . . . 123
4.4 Materials and Methods. . . 125
5 Discussion 133 5.1 This thesis, a brief summary. . . 133
5.2 Bioinformatics for comparative cell biology . . . 134
General Introduction
1.1
Diversity, Cells and Bioinformatics
It would be fair to say that the diversity we see in the world around us has been the inspiration for many of us to study evolution; the silent but steady driving force behind this wonderful variation. And it turns out that one of the oldest and most powerful ways to study how evolution works is by studying biological diversity.
For most of its history, biology was the discipline of studying diversity and variation. Aristotle, the father of biology, was the first to devise an organized system of classification of animals (the scala naturae). Similarly Linneaus, who in the 18th
century gave rise to the taxonomic system we still use today, classified organisms based on their morphology – forms, shapes and structures – that defined that species and set it apart from others. George Cuvier, during the same era, was the first great comparative morphologist, and invented comparative anatomy and paleontology. However it was Darwin, naturally, who succeeded in using diversity and variation to explain the origin of species. It became clear that studying biological diversity was studying evolution in its most basic form.
microscopes, an entire new world of diversity has come into view without ever having been properly studied: the cell.
1.1.1 Diversity in Cell Biology
Over the past few centuries researchers have discovered that biology is not simply limited to species and life forms visible to the naked eye: most life is unicellular. The “Eukaryotic” kingdom, one of the three (or possibly two1
) major branches of life has existed for approximately 1.5 billion years (Yoon et al., 2004). In contrast to bacteria and archea, eukaryotes have a highly complex, organized and compartmentalized cellular structure (Diekmann et al., 2011). Many of the organelles considered hallmarks of eukaryotes (such as the nucleus, Golgi apparatus, peroxisomes and also cilia) are thought to date back to the Last Common Eukaryotic Ancestor (LECA). However, despite a common origin, eukaryotes show a tremendous amount of morphological diversity in cellular structure (Figure 1.1).
This diversity exists at multiple different levels of cellular organization. Although a typical eukaryotic cell is 10−100µmin diameter, the single celled ciliateStentor coeruleus can measure up to to 2.8mmin length (Marshall et al., 2012; Morgan,1901). Cell shape can also vary greatly: diatoms alone display an incredibly vast amount of (often stunningly beautiful) variation in shape (see the illustration titled “Diatomea” in (Haeckel,1904) for examples). Cell morphology also can differ greatly between different cells of a single species, exemplified by the structurally intricate and complex shapes of neurons. Other than shape and size, there is also a large amount of variation in intracellular composition of cells. The first and most obvious diversity is in the presence and absence of certain organelles (for chloroplasts, which exist in plants, and in a derived state in diatoms). Organelles themselves also show a large amount of morphological diversity. One example is the Golgi apparatus, which can take on a variety of different shapes including stacked and single cistern, and may even be invisible2
(Mowbrey and Dacks, 2009). Another example is the microtubule organizing centers (MTOCs) of eukaryotes – cilia and centrosomes – which
1
Recent work has provided evidence that favours the 2 domain tree of life, in which Eukaryotes belong to archea (Spang et al.,2015).
2
show structural diversity including different radial symmetries, stacked configu-rations, and the presence and absence of specific subcomponents. MTOCs are morphologically so diverse (and interesting) that we will be using these as the “model organelle” throughout most of this thesis, and will be further discussed
in section 1.2.
Previous work shows that the existence of an organelle in a certain species can be related to a small number of genes. For example, the presence or absence of peroxisomes in a species can be predicted based on the presence or absence of only 4 genes in a species’ genome (Schl¨uter et al.,2006). Similarly there is a core set of at least 3 genes required for centriole formation whose presence in a species’ genome predicts the presence of the structure in a species (Carvalho-Santos et al., 2010). These studies both further suggest that the structural diversity observed in organelle structure and context may be linked to the presence and absence of other genes biologically related to the organelle.
Diversity exists in cell biology, and for a small handful of organelles biologists have identified genes who’s presence directly correlates with the presence of that organelle. However these particular case-studies are limited in scope and require a large amount of manual curation of species’ genotypes and phenotypes, nor do they address morphological diversity beyond the presence or absence of an organelle. They do not provide a framework to understand how morphological diversity evolves in cell biology. What they do show is that if we wish to understand the diversity of cell & organelle morphology, we first will need to obtain a detailed characterization of extents and types of diversity that exist. Subsequently we can look if and how a species’ genome contributes to the evolutionary origins of diversity in cells. I propose that we turn to bioinformatics to solve both of these issues.
1.1.2 Bioinformatics for Comparative Cell Biology
most basic bioinformatics techniques, for example BLAST (Altschul et al.,1990). At the moment, there are two major ways in which bioinformatics contributes to our understanding of evolution: genome and morphology databases. If we wish to study the evolution of cells, we can use techniques and concepts currently being used in both of these fields of evolutionary biology.
The vast majority of bioinformatics resources are dedicated to storing and analysing of genomic sequence data. One of the major goals of these projects is to understand how a species’ genome is responsible for the shapes, function and behaviour of that species. An important step in this process is determining the function of all the genes in a species’ genome. This is typically done by identifying genes in other species, sequence motifs or protein domains who’s function is known. The set of techniques used to make these inferences between different genes and different species is called “comparative genomics”.
Another group of scientists using bioinformatics to study evolution are those working in systematics and taxonomy, who study the shapes of limbs, skeletons, roots, trunks and organs between different species to determine their evolutionary relationships. Computers and the internet are helping researchers working in “comparative morphology” around the globe to work together and share their knowledge in ways never before possible.
Once again, we see that current tools and techniques in bioinformatics exist on exactly two different levels; that of large organisms (animals & plants) and that of molecules (DNA & protein sequences). However, we have no bioinformatics resources dedicated to studying diversity in cells. In this thesis we propose to combine tools and techniques from “comparative genomics” and “comparative morphology” to study the evolution of diversity at the level of the cell. In the same way that the microscope provided the hardware to see how wonderfully diverse cells are, we propose to use bioinformatics as the lens through which to see the evolutionary processes behind this diversity.
1.1.3 MTOCs, ontologies and databases
“microtubule organizing centers” (MTOCs) as “model organelles” for this task. In order to start understanding how morphological diversity evolves in MTOCs we will first need to create a quantified database of the extends of this diversity. In order to achieve this we will borrow two “comparative morphology” techniques: ‘ontologies“ and ”morphological databases“. The remainder of the introduction
is dedicated to these three topics.
1.2
The Microtubule Organizing Centers of
Eukary-otes
fact refer to a homologous organelle. The term “centrosome” has classically been used to describe the microtubule based organelles observed at the spindle poles during mitosis in animal cells. More recently the term has been adopted to include microtubule based organelles in fungi and amoebozoa (Azimzadeh, 2014) that localize to the spindle poles during mitosis. Although it is currently not known whether these are homologous structures in different eukaryotic lineages, I will be using the term “centrosome” to refer to any microtubule based structure which is functionally and behaviourally equivalent to the classical animal “centrosome”. The base of the “cilium” – the “basal body” – is now known to be the same organelle as the “centriole” (Figure 1.2), and collectively these are referred to as the “CBB”. The term “basal body” will be used exclusively when the “CBB” is anchoring a “cilium”, and “centriole” to refer to the “CBB” when it is part of the mitotic apparatus. Finally, to distinguish the canonical animal “centrosome” from others, we will be using the term “centriole-based centrosome” if the mitotic apparatus contains “centrioles”.
As the two major components of the microtubule cytoskeleton, the evolu-tionary histories of these organelles is both complicated and fascinating. These organelles play different roles in which their capacity to coordinate and modify the microtubule cytoskeleton plays a major role. Aside from functional dif-ferences, both of these structures are a source of structural diversity. Due to their presence in (almost) all eukaryotes, the ease of viewing them under a microscope, and the beautiful morphologies they display, it is no wonder that these organelles have a rich history as model organelles. This section starts with a historical introduction of MTOCs as model organelles to study diversity and evolution. Subsequently I will proceed to describe what is known about cilia and centrosomes in the present day including their functional roles, as well as the large amount of structural diversity we now know to exist.
1.2.1 MTOCs as classical model organelles for cell biology
contained multiple “fibrils” (i.e. microtubules). Incidentally 1887 also marked the discovery of the animal “centrosome”, when both Boveri (Boveri, 1887) and van Beneden (Beneden and Neyt, 1887) simultaneously discovered a dense and conserved structure at the heart of spindle poles inAscaris megalocephala (Scheer, 2014). Once again, history would have us wait almost a full century until the commercialization of the Electron Microscope (EM) in the 1950’s before any more significant insights were obtained in the underlying ultrastructure of these enigmatic organelles.
The mid and late 1900’s would prove to be a very interesting time for cilium & centrosome biologists. Crude yet incredibly elegant scanning EM experiments (looking at shadows of microtubule bundles created with a low angle emission source) suggested that the cilium was composed of bundles of 9+2 “fibrils” (Manton and Clarke,1952; Fawcett and Porter,1954). Sorokin in (1962) described the difference between motile and non-motile cilia, and associate it to the presence of a central pair of microtubules in motile cilia. Towards the end of the same decade Dingemans (1969) and Wheatley (2005) followed by confirmation by Fulton and Dingle (1971) showed that the basal body and the centriole were one and the same organelle. In that same year Archer and Wheatley (1971) also noted that many plants do not have any distinguishable MTOC. During the same period it was revealed that other species have all together different microtubule based MTOC’s: spindle pole bodies (SPB) in yeast (Robinow, 1966) and nucleus associated bodies (NAB) in amoebas (Roos, 1975).
1.2.2 Eukaryotic Cilia
The eukaryotic cilium is a membrane bound protrusion extending from the cell, involved in multiple cellular processes including motility, chemo-, photo- & mechanosensation, and signalling. Internally, the cilium is build on a scaffold of microtubule arrays that cover the entire length of the cilium, and are anchored to the cell via the plasma membrane. Typically the structure is a 9-fold
3
symmetrical cylinder of microtubule doublets, although the exact structure can vary greatly between different types of cilia and different species.
The cilium is currently thought to have evolved to combine motility, sensa-tion and trafficking into a single organelle (Carvalho-Santos et al.,2011; J´ekely and Arendt, 2006). These three major functions are also observed in extant species in all major branches of eukaryotes. In multicellular organisms the requirement for cell motility is greatly diminished, and only a handful of cell types have motile cilia. However the immotile cilium is present in almost all cells in animals and acts as the central hub of cell-to-cell signalling (Singla and Reiter, 2006; Goetz and Anderson, 2010). In animals, motile cilia can still be found in sperm cells and in multiciliated epithelial cells (for example the trachea and oviduct).
The cilium consists of three major components: the “axoneme”, “transition zone” and “basal body” (Figure 1.2). It is typically described as a scaffold of microtubule doublets with 9-fold radial symmetry. The “basal body” is a short barrel shaped organelle which forms the base of the structure, and generally consists of microtubule triplets and may or may not contain a cartwheel. The upper part of the cilium, the “axoneme” is an extension of the two inner microtubules of the “basal body”. Typically the axoneme is also 9-fold symmetrical. In between the “basal body” and the “axoneme” is the aptly named “transition zone”, in which the array of microtubules transitions from its “basal body” structure to its “axoneme” structure, and the membrane anchoring machinery of the cilium can usually be found. The transition zone is the gateway that filters which components enter and leave the ciliary compartment. There are many structures which may or may not be present in these cells, which is often reflected by whether the cilium is motile or not. Motile cilia (as shown in Figure 1.2) typically have many additional components including a central pair of microtubules, 2 sets of dynein motor proteins, and radial spokes. Non-motile cilia typically have none of these.
fold symmetry ranging between 3 and 20 (and possibly even more), as well as non-symmetrical microtubule sheets and spirals (see Mencarelli et al. (2008) for some examples). Other structures are thought be taxon specific, such as the “plates” inP. tetraurelia (Dippell,1968) or the “stellate fibers” inC. reinhardtii (Geimer and Melkonian, 2004). This diversity can be observed between cilia of different species, but also between different cells in the same species, and even in different life cycle stages of a single cell.
1.2.3 Eukaryotic Centrosomes
The “centrosome” is the generic name given to any organelle, or organelle-like structure, which is at the spindle poles during mitosis (Bornens,2012). Unlike cilia, many cells exist which do not have a centrosome (at least, not readily visible by electron microscopy). In many cells (typically animal cells) the centrosome is formed by a pair of centrioles (Azimzadeh and Bornens, 2007). In other cells, microtubule based structures can clearly be seen organizing the spindles, however they are structurally (and sometimes molecularly) different from the animal centrosome. Thus it appears that centrosomes are not essential for cell division, although they exist in many different species, and when they exist can take on a number of different forms.
1.2.4 MTOCs as model organelles for comparative cell biology
The eukaryotic MTOC is the ideal “model organelle” to study the evolution of morphological diversity in cell biology. The primary reason is that MTOCs have a rich and complex evolutionary history: They were present in the LECA, have been lost multiple times in different lineages, and have diversified structurally as well as functionally. Also, MTOCs have been extensively studied for over one hundred years, resulting in a large collection of published work across hundreds of different species. In the following two sections we explore two different techniques which we will use use to catalogue the morphological diversity in these enigmatic organelles.
1.3
Ontologies for Cell Biology
Cell biology, for the first few hundred years, existed almost entirely as a descriptive discipline. During this time thousands of articles were published containing ultrastructural descriptions of novel species and cells. These studies would usually consist of EM images of one or more organelles, accompanied by highly detailed text descriptions of the structures visible in each image.
1.3.1 Ontologies, a formal introduction
The concept of an “ontology” dates back to the (pre-Socratic) Greek philosopher Parmenides as the “study of the nature of being”. Over the past few decades this concept has been adopted in a more practical sense in computer sciences to structure domains of knowledge. More recently, ontologies have been introduced to biology, to structure and order biological concepts, and the past decade and a half have seen an explosion in the number of “bio-ontologies” (Deans et al., 2012; Howe and Yon,2008; Blake, 2004). Interestingly, these ontologies have been successfully implemented at the highest level of biology (the whole organism), and at the lowest level (genes and proteins), but only recently have a few attempts been made at the level of the cell.
Figure 1.5: Ontologies for biology. Ontologies are a formal way to translate real-world entities into a conceptual graph. a)There are two parts to an ontology: The “terms” (in this examplesubjectandobject) which represent physical objects or concepts and the “relationships” which define how these “terms” are related to one another. b) An example of a basic ontology for “MTOC”s. This example shows two different types of terms, “classes” and “instances”: Although not required to defined an ontology, these types help organize what each “term” represents. There are also two types of “relationships”: Thehas instance relationship establishes that centrosomes and cilia are both different instances of class mtoc. Thehas part shows that aciliummay have any one of the three componentsaxoneme,transition zoneandbasal body. This example is a subset of the ontology used later in chapter2 (section2.2.1).
the “relationships”, which define how each term is related to its ancestors (or descendants). One of the powerful aspects of ontologies is “transitivity”: logical rules can be used to traverse the hierarchy. If a nucleusis a organelle, and anorganelleispart of acell, it logically follows that anucleusispart of a
cell. As a conceptual framework ontologies allow for the structured expression of almost any object of interest. Temporal aspects can be captured by relating “terms” via (for example)precedes. Quantities can be described by using terms
as values, for instancenumber of mitochondria has value 9.
Ontologies are highly flexible in what they are able to describe: their strictly defined frameworks remove linguistic ambiguities, and they allow for a structured representation of quantified descriptions. Ontologies are highly suited tools for any field comparative biology, and their use in cell biology is long overdue.
1.3.2 Bio-ontolgies
There are many bio-ontolgies in existence today, and the number keeps on growing. A comprehensive list can be found at the OBO foundry, the official repository for biological ontologies, which as of June 2015 lists 10 officially recognized & 121 candidate bio-ontologies (Smith et al., 2007). There are two major types of ontologies dedicated to capturing morphological diversity: ontologies for taxonomy & systematics, and model organism ontologies for annotating gene and protein data.
Bio-ontologies for taxonomy & systematics
One of the main applications of bio-ontologies is in the field of systematics to aid the classification of species. The scope of these ontologies typically ranges from high resolution “natural diversity” of a closely related group of species, to large all-encompassing ontologies that allow cross-species comparisons.
is that they allow for the complete (or partial) morphological annotation of organisms belonging to a closely related group of species: the ontologies allow for the description of the presence or absence of structures, sizes, colors, numbers, etc. However their scope is typically “small”, each ontology consisting only of terms relevant to the particular set of species being studied.
Bio-ontologies for model organisms
Model organisms are the work-horses of molecular and cell biology, and the results from high throughput phenotype screens are all available online. In an effort to study the organisms as a whole, and to integrate studies in different parts of each model organism, many model-organism specific ontologies have been developed. In most cases there are three general types of ontologies for each model organism: anatomical, developmental and (mutant) phenotype ontologies. These are almost exclusively usually used to describe the localization, timing and functional properties of genes (or gene products).
as well as a developmental ontology for the first 20 Carnegie stages.
Given the large amount of model-organism databases, it is no surprise that there are efforts to unite these under common frameworks. UBERON, the “uber ontology” is striving to create a single reference ontology to relate all model-organism specific ontologies (Mungall et al., 2009; Mungall et al.,2012). The Common Reference Ontology (CARO) was designed as a species-independent (animal) anatomy framework (see chapter 16 in Dress et al. (2008)), and was the basis for development of the XAO and UBERON, and is also cross-referenced by the DAO. The Phenotype Annotation Ontology (PATO) (pato,2015) is a similar project for annotating phenotypes (both natural and mutant).
Although the ontology is created for an organism as a whole, they are used for annotating properties of genes (or gene products). Model-organism ontologies are not used for describing naturally occurring diversity, and therefore are not suited to studying morphological evolution.
Bio-ontologies for cells
There are very few ontologies dedicated to describing morphological diversity in cells. The foremost cell ontology is the Cell Ontology (CO), an ontology for cell types during development (Bard et al.,2005). This ontology spans all major branches of the tree of life, and contains terms for different cell types. It has been incorporated into several model-organism ontologies including the DAO, DPO, FMA and Mouse ontologies. The Subcellular Anatomy Ontology (SAO) (Larson et al., 2007) is the only ontology that contains terms for organelles and parts of cells. Although initially intended to capture the entire morphology of cells and their organelles, the only part actively developed is dedicated to neurons. This ontology contains terms for all major components of nervous system cells and cell types, including terms for describing morphology (anatomical properties). In 2013 this project was successfully integrated with the Gene Ontology (Roncaglia et al.,2013).
Ontologies for genes & proteins
Possibly the most known “bio-ontology” is the Gene Ontology (GO) (Ashburner et al., 2000). This was one of the first successful ontologies in molecular & cell biology, and is used to annotate gene function to a remarkable level of detail. Gene products can be annotated in all three major parts of the ontology: “Molecular Function”, “Biological Process” & “Cell Compartment”. However GO does not (as was never intended to) be used to describe morphological diversity per se. Even though it contains terms highly relevant to this thesis (such as cilium, axoneme, etc.), the ontology cannot be used to study diversity
from an morphological diversity perspective.
1.3.3 Bio-ontologies for Comparative Cell Biology
There are a large number of ontologies in the field of biology, and many of them have proven successful as a means to create large datasets of biological data. However, there are no ontologies suitable for studying morphological diversity in cells & organelles. The CO is targeted at describing cell types, and much like the model organism ontologies is intended to annotate gene function and not morphological diversity. The SAO makes room for morphological annotations, although is limited in scope to neurons. Likewise, the “cell compartment” of GO has terms for all major organelles in the cell, however lacks the terms required to describe morphological diversity.
1.4
Morphology Databases for Cell Biology
For most of its history the field of evolutionary biology has been an exercise in comparative morphology. Whether studying animals, plants or cells, the typical work flow is similar: Researchers create collections of images & illustrations on a set of closely related species, and only those with access to this entire collection could study their evolution. Cell biology has a similar history: Ultrastructural studies were published containing hand drawn illustrations and microscopy image “plates” accompanied by text descriptions. The age of computers and the internet has changed this work flow in many areas of biology, allowing scientists to collaborate and share data, as well as to create a single centralized repository to store data. As discussed previously (section 1.1.1), the past few decades have revealed that there is a large amount of biological diversity in cells and organelle morphology. In order to study the evolutionary mechanisms behind this diversity, we will first have to create a catalogue of this diversity.
1.4.1 Morphology Databases
Computers and the internet now allow for comparative morphologists to col-laborate and share information as never before possible (Bisby, 2000; Sugden and Pennisi,2000). Many different morphology databases exist, each tailored to address different research questions. I will briefly describe two main types of morphology databases; those dedicated to systematics and taxonomy, and those dedicated to studying model organisms, and end with a brief description of cell morphology databases.
Morphology databases for taxonomy & systematics
Unequivocally the greatest efforts to create detailed and comprehensive catalogs of biodiversity find their origins in taxonomy & systematics. These comparative morphologists have a strong history in collecting & describing biodiversity, although classically they have only been able to share their work as published (paper) material. The introduction of large online repositories has enabled
The Encyclopedia of Life (eol,2015; Parr et al.,2014a) serves as a portal to “gather information and pictures of all species known to science”. Although their emphasis is on collecting images, some collections are annotated using Traitbank (Parr et al., 2014b), an ontology created to allow a complete description of a
species’ behaviours, habitat, and some morphological descriptors.
There are two major projects which aim to facilitate collaboration between groups of systematicists. MorphoBank (O’Leary and Kaufman, 2011; mor-phobank,2015) (O’Leary and Kaufman, 2011; morphobank,2015) hosts several small projects for scientists working on a particular project to share and an-notate specimens of species via character matrices. MorphBank (morphbank, 2015) is a similar project, which allows users to upload and annotate images. Although in theory neither of these is limited in scope, most of their collections are small projects centered collaborations on animal and plant diversity.
The most important goal of these projects is to collect images representing biodiversity, and when possible to quantify the morphological observations using ontologies or character matrices. Each of these projects also collects data in a similar fashion: By creating a community driven resource in which members can upload and annotate images. This aspect is incredibly valuable as the database content can be contributed from people around the globe, and moreover is not limited to images and specimens published in academic journals. But most notably, in all of these projects the “image” is the central point of reference: annotations and character matrices are always tied to the “raw data” (Ram´ırez et al., 2007).
Morphology databases for model organisms
microscopy images of life cycle stages and developmental stages, annotated with their ontology, but have no quantified morphological data. XenBase has illustrations of development stages, as well as links to gene expression (Karpinka et al., 2014; Bowes et al., 2009), but also lacks quantification of the information in these images. Yeast is a very suitable model organism for high throughput genomics and phenotype screens, and there are currently two major projects focussed onS. cerevisiae with a strong morphological component. These projects are The Phenomics of yeast Mutants (PhemoM) (Jin et al., 2012) and the Saccharomyces cerevisiae Morphology Database (SCMD) (Saito et al., 2004). These projects use automated image capturing & analysis to measure the morphological changes for thousands of mutants, including fluorescent labelling of specific cellular components including the nucleus, actin & microtubules.
Model organism centered databases are beginning to recognize the value in collecting images. By directly integrating them with other sources of data (gene & protein function, human disease, etc), these images can be used to make predictions and sometimes even novel discoveries. This is of tremendous value to experimental biologists working in these model systems. For our purposes however, the major drawback is that these databases are limited to a single species, making it impossible to do cross-species studies.
Morphology databases for Cells
There are very few morphology databases focussed on cells.4
The major cell image database is the Cell Image Library (Orloff et al.,2013), which has recently merged with what was started as the Cell Centered Database (CCDB) (Martone et al.,2002). This project has 2 main goals: To serve as a central repository for collecting annotated images of cell ultrastructure, and to provide a free and open collection of images for education and the public. This project is remarkable in being one of the few cell centered databases focussed on capturing natural variation in cell ultrastructure. Although not compulsory images may be annotated using (up to) 14 ontologies. However these ontologies (including many of those mentioned in section1.5) are not for quantifying morphological diversity, but rather for annotating the organ or tissue source of the image
4
(and consequently are limited to animal specific ontologies). The Cell Image Library is an extremely valuable resource for collecting and sharing images of biodiversity in cells, and has an impressively broad species coverage. However, it does not allow for the annotation of morphological diversity in organelle shape, and therefore cannot be used to study the evolution of organelles.
1.4.2 Morphological Databases for Comparative Cell
Morphol-ogy
Projects such as the Cell Image Library show that there is a growing interest in studying diversity at the level of cells and organelles. Like many biodiver-sity catalogues this project harnesses the power of community efforts to unite researchers from around the globe to work together on a single centralized project. In order to ensure congruity between different projects, these reposi-tories standardize methods for annotation and quantification. Most of these projects also have a very strong “human” component: Annotations are done by knowledgable domain experts (as opposed to automated image analysis). Lastly, whether studying model organisms, cells, animals or plants, the central unit of data is the image, which remains linked to the data derived from it. From each of these projects we can learn valuable lessons which will guide the creation of a catalogue of diversity in cilia and centrosomes.
1.5
Outline of this thesis
The eukaryotic kingdom is brimming with morphological diversity, and despite decades of research, we lack a general understanding of how (and why) cells are the way they are. In this thesis we will take the “comparative” approach to cell biology, and study diversity as it naturally occurs in species throughout the eukaryotic kingdom. The chapters presented in this thesis address different aspects of comparative cell biology ranging from the evolution of shape to the evolution of amino acid motifs. What they have in common is that each of these requires development of novel bioinformatics approaches.
mtoc-explorer.org: a community based resource to study the evolution of MTOCs. Over a period of two years reseachers from around the globe uploaded and annotated EM images of MTOCs from species covering the entire eukaryotic tree. Using this dataset we can for the first time adress how organelles evolve from a morpholoigcal perspective.
In the chapter 3 we combine “comparative morphology” and “comparative genomics” benchmark how well we can link genotypes with phenotypes in cell biology. “Phylogenetig profiling” can be used to predict protein’s function based on whether or not it is present in all species with a particular phenotype (or morphology). Using the dataset generated in chapter 2 we ask how well “phylogenetic profiling” works using the presence of the eukaryotic cilium as a target phenotype, and what the main factors are that affect its performance.
The Evolutionary Cell Biology
of Cilia and Centrosomes
Abstract
One of the cornerstones of evolutionary biology is the study of morphological diversity, and how functional constraints shape the landscape through which this diversity is explored. Although this concept has been studied in organisms, its role in shaping cell biology is still poorly understood. By using cilia and centrosomes as model organelles we identify how function dictates morphological diversity in cells. Cilia and centrosomes are microtubule organizing centers (MTOCs) observed in all major eukaryotic branches, and play key roles in cell motility and division. Their stereotypical arrangement of 9-fold symmetrical doublet and triplet microtubules strongly suggests this conformation originated in the first eukaryote over a billion years ago. However these organelles have diversified in both structure and function in different eukaryotic branches.
To catalogue the diversity of MTOCs we created mtoc-exlorer.org: a com-munity resource to collect and share images of microtubule derived organelles. Each image is annotated using an ontology designed to allow a detailed struc-tural description of these organelles. With over 500 images from more than 100 species, this unique resource allows us to study the evolution of organelles.
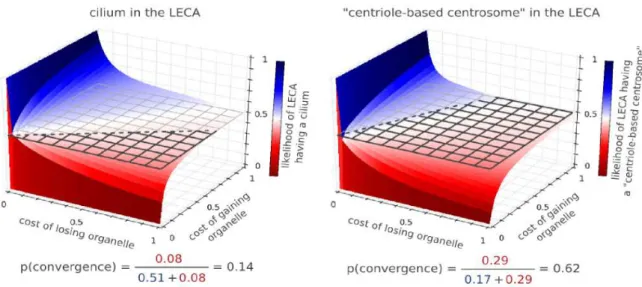
con-straints the morphology of the mitotic apparatus, an evolutionary phenomenon known as a “spandrel”. Lastly we develop Maximum Parsimony Landscapes, a method to test for convergent evolution across long evolutionary time-spans, and show that the centriole-based centrosome has evolved multiple independent times in almost all eukaryotic branches. This research shows that principles known to govern the evolution of plants and animals also operate in cell biology.
This is the first time that the evolution of a set of organelles has been studied quantitatively in great detail across such a broad taxonomic range. By creating a centralized resource to collect images, and a language to communicate and measure morphological diversity, we show that the interplay between structure and function also operates at a cellular level. We feel that the conceptual framework we present will not only offer novel insights into cell biology, but that it also can be used to study morphological diversity at any biological scale.
Publication
This chapter is currently being prepared as a manuscript for publication.
Author’s contributions
This chapter marks the major part of the work performed during my PhD. As such I was responsible for conducting the experiments for this chapter, as well as writing the text and creating the figures. This work and writing was done in close collabration with Jos´e Pereira-Leal and M´onica Bettencourt-Dias.
We recieved extraorinarily valueable input from: Zita Carvalho-Santos, Renato Alves, Yoan Diekmann, Juliette Azimzadeh, Keith Gull and Michel Bornens.
2.1
Introduction
The cell is the fundamental unit of life, as posited by the “cell theory” (see (Mazzarello, 1999) for a historical review). Cells accomplish their function in highly diverse spatial and environmental conditions, as unicellular organisms or part of large consortia of multicellular organisms, and with very diverse and distinct intracellular organisation. The evolution of this diversity is unclear. While major efforts have been put into understanding the molecular and developmental mechanisms behind the evolution of species, little attention has been devoted to evolution of the cell itself (Lynch et al., 2014). One of the major challenges in cell and molecular biology, as well as in evolutionary biology is thus to determine how cells originate, acquire and diversify their internal and external architecture (Biggins and Welch,2014; Lynch et al., 2014).
The emergence of the eukaryotic cell, dubbed one of the major transitions in evolutionary biology (Maynard Smith and Szathm´ary, 1995) is particularly fascinating as it represents the transition from a simple cell plan to a complex, highly compartmentalised one (Diekmann and Pereira-Leal, 2013). Many recent studies have focused on analysing the evolution of gene families that are associated with a specific organelle function and/or structure in order to gain an understanding about the origin of the organelle. The advantage of this approach is that as gene function is frequently conserved, the presence of a gene implies the presence of the function in that organism. One example is the peroxisome, whose presence is perfectly predicted by 4 highly conserved genes of the PEX family (Schl¨uter et al.,2006). However, studying gene repertoires is limited by the availability of sequenced genomes that are representative of any one specific biological trait. Furthermore, this approach can only be informative for well characterised gene families. In addition, molecules may indicate the presence of a given organelle or structure, but not its structure and regulation/context.
have been the staple of molecular cell biology research programs. We also need to look beyond sequences alone, and form a basic understanding of the structure and function of cells and organelles, and evolutionary forces that may shape them. Recent technological advances in DNA sequencing and genetics make the investigation of non-model organisms more tractable, heralding the birth of an evolutionary cell biology (Lynch et al., 2014; Brodsky et al., 2012). However, a major challenge still remains in describing, quantifying and interpreting the cellular diversity, a challenge that we address in this study, focusing on the eukaryotic microtubule organizing center (MTOC).
The microtubule cytoskeleton is both unique to and ubiquitous in eukaryotes, and was one of the major innovations during the evolution of eukaryotes (Mitchell, 2007). Cilia and centrosomes, the two major microtubule organizing centers (MTOCs) of the cell, have been model organelles for morphological diversity for over 50 years (see section 1.2 of this thesis for a comprehensive overview). Here we focus on MTOC evolution to develop a conceptual framework for evolutionary cell biology.
Cilia and centrosomes are the major MTOCs of the cell, and have existed since the LECA (Mitchell,2007; J´ekely,2007) (for a more comprehensive review of MTOCs, the reader is referred to section1.2in this thesis). They are involved in many cellular processes including sensation, motility, division, and estab-lishing cell polarity. These two structures are linked in many species through the centriole/basal body (CBB): a cylindrical organelle of 9-fold symmetrical microtubule triplets which anchors the cilium (as the basal body), and in pairs forms part of the centrosomal complex for mitosis (as the centriole). The relationship between the basal body and the centriole, as well as the canonical 9 fold symmetrical architechture associated with each of these, is by no means the norm: The microtubule cytoskeleton shows an incredibly large amount of both structural and functional diversity throughout the eukaryotic kingdom, including complete losses and re-inventions of entire organelles (for a review see (Carvalho-Santos et al.,2010)).
decorated with dynein arms, nexins, radial spokes, and a central pair of mi-crotubules. Immotile cilia are usually devoid of these decorations. However, this classical view of cilia is limited: there are many structural variations rang-ing from the presence and absence of different substructures to differences in numbers of microtubules and fold symmetry.
Likewise, the centrosome may take on a variety of different forms (for a review, see (Azimzadeh,2014)). In animal cells the centrosome is almost always a pair of centrioles (9 fold symmetrical microtubule triplets), each surrounding a cartwheel scaffold and surrounded by a pericentriolar matrix (PCM) (Azimzadeh and Bornens,2007; Bornens, 2012). There are however many variations on this theme, including the stacked centrosomes observed in many Fungi (Spindle Pole Bodies / SPBs, (Kilmartin, 2014)) and Amoebozoa (Nucleus Associated Bodies / NABs, (Roos, 1975; Ueda et al., 1999)) and the plates in Diatoms (Polar plaques, (Tippit et al., 1977)). Many other species have no mitotic MTOC visible using EM at all including many protists, higher plants and even the planarian (metazoan)Schmidtea mediterranea (Azimzadeh et al., 2012).
Cilia and centrosomes have been evolving for around 1.5 billion years (Yoon et al.,2004), and have essential roles in many extant species. The combination of structural and functional diversity balanced with a high degree of conservation makes the eukaryotic MTOC the perfect “model organelle” in which to study the morphological evolution in cell biology.
However the existence of morphological diversity alone is not enough to gain an understanding of how cilia and centrosomes evolve. In order to gain an evolutionary cell biological understanding of how organelles evolve, we will first need to create a catalogue of morphological diversity quantified in a manner that lends it amenable to computational analysis. The early decades of cell biology were characterized by a vast number publications showing Electron Microscopy (EM) images with ultrastructural details of species from throughout the tree of life. Although images are a valuable source of information, the real value lies in the expert interpretation of the structures visible in the image (Ram´ırez et al., 2007).
to annotate the morphological diversity of cilia and centrosomes from all eukaryotes. In section 2.2.2we describe how we setupmtoc-explorer.org: an online community driven resource on MTOC diversity. This database allows users (members of the MTOC consortium) to upload and annotate (using the ontology) electron microscopy images of the species they work with. This website was used to create the catalogue of diversity covering over 100 species.
Subsequently, we proceed to address the fundamental biological questions regarding the evolution of cells and organelles. In section 2.2.3 we ask how diverse these structures are, and how this diversity is distributed throughout the eukaryotic kingdom. Afterwards (in section2.2.4) we ask if this diversity is constrained, for which we develop the Morphological Diversity Index (MoDI), a new metric to quantify constraints in morphology. Next (in section 2.2.5), we examine one possible source of constraints by examining the effect of the requirement of ciliary motility on the morphological diversity of the mitotic MTOC. Lastly, we look at the historic relationship between the ciliary and mitotic machineries in section2.2.6 , and make quantitative predictions on the presence of cilia and of centriole-based centrosomes in the LECA.
2.2
Results
2.2.1 The MTOC-ontology: An ontology for MTOC
morphol-ogy
From the mid 1800’s to the late 20th
century, cell biology was almost entirely a descriptive field of science. Improvement after improvement in microscopy allowed early cell biologists to construct an increasingly accurate understanding of the inner workings of cells. The advent of electron microscopy (EM) in the 1940’s spawned an era of prolific ultrastructural descriptions of cells from all branches of life, showcasing EM images of cells, organelles and the morphological diversity that characterized them. Microtubule based organelles, due to their ease of observation and diversity, were often a focal point of these studies (Haimo and Rosenbaum,1981).
different names, and these names continue to exist to this very day: “centrioles” vs. “basal bodies” and “cilia” vs. “flagella” vs. “undulipodia” (Margulis, 1980) are just two (particularly relevant) examples. These discrepancies in nomencla-ture make it impossible to directly compare results between different studies, and hence to obtain a clear picture of how organelles evolve. However, this problem is not unique to cell biology, and one of the most applied solutions to circumvent the errors introduced by natural languages is to define a structured controlled vocabulary, or “ontology” (Vogt, 2008; Vogt et al.,2009).
The use of ontologies in biology dates back to Linnaeus, who first outlined the taxonomic system of classification we still use today (Vogt, 2008). Recently, advances in computation have resulted in an explosion of ontologies, aimed at different fields of biology (for a review see section1.3of this thesis). In summary, there are 2 different types of ontology commonly used in different fields of biology. Firstly, there are ontologies used in evolutionary biology to systematize taxonomic classification based on morphology (for instance UBERON (Mungall et al.,2012), Phenex/Phenoscape (Balhoff et al., 2010; Dahdul et al.,2010), and PATO (pato,2015; Mungall et al.,2010)). Each of these ontologies (or ontology frameworks) enables a complete description of morphological diversity of a collection of different species. However none of these ontologies are inherently capable of dealing with organelles. Second are ontologies aimed at molecular biology, including the Gene Ontology (Ashburner et al., 2000)1, as well as model organism specific databases aimed at characterizing mutant phenotypes (ZFIN (Sprague et al., 2006), FlyBase (St Pierre et al.,2014) and SGD (Cherry et al., 2012). But these ontologies are not suited for describing morphological diversity, but rather for describing the localization or process involvement of gene products. None of the existing “bio-ontologies” address the fundamental problem of how to quantify morphological diversity in organelles.
We set out to create an ontology to describe the structural and functional diversity observed in microtubule derived organelles throughout the eukaryotic kingdom. The result is an ontology of over 300 terms specifically designed for the detailed annotation of microtubule derived organelles in a species independent manner (Figure2.1). The higher levels of the ontology contain terms for the major microtubule based organelles which include cilia/flagella,centrioles,
1
spbs, nabs, and other mtocs. 2 The lower levels of the ontology allow for comprehensive description of the organelle(s), including terms for orientation,
maturation and position within the cell (where applicable), as well as organelle specific descriptors for structural components and morphology.
Other than a detailed description of the morphological features shown in each image each annotation is also accompanied by itsimage metadata: information associated with the image, including its source, species, tissue type, life cycle/developmental stageandcell cycle stage. Each annotated image is therefore a detailed ultrastructural description of an organelle including information on the cellular and species context. Thus it becomes possible to compare the MTOCs of (for example) interphase vs. mitotic cells of a single species or spermatozoids between different species. This information is typically not visible in the EM image itself, and needs to be extracted from the image’s publication (or annotated by the person responsible for creating the sample).
The ontology was initially developed in collaboration with a team of experts working in various fields of cilia/flagella and MTOC research, and new terms were added to the ontology as novel specimens of diversity were encountered. During the development process decisions were made on precise definitions for each term to remove the ambiguities prevalent in the MTOC literature. For instance we strictly define abasal body as “a cylindrical shaped microtubule based organelle that anchors a cilium/flagellum” vs. acentriole, which is
2
We usethis fontto specify when we refer to terms in the ontology andthis one do denote relationships.
“a cylindrical shaped microtubule based organelle forming part of the mitotic apparatus”. More details about the ontology and how it was developed can be found in the Methods section2.4.2.
The process of annotating an image consists of describing the observed structures exclusively in terms of the ontology. Figure2.1B gives an example of an annotated cilium (from Geimer and Melkonian (2004)). The image shows a from Chlamydomonas reinhardtii Transition Zone (part of the cilium) with 9 fold symmetry, 2 microtubules per rotation, 0 central microtubules, transitional fibers (which are also 9 fold symmetric) and stellate fibers. The remainder of the information is available from the publication and surrounding text.
By annotating an image using an ontology, a single EM image becomes translated to a series of datapoints that contain all of the important information contained in the image and its expert interpretation. This includes information on both morphological diversity as well as its context, and any information not directly visible in the image. And lastly, by creating a single unified language, we can directly compare annotations created by individuals from different parts of the globe working in different model systems. A large collection of images can thus be translated to a dataset, which is now amenable to computational analysis.
2.2.2 mtoc-explorer.org: a database for MTOC diversity
One of the challenges in any comparative morphology project is obtaining a collection of well annotated data from a wide range of species. In many other fields of comparative biology, this gap is being filled by creating online resources and community projects which enable large communities of experts in different species to combine their knowledge into a single centralized repository. For a comprehensive review, the reader is referred to section1.4 of this thesis.
One recent project has started to collect images on morphological diversity in cells: “The Cell: An Image Library” (library, 2015) is a resource in which users can upload images of cells and organelles, and includes the option to annotate these images using the Gene Ontology (Ashburner et al.,2000). However the Gene Ontology does not allow the annotation of morphological diversity (see section 2.4.2). What all of these projects have in common is that they involve community projects in which experts in certain fields upload and annotate images. This aspect of morphology is very important: A raw image alone may not convey all of the important morphological data, but remains essential to be able to return to in case of doubt, ambiguity or to serve as a reference (Ram´ırez et al., 2007).
Mtoc-explorer.org is a community resource that was created to capture the diversity in cilia and centrosomes from the entire eukaryotic kingdom (Figure 2.2). On the site members can upload and annotate EM images showcasing morphological diversity in cilia or centrosome structure using the mtoc-explorer ontology (see section 2.2.1). Members can annotate EM images from previously published data or contribute original (unpublished) EM. The complete content of the site is publicly available, and can be searched and browsed by species, structure or publication/authorship.
2.2.3 Morphological diversity in cilia across the eukarotic king-dom
Cilia and centrosomes are among the most prominent examples of diversity in cell and organelle morphology. To determine the evolutionary processes behind this diversity, we must first determine how this diversity is distributed throughout the eukaryotic kingdom. The first task we undertook with the catalog of annotated images inmtoc-explorer.org is a purely descriptive study in which we ask: “What is where?”.
The cilium exists in all major branches of eukaryotes, however we do not know if they all have “the same” cilium, or whether different morphologies exist as taxon specific innovations. Specifically we wanted to address this question for the three major components of the eukaryotic cilium (the Axoneme, Transition Zone and Basal Body). This challenge involves summarizing the morphological annotations from over 200 images representing 75 different species described by over 150 ontological terms.
Inspired by the use of color gradients in heatmaps, we developed a “morpho-logical heatmap” (Figure2.3) in which we represent the diversity observed in a specific taxon by plotting the frequency of each annotation across all images belonging to that taxon. For example: stellate fiberscharacteristic of the Chlamydomonas reinhardtii Tranzition Zone appears to be a structure specific
to Viridiplantae.
The structures typically associated to the “canonical cilium” (9-fold sym-metry with2 microtubules in theaxoneme and3 microtubules in thebasal body along with a basal body cartwheel and transitional fibers in the
transition zone) are present in all major eukaryotic lineages. The structures typically associated with cilium motility (such as the central pair of micro-tubules, inner dynein armsandouter dynein arms, radial spokesandnexin fibers) are likewise present in all major eukaryotic lineages. These results favour the notion that the “canonical motile cilium” was probably present in the Last eukaryotic Common Ancestor, a hypothesis we test later in section 2.2.6.
raises the question of whether or not there are any limits or constraints to this diversity.
2.2.4 Measuring morphological constraints in the eukaryotic
cilium
One of the most striking phenomena in biology is that the observed variation in shape, although abundant, is much smaller that what we could imagine to be possible. This lack of morphological diversity is attributed to constraints in the morphological space (or “morphospace”) (Hall,2008; Raup,1966; Raup and Michelson, 1965) available to living organisms. While evolutionary constraint has been abundantly explored in areas of biology such as paleontology, quanti-tative genetics and evo-devo (Arnold,1992; Smith et al., 1985), little attention has been paid to the role of constraint in the evolution of cellular architecture and function. We set out to quantify morphological constraints in the evolution of cells using the annotated image collection in mtoc-explorer.org.
In evolutionary biology the term “constraint” is often loosely defined (Pigli-ucci, 2007; Antonovics and Tienderen, 1991). Some argue that a “constraint” must be the result of (bio-) physical restrictions on form or function (Pigliucci, 2007; Pigliucci and Kaplan,2000). A lack of morphological diversity may simply originate from a lack of genetic variation available for selection, resulting in historical contingency, and is therefore not indicative of abona fide “constraint”. Others, however, argue that historical contingency is simply another level of “constraint” in the evolution of an organism (Shanahan,2008), and we will view “constraints” as any limitations in the outcome of evolution (see the reply to (Pigliucci and Kaplan,2000) by (Getty,2000)). This approach becomes more meaningful in large pan-species analyses (Sansom,2008), in which the lack of any existing morphological variation directly implies some type of constraint on the outcome of evolution, regardless of its source (Arnold,1992; Mezey and Houle,2005).
as a central pair of microtubules. This would directly imply an “all or nothing” constraint on the presence/absence of these three structures, compared to the theoretical possibility of their presence/absence being independent of each other. We set out to determine if the cilium is morphological constrained, whether these constraints are differently distributed between different components of the cilium, and whether they are affected by functional requirements.
The level of constraint was measured by examining the co-occurrence of annotations across all images in mtoc-explorer.org compared to what would be expected by unconstrained evolution. This amounts to estimating the size of the theoretically available “morphospace”, and measuring the fraction of this space inhabited by the observed data. To achieve this we developed the Morphological Diversity Index (MoDI): a metric that quantifies constraint for a collection of (morphological) data annotated with an ontology.
The Morphological Diversity Index (MoDI) is based on finding the dimen-sionality of the existing “morphospace” compared to a theoretically possible “morphospace”, by measuring co-occurrence of annotations across images
(Fig-ure 2.4). To calculate the MoDI we first need to quantify the amount of co-variance in morphology (annotations). The rank of the covariance matrix of annotations represents the number of independent “morphospace” dimensions of the phenotype (Pavlicev et al., 2009). Essentially this amounts to performing Principal Component Analysis (PCA) on all annotations for a set of images, thereby removing all internal correlations between correlated morphologies. This number of components equals the “morphospace” populated by species annotated in the database.
The size of the theoretically possible “morphospace” estimated by creating 1000 random permutations of the existing annotations, simulating evolution in the absence of constraints, and performing PCA on each of these simulated datasets. The final MoDI is the number of principal components of observed data (i.e. observed diversity) divided by the average number of principal components of theoretically possible data (i.e. possible diversity). For more details on how the MoDI is calculated see the methods section 2.4.4. A MoDI close to 1 indicates that most of the possible morphologies exist, and hence low level of constraint, whereas a low MoDI suggests a high level of constraint.
the data of the 101 species in mtoc-explorer.org, we examined whether the observed morphological diversity showed any signs of constraint using the MoDI. Figure2.5 shows that cilium is morphologically constrained, and only displays approximately 0.50 of theoretically available morphologies. As the MoDI is generic, it is not limited to measuring the level of constraint in an organelle, but can also be used to measure and compare constraints across different organelles, and different parts of an organelle. Figure 2.5 shows that the axoneme and transition zone are both structurally constrained to 0.55 and 0.58 respectively. The basal body, however, appears to be much more constrained than the axoneme and transition zone. These results show that both organelles as well as their components are morphologically constrained, and that there are different levels of constraint in different parts of cilium.
There are many different types of cilia which all fall into one of two functional categories: motile and immotile. We split the collection of cilia annotations into two groups – motile and immotile – and asked if motility had an effect on their morphological diversity. The MoDI of motile cilia (0.47) is significantly lower than that of immotile cilia (0.63), suggesting that the functional requirement of motility constrains the number of available morphologies (Figure 2.6).
2.
2.
R
es
u
lt
images containing “Axonemes” and performing Principal Component Analysis (PCA) to quantify the degree of similarity within this set of images. In order to determine the number of components expected by unconstrained evolution we perform the same calculation using random permutations of the original annotations. The MoDI is defined as the fraction of “observed diversity” vs. the mean “possible diversity”. Values below 1 indicate that the “observed diversity” is limited, i.e. less than the “possible diversity”.
e
E
vol
u
tion
ar
y
C
ell
B
iol
ogy
of
C
ili
a
an
d
C
en
tr
os
om
es
2.
2.
R
es
u
lt
motility constraints the morphology of motile cilia.