177
Estimates of population parameters and consumption/biomass ratio for
fishes in reservoirs, Paraná State, Brazil
Éder André Gubiani
1, Luiz Carlos Gomes
2and Angelo Antonio Agostinho
2Consumption, natural mortality, and growth are important parameters for the construction for both fisheries and ecosystems models. We estimated k (growth constant of the von Bertalanffy’s function), Loo1(asymptotic length), Woo(asymptotic weight), Ar (caudal fin index), M (natural mortality), and Q/B (consumption/biomass ratio) for several fish species inhabiting reservoirs. We explored possible relationships among these parameters for 135 fish species sampled in thirty reservoirs in the State of Paraná, southern Brazil. Maximum length (Lmax) varied from 2.60 to 79.00 cm, Loofrom 2.73 to 85.05 cm, Woo from 0.23 to 9,490.26 g, k from 0.01 to 2.38 yr-1, Ar from 0.03 to 3.60, M from 0.16 to 2.82 yr-1, and Q/B from 3.31 to 67.18. Significant correlations were observed
between most pairs of parameters, except for Ar and k, Ar and Loo, and for M and Q/B. The estimates presented here may be useful for constructing Ecopath models, both in Brazil and other tropical regions, where the use of ecosystem modeling is growing. O consumo, a mortalidade natural e as estimativas de crescimento são parâmetros importantes para a construção de modelos pesqueiros e ecossistêmicos. Dessa forma, neste trabalho foram calculados os parâmetros k (constante de crescimento da equação de von Bertalanffy), Loo
(comprimento assintótico), W
oo(peso assintótico), Ar (índice da nadadeira caudal), M
(mortalidade natural) e Q/B (consumo/biomassa) para peixes em reservatórios. Além disso, foram exploradas possíveis relações entre esses parâmetros para 135 espécies de peixes amostradas em 30 reservatórios no estado do Paraná, sul do Brasil. O comprimento máximo (Lmax) variou de 2,60 a 79,00 cm, Loode 2,73 a 85,05 cm, Woode 0,23 a 9.490,26 g, k de 0,01 a 2,38 ano-1, Arde 0,03 a 3,60, M de 0,16 a 2,82 ano-1, e Q/B de 3,31 a 67,18. Correlações significativas foram observadas entre todos os pares
de parâmetros, exceto para Ar e k, Ar e Looe para M e Q/B. As estimativas aqui apresentadas podem ser úteis para a construção de modelos Ecopath, tanto em outras regiões tropicais, como no Brasil, onde os modelos ecossistêmicos estão em amplo estágio de desenvolvimento.
Key words: Ecosystem approach, Lentic ecosystems, Population’s variables.
1Universidade Estadual do Oeste do Paraná, Centro de Engenharias e Ciências Exatas, Gerpel, Grupo de Estudos em Recursos Pesqueiros
e Limnologia, Programa de Pós-Graduação em Recursos Pesqueiros e Engenharia de Pesca. Rua da Faculdade, 645, 85903-000 Toledo, PR, Brazil. egubiani@yahoo.com.br (EAG)
2Universidade Estadual de Maringá, Programa de Pós-Graduação em Ecologia de Ambientes Aquáticos Continentais, Departamento de Biologia,
Nupélia. Av. Colombo, 5790, 87020-000 Maringá, PR, Brazil. lcgomes@nupelia.uem.br (LCG), agostinhoaa@nupelia.uem.br (AAA)
Introduction
Estimates of growth parameters for fish species are important not only to understand their life history and behavior, but also to manage fishery resources, since they allow estimating the potential productivity (Nikolsky, 1969; Gulland, 1977). Several studies point out to the lack of important biological parameters to estimate yield and give support to management, especially for tropical fish (Pauly, 1998a, 1998b; Beverton, 1998; Holt, 1998). Worldwide, it is known approximately 28,000 fish species (Nelson, 2006), among these only 1,400 (5%) have information on growth available (Binohlan & Pauly, 2000); in the Neotropical region such information should be even less available.
The knowledge of growth parameters (e.g. von Bertalanffy
growth constant k and asymptotic length Loo, maximum reported length and age (Lmax and tmax, respectively) as well as the consumption/biomass ratio (Q/B), and natural mortality (M) are important parameters for building ecosystems models (e.g. Ecopath; Christensen & Pauly, 1993), several other fishery
models and, consequently, managing fishery resources (Froese & Pauly, 2000; Froese & Binohlan, 2000, 2003). In addition, these parameters allow testing life history theories and obtaining preliminary estimates of other parameters from those already available (Froese & Binohlan, 2000, 2003; Stergiou & Karpouzi, 2002; Stergiou & Karachle, 2006).
maximum reported length, natural mortality from growth parameters, optimum exploitation length from asymptotic length or length at first maturity, length at first maturity from asymptotic length and/or von Bertallanfy growth constant, trophic level from maximum reported length (Pauly, 1980; Froese & Binohlan, 2000; Stergiou & Karpouzi, 2002; Angelini & Agostinho, 2005a). Recently, there has been an increase in the number of studies using the ecosystem approach, which justifies compiling the cited parameters values for future use in the building of Ecopath models. Moreover, information on Neotropical fishes can be uploaded to online databases, such as the FishBase (Froese & Pauly, 2010). Thereby, in this study, we estimated/compiled the parameters k (growth constant of the VBGF), Loo
(asymptotic length), L
max (maximum reported length), Woo(asymptotic weight), Ar (caudal fin index), M
(natural mortality) and Q/B (consumption/biomass) for 135 Neotropical fish species collected in 30 reservoirs in the State of Paraná, southern Brazil. In addition, we evaluated possible significant relationships between k and Lmax, k and Look and
Woo, k and M, k and Ar, k and Q/B, L
ooand Q/B, W
ooand Lmax, M and Ar, and M and Lmax. Finally, we made a trophic categorization for all species considered in this study. All analyses were performed aiming at detecting patterns in the life history of those fish species.Material and Methods
Study area. The study reservoirs were located in six river
basins (Paranapanema, Tibagi, Ivaí, Piquiri, Iguaçu, and Leste) throughout the State of Paraná and its borders with the States of São Paulo and Santa Catarina (Fig. 1; Table 1). Although the main purpose of these reservoirs is energy production, they are also used for water supply, and for fishing and leisure. Reservoirs were selected to include a diversity of areas, morphometries, hydraulic retention times and distribution throughout the state. More detailed description of some characteristics of each reservoir is presented in Table 1.
Sampling. Fishes were sampled in 30 studied reservoirs (Table
1); two samplings were carried out, one in July and another in November 2001. Samplings were conducted in the lacustrine zone of the reservoirs (following Thornton et al., 1990) with
20-m-long gillnets of diverse mesh sizes (2.4, 3, 4, 5, 6, 7, 8, 9, 10, 12, and 14 cm opposite knots), set for 24 h and checked every 8 h. Seine nets (20 m long and 0.8 cm mesh) were used during the day in the littoral.
All fishes caught were fixed in formalin (4%), stored in polyethylene containers identified with date and capture site, and then sent to the laboratory of Núcleo de Pesquisas em Limnologia, Ictiologia e Aquicultura (Nupélia; Universidade Estadual de Maringá- UEM) for further analysis. Fish were identified according to Severi & Cordeiro (1994), Ingenito et al. (2004), Oyakawa et al. (2006), Graça & Pavanelli (2007) and
Menezes et al. (2007), measured for length (total and standard,
cm), and weight (total body weight, g).
Data analyses. Trophic categorization of most species was
based on studies conducted in the reservoirs evaluated here. However, when it was not possible we used information from the literature. For this, additional references included Fugi & Hahn (1991), Hahn et al. (1991, 1992, 1997a, 1997b, 1998, 1999),
Andrian et al. (1994), Souza-Stevaux et al. (1994), Andrian &
Barbieri (1996), Ferreti et al. (1996), Lolis & Andrian (1996),
Loureiro & Hahn (1996), Agostinho et al. (1997), Almeida et al. (1997), Gealh & Hahn (1998), Abujanra et al. (1999), Fugi et al. (2001, 2005), Ortêncio Filho et al. (2001), Cassemiro et al.
(2002, 2003, 2005), Abelha & Goulart (2004), Russo et al. (2004),
Abelha et al. (2005, 2006), Bennemann et al. (2005, 2006),
Loureiro-Crippa & Hahn (2006), Oricolli & Bennemann (2006), and Cantanhêde et al. (2008).
For species with more than 50 individuals the parameters k and Loo were estimated from the sampled data. Growth parameters were obtained by fitting von Bertalanffy’s growth constant function (VBGF; Ricker, 1975), which calculates the parameters k (growth constant) and Loo
(asymptotic length),
as follows:k t t0
t
L
1
e
L
f
u
,where Lt is the total fish length (cm) at age t, Loo is the asymptotic length (cm), k is VBGF’s inclination or growth rate (year-1), and
t0 is the age intercept (fish age is assumed to be zero). Asymptotic length (Loo) and k were calculated, whenever possible, using length-frequency data and FISAT’s ELEFAN I routine (Sparre et al., 1989; Gayanilo & Pauly, 1997), with the
option of scanning for k-values. This routine estimates VBGF’s adherence to length frequency data. Sometimes, the best-fitted k value was corroborated by the literature or by FISAT’s routine “by eye”, which fits the VBGF visually. When the collected data did not allow fitting, we used published data (Perez Lizama & Vazzoler, 1993; Angelini & Agostinho, 2005a; Froese & Pauly, 2010; Table 2). When it was not possible to obtain VBGF parameters, Loo
was estimated using the length
of the largest individual of the population sample: Loo= Lmax * 1.05 (Angelini & Agostinho, 2005a).Production, according to Ivlev (1945), is the “total quantity of tissue elaborated by a fish population during a stated period of time, although not all individuals survive until the end of that period”. As the production/biomass (P/B) ratio is hard to estimate directly, it can be considered equivalent to total mortality [Z = fishing mortality (F) + natural mortality (M)] (Pauly et al., 2000). The study reservoirs have negligible fishing
activity, if any. Thus, as shown by Allen (1971) under equilibrium conditions, the P/B ratio is similar to natural mortality (M), which was calculated with the empiric regression of Pauly (1980):
0.463 0.279
0.65
L
T
k
M
u
fu
where M is natural mortality (year-1), k and L
ooare the VBGF’s parameters, and T is the average annual water temperature (average for the 30 reservoirs; in ºC).
relatively easy to estimate for fish populations (Palomares & Pauly, 1989, 1998; Pauly, 1989; Pauly et al., 1990; Jarre et al.,
1991). It is interesting to notice that Q/B values for the same species vary as a result of using different empirical formulas and predictor parameters; for example, there might be variation in measurements of proportion and asymptotic weight, as well as in the type of food consumed by a species. To estimate Q/B we used the empiric regression model proposed by Palomares & Pauly (1998), as follows:
logQ/B=7.964-0.204logWoo-1.965T’+0.083Ar+0.532H+0.398D where Q/B is consumption/biomass rate (year-1), W
oois the asymptotic weight (wet weight in g, estimated based on the length/weight relationship for Loo); T’ is the inverse of the average annual water temperature (T’=1000/G+273.15), where G is the average water temperature of the 30 reservoirs (oC); Ar is the caudal fin index (Ar=h2/s, where h
is the caudal fin height (mm) and s is the caudal fin surface area (mm2), extending to the narrowest part of the caudal
peduncle) and a measure of the swimming and metabolic activity of the fish (Palomares & Pauly, 1998). Ar values were estimated by measurements of five individuals, when possible, per species (analyzed individuals were deposited in the collection of Museu de Ictiologia, Nupélia). Variables H and D refers to feeding behavior, i.e., H=1 for
herbivorous, D=1 for detritivorous and H=D=0 for carnivorous. Values of average annual water temperature, for both equations listed above, were provided by the limnology laboratory of Nupélia (Table 1).
We tested significant relationships between k and Lmax, k and Loo, k and Woo, k and M, k and Ar, k and Q/B, Loo and Q/ B, Woo and Lmax, M and Ar, and M and Lmax with linear regressions. All these relationships are relevant to the study of life history (Jensen, 1997; Froese & Pauly, 2000; Froese & Binohlan, 2000, 2003).
Results
Lmax varied from 2.60 to 79.00 cm. Loo from 2.73 to 85.05 cm. The values of Loofor 34 species (Table 2) were compiled from the literature; among these species C. modestus, A. altiparanae, P. britskii, A. gymnogenys, G. brasiliensis, H. aff. malabaricus, R. quelen and S. melanodermatum
showed Loo
less than the L
max recorded in this study. Woo from 0.23 to 9,490.26 g, k from 0.01 to 2.38 yr-1, Ar from 0.03to 3.60, M from 0.16 to 2.72 yr-1, and Q/B from 3.31 to 67.18
(Table 2).
The 135 fish species captured were categorized in six trophic categories (detritivorous, herbivorous, insectivorous,
invertivorous, omnivorous, and piscivorous; Table 2). Insectivorous (30 species), detritivorous (29 species) and piscivorous (26 species) were the trophic categories with higher number of species, respectively. Omnivorous (23 species), invertivorous (15 species) and herbivorous (12 species) showed smaller number of species (Table 2).
Various relationships were apparent with the VBGF. In this sense, k was significant negatively related to maximum length, and asymptotic length and weight (F = 45.00, F = 62.80 and F = 59.60, respectively; Figs. 2a, b, c). The piscivorous species R. quelen showed low annual growth rate (k = 0.01
year-1; Table 2) and low natural mortality, whereas O. niloticus
(k = 2.38 year-1; Table 2) showed the opposite trend; both
were considered outliers (Fig. 2). On the other hand, relationships between k and caudal fin index, and natural mortality (F = 458.38; Fig. 2e) and consumption/biomass ratio (F = 30.43; Fig. 2f) were positive.
The relationship between k and caudal fin index was not significant (F = 0.02; Fig. 2d). The fin shape of knifefishes G. sylvius and E. trilineata strongly affected the relationship
(Fig. 2d); but even after their exclusion the relationship was still non-significant (F = 0.16; p = 0.68). Rhamdia quelen and O. niloticus did not follow the general relationship between k
and consumption/biomass ratio (Fig. 2f).
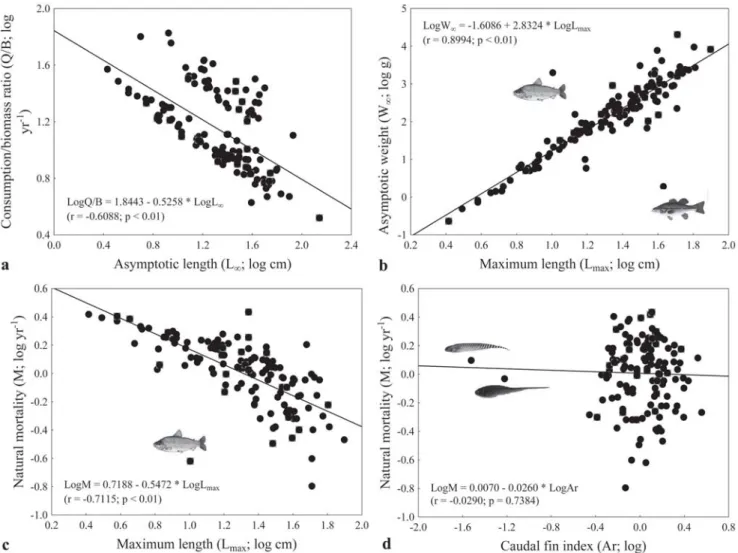
The relationship between asymptotic length and consumption/biomass ratio was negative (F = 78.33; Fig. 3a).
Interestingly, the species above the regression line in Figure 3a represent small- and medium-sized species that are mostly detritivorous and have high population growth rates. The relationship between maximum length and asymptotic weight was positive (F = 563.14; Fig. 3b). The species M. salmoides
(located below the regression line) and L. macrocephalus
(located above the regression line) were outliers.
The relationship between natural mortality and maximum length was negative (F = 136.37; Fig. 3c). The species L. macrocephalus was an outlier; when this fish was removed,
the relationship showed stronger non-linear tendency (Spearman U= -0.80; p < 0.05). The relationship between natural mortality and caudal fin index was not significant (F = 0.09; Fig. 3d), following the same trend observed for the relationship between k and caudal fin index. Similarly, after exclusion of the knifefishes, the relationship was still non-significant (F = 0.06; p = 0.80).
Discussion
In this study we obtained significant relationships among various biological parameters. These relationships can be useful to obtain other estimates, such as yield per recruit (Y/R), which can be easily calculated from Lmax, Wmax, tmax, and Ar, among others. Significant negative relationships were established between the parameters k and Lmax, k and Looand k and Woo. On
Table 1. Some characteristics of the study reservoirs (a - Perimeter estimated in GoogleTM Earth. Depth = maximum depth, R.T.
= Hydraulic retention time, A.A.W.T. = average annual water temperature). Consulted references: Júlio Jr. et al. (2005), Angelini
& Gomes (2008), Companhia Paranaense de Energia Elétrica (2007), Comitê Brasileiro de Barragens (2007).
Reservoir River Basin Damming Year Basin area Area (km2) Perimetera (km) Depth (m) R.T. (days) Volume (km3) A.A.W.T.
(ºC)
Taquaruçu Paranapanema Paranapanema 1992 88000 80.1 156.35a 26.5 7.9 672.5 23.6
Capivara Paranapanema Paranapanema 1975 85000 419.3 738.93a 52.5 126.8 10540.0 23.7
Canoas II Paranapanema Paranapanema 1999 39556 22.5 65.81a 16.5 4.4 140.0 23.5
Canoas I Paranapanema Paranapanema 1999 40920 30.8 74.64a 26.0 6.0 207.0 23.9
Salto Grande Paranapanema Paranapanema 1958 38600 12.0 24.91a 9.2 1.4 44.2 21.9
Chavantes Paranapanema Paranapanema 1970 27500 400.0 401.84a 78.0 352.7 8795.0 21.9
Rosana Paranapanema Paranapanema 1986 99000 220.0 230.32a 26.0 18.6 1920.0 24.1
Alagados Pitangui Tibagi 1945 377 7.2 47.20 9.2 46.0 0.03 19.8
Apucaraninha Apucaraninha Tibagi 1958 513 2.0 16.90 - 12.0 0.015 20.3
Harmonia Harmonia Tibagi 1950 - 3.0 7.49a 12.0 - 8.0 20.9
Patos Patos Ivaí 1949 1086 1.3 3.20 5.7 0.2 0.0008 18.5
Mourão Mourão Ivaí 1964 573 11.3 60.00 12.7 70.0 0.065 20.9
Cavernoso Cavernoso Iguaçu 1965 1460 2.9 3.73a 8.3 - - 19.5
Salto Santiago Iguaçu Iguaçu 1979 43900 208.0 376.99a 78.0 - 6753.0 21.6
Salto Osório Iguaçu Iguaçu 1975 45800 51.0 180.16a 43.0 - 1270.0 21.2
Salto Caxias Iguaçu Iguaçu 1998 57000 124.0 267.14a 53.0 - 3573.0 21.8
Foz do Chopim Chopim Iguaçu 1970 3800 2.9 5.25a 6.0 - - 20.1
Jordão Jordão Iguaçu 1996 4700 3.4 21.74a 60.0 - 110.0 18.4
Curucaca Jordão Iguaçu 1982 - 2.0 3.70a 10.5 - - 17.5
Foz do Areia Iguaçu Iguaçu 1980 29900 139.0 288.67a 135.0 - 5779.0 20.7
Passauna Passaúna Iguaçu 1978 - 14.0 35.30a - 420.0 - 16.5
Piraquara Piraquara Iguaçu 1979 - 3.3 40.00 18.0 438.0 0.5 19.9
Salto do Vau Palmital Iguaçu 1959 340 2.0 - 3.5 - 0.0003 16.2
Iraí Iraí Iguaçu 2000 - 15.0 20.12a 8.5 240.0 - 20.0
Santa Maria Piquiri Piquiri 1950 - 0.1 - 4.3 - - 16.7
Melissa Melissa Piquiri 1962 368 2.9 - 5.3 - - 17.9
Guaricana Arraial Leste 1957 - 7.0 7.20 17.0 13.0 0.00683 19.9
Vossoroca São João Leste 1949 160 5.1 18.49a 12.5 - 0.04 19.0
Salto do meio Cubatão Leste 1931 252 0.1 3.90a 6.2 - 0.0004 18.3
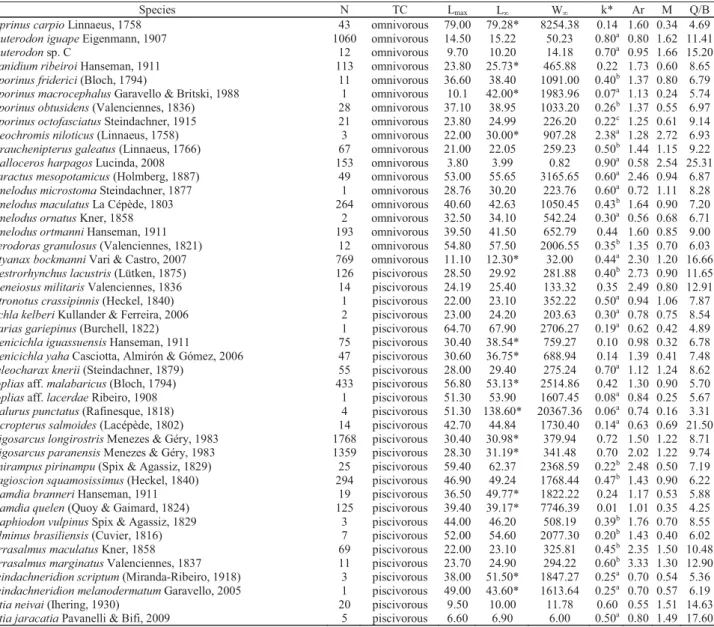
Table 2. Demographic and biological attributes of 135 fish species captured in 30 reservoirs in the State of Paraná, southern
Brazil, in July and November 2001. N = number of individuals captured, TC = species’ trophic category, Lmax = maximum length (cm), Loo= asymptotic length (cm; values with asterisk were obtained of the literature), Woo= asymptotic weight (g), k = growth constant from von Bertalanffy’s equation (year-1), Ar = caudal fin index (Palomares & Pauly, 1998), M = natural mortality
(year-1) and Q/B = consumption/biomass ratio (year-1). a - Froese & Pauly (2010), b - Angelini & Agostinho (2005a), c - Perez
Lizama & Vazzoler (1993). *For species in which k was calculate, Rn (goodness of fit index) was greater than 0.6.
the other hand, k and M and k and Q/B ratio showed significant positive relationships. The first relationship can be used for estimating k from the corresponding Lmax values, which are easier to be obtained. Stergiou & Karachle (2006) also found significant negative relationship between k and Lmax for 142 fish stocks from the Greek Seas. Perez Lizama & Vazzoler (1993), in a review on marine and freshwater fish growth in Brazil, observed the same trend in the relationship between Loo and k. The negative correlation between k and Loo and k and Woo seems to be a recurrent pattern in fishes (Beverton & Holt, 1959; Pauly, 1998a, 1998b; Froese & Pauly, 2000).
The relationship between k and Loo should provide the slope value equal to -0.33, when assuming the isometric growth (Jensen, 1997). Stergiou & Karachle (2006) updated the slope value for all Greek fish stocks and found the value of -0.3006, close to the theoretical -0.33. We found a slope value of -0.6195, which differed greatly from the theoretical value, as well as a correlation coefficient (r = -0.57), which is higher than verified by Stergiou & Karachle (2006) for Greek Seas fish stocks (r = -0.34). In addition, if we remove R. quelen and O. niloticus (which
deviated from the regression line) from the analysis, the value of the slope becomes even higher (-0.8211; r = -0.64).
Species N TC Lmax Lf Wf k* Ar M Q/B
Apareiodon affinis (Steindachner, 1879) 1096 detritivorous 15.70 16.48 55.35 0.50 1.26 1.17 30.54
Apareiodon ibitiensis Campos, 1944 3 detritivorous 4.80 5.00 1.42 0.50a 1.17 1.63 63.37
Astyanax minor Garavello & Sampaio, 2010 5564 detritivorous 13.50 13.65* 156.18 0.50 2.18 1.08 29.46 Apareiodon piracicabae (Eigenmann, 1907 39 detritivorous 11.00 11.55 18.37 0.50a 1.27 1.29 38.29
Apareiodon vittatus Garavello, 1977 170 detritivorous 14.60 17.64* 56.60 0.95 1.37 1.73 31.04
Astyanax jordanensis Alcaraz, Pavanelli & Bertaco, 2009 1 detritivorous 15.40 9.90 9.95 0.50a 1.20 1.35 42.85
Cyphocharax modestus (Fernández-Yépez, 1948) 115 detritivorous 22.00 18.00* 180.52 0.80b 0.81 1.80 27.72
Deuterodon sp. B (sensu C.S Pavanelli) 945 detritivorous 11.70 12.28 26.13 0.80 0.94 1.72 33.45
Deuterodon sp. D (sensu C.S Pavanelli) 1985 detritivorous 12.80 13.44 33.88 0.80 1.17 1.68 33.19 Hypostomus ancistroides (Ihering, 1911) 27 detritivorous 23.30 24.46 161.07 0.45a 0.52 0.98 21.33 Hypostomus commersoni Valenciennes, 1836 68 detritivorous 38.20 44.62* 2270.64 0.24 2.09 0.55 16.77
Hypostomus derbyi (Hanseman, 1911) 110 detritivorous 40.00 42.00 638.00 0.51 2.09 0.92 21.73
Hypostomus hermanni (Ihering, 1905) 1 detritivorous 11.50 12.10 27.86 0.50a 0.71 1.27 31.65
Hypostomus margaritifer (Regan, 1908) 1 detritivorous 16.20 17.00 58.66 0.30a 0.75 0.83 27.37
Hypostomus myersi (Gosline, 1947) 34 detritivorous 22.50 25.20* 188.05 0.49 1.77 1.02 26.23
Hypostomus nigromaculatus (Schubart, 1964) 1 detritivorous 11.50 12.10 23.08 0.50a 0.57 1.27 31.98
Hypostomus regani (Ihering, 1905) 23 detritivorous 24.30 25.50 215.49 0.25a 0.46 0.66 19.87
Hypostomustopavae (Godoy, 1969) 51 detritivorous 20.00 21.00 142.00 0.50 0.94 1.09 23.70
Hypostomus multidens Jerep, Shibatta & Zawadzki, 2007 10 detritivorous 29.60 31.08 385.25 0.50 0.94 0.98 19.33
Hypostomus iheringii (Regan, 1908) 5 detritivorous 29.60 36.33* 468.03 0.20a 0.35 0.52 16.60 Hypostomus strigaticeps (Regan, 1908) 1 detritivorous 20.40 21.40 146.84 0.50a 0.71 1.09 22.52 Proloricaria prolixa (Isbrücker & Nijssen, 1978) 63 detritivorous 38.60 40.53 359.87 0.20a 0.41 0.50 17.72
Loricaria sp. 15 detritivorous 27.70 29.10 110.00 0.55 1.16 1.06 26.04
Loricariichthys platymetopon Isbrücker & Nijssen, 1979 10 detritivorous 31.40 33.00 254.44 0.55b 1.16 1.10 21.95
Megalancistrus parananus (Peters, 1881) 4 detritivorous 35.50 37.30 865.82 0.26b 1.56 0.60 18.47
Prochilodus lineatus (Valenciennes, 1836) 61 detritivorous 63.70 85.05* 9490.26 0.34 2.16 0.60 12.70 Rhinelepis aspera Spix & Agassiz, 1829 3 detritivorous 34.50 36.20 825.70 0.39b 0.76 0.80 16.00
Rineloricaria sp. 71 detritivorous 16.30 20.58* 52.56 0.43 0.45 0.99 26.41
Steindachnerina brevipinna (Eigenmann & Eigenmann, 1889) 42 detritivorous 16.80 17.64 85.60 0.86b 1.39 1.63 28.62
Astyanax bifasciatus Garavello & Sampaio, 2010 7351 herbivorous 19.00 19.16* 69.74 1.00 1.40 1.81 40.73
Astyanax dissimilis Garavello & Sampaio, 2010 8 herbivorous 13.80 16.28* 57.40 0.44a 1.50 1.00 43.20 Astyanax longirhinus Garavello & Sampaio, 2010 1163 herbivorous 8.40 8.80 9.60 0.80 1.05 1.89 57.07 Bryconamericus iheringii (Boulenger, 1887) 905 herbivorous 8.00 8.40 7.68 0.70a 1.66 1.75 67.18
Ctenopharyngodon idella (Valenciennes, 1844) 1 herbivorous 43.20 45.40 965.06 0.15a 1.56 0.40 24.59
Hypophthalmichthys molitrix (Valenciennes, 1844) 1 herbivorous 40.00 42.00 1151.20 0.16a 0.93 0.48 31.78
Hypophthalmus edentatus Spix & Agassiz, 1829 4 herbivorous 47.80 50.20 1874.82 0.28a 2.04 1.60 27.48
Leporinus lacustris Campos, 1945 1 herbivorous 15.50 16.30 91.00 0.80a 1.15 1.59 36.79
Metynnis lippincottianus (Cope, 1870) 24 herbivorous 14.70 15.43 92.64 0.70a 1.26 1.48 37.45
Schizodon borellii (Boulenger, 1900) 8 herbivorous 28.00 29.40 516.00 0.42b 2.03 1.40 30.54
Schizodon nasutus Kner, 1858 234 herbivorous 33.70 35.38 567.49 0.34a 1.41 0.73 26.62
Tilapia rendalli (Boulenger, 1897) 228 herbivorous 31.50 39.27* 3064.45 0.31 1.48 0.42 19.12
Aphyocharax anisitsi Eigenmann & Kennedy, 1903 2 insectivorous 4.50 4.70 1.30 0.90a 0.80 2.43 24.06 Aphyocharax dentatus Eigenmann & Kennedy, 1903 6 insectivorous 7.50 7.90 5.00 0.80a 1.37 1.95 20.36
Apteronotus sp. 1 insectivorous 30.00 30.20* 224.00 0.60a 0.53 1.11 7.99
Astyanax altiparanae Garutti & Britski, 2000 3550 insectivorous 15.90 14.70* 80.87 0.79 1.24 1.35 12.34
Table 2 (cont.). Demographic and biological attributes of 135 fish species captured in 30 reservoirs in the State of Paraná,
southern Brazil, in July and November 2001. N = number of individuals captured, TC = species’ trophic category, Lmax = maximum length (cm), Loo= asymptotic length (cm; values with asterisk were obtained of the literature), Woo= asymptotic weight (g), k = growth constant from von Bertalanffy’s equation (year-1), Ar = caudal fin index (Palomares & Pauly, 1998), M = natural
mortality (year-1) and Q/B = consumption/biomass ratio (year-1). a - Froese & Pauly (2010), b - Angelini & Agostinho (2005a), c
- Perez Lizama & Vazzoler (1993). *For species in which k was calculate, Rn (goodness of fit index) was greater than 0.6.
The parameters estimated here are consistent with other studies, which found that smaller species have higher k values (Pauly, 1998a, 1998b; Angelini & Agostinho, 2005a). According to Pauly (1998a), the same asymptotic size may be associated with various k values. In addition, the same author showed that tropical fishes tend to be confined within a space defined by the smaller asymptotic size and higher k values than fish from temperate regions. Angelini & Agostinho (2005a) estimated the k values for 35 fish species from the upper Paraná River floodplain and Itaipu reservoir and verified that fishes with smaller asymptotic lengths showed higher k values. In this study, 55% of species
showed k value greater than 0.50; among these, except H. derbyi and P. mesopotamicus, all are considered small and
medium-sized species. In addition, in reservoirs, the fish assemblage is composed basically by small-sized fishes (Dias
et al., 2005; Agostinho et al., 2007). Those findings
intensified the pattern highlighted by Pauly (1998a) for tropical fish. The large number of small and medium-sized species with fast growth is associated with the higher temperatures recorded in the tropics. Pauly (1998a) affirm that metabolic rates increase with temperature and that growth is limited by respiratory metabolism. Thus, tropical fishes should generally remain small.
Species N TC Lmax Lf Wf k* Ar M Q/B
Astyanax janeiroensis Eigenmann, 1908 129 insectivorous 14.00 14.70 46.62 0.80a 1.19 1.64 12.47
Auchenipterus osteomystax (Ribeiro, 1918) 286 insectivorous 26.50 27.82 194.51 0.50 1.47 1.01 9.84
Bryconamericus ikaa Casciotta, Almirón & Azpelicueta, 2004 105 insectivorous 8.20 8.61 8.56 0.60 0.76 1.64 16.24 Bryconamericus sp. C (sensu C.S Pavanelli) 94 insectivorous 7.30 7.66 5.84 0.70 1.19 1.80 19.07 Australoheros kaaygua Casciotta, Almirón & Gómez, 2006 7 insectivorous 9.40 10.70* 30.60 0.40a 0.73 1.14 12.46
Corydoras ehrhardti Steindachner, 1910 7 insectivorous 6.50 6.80 6.00 0.30a 0.53 1.07 16.70
Corydoras carlae Nijssen & Isbrücker, 1983 71 insectivorous 6.70 7.03 7.14 0.34 0.53 1.15 16.12
Crenicichla britskii Kullander, 1982 16 insectivorous 13.50 14.17 32.43 0.70a 0.57 1.52 11.94
Crenicichla haroldoi Luengo & Britski, 1974 70 insectivorous 19.90 20.89 97.49 0.60a 0.60 1.23 9.60 Crenicichla niederleinii (Holmberg, 1891) 53 insectivorous 22.80 23.94 164.51 0.65a 0.62 1.25 8.65 Deuterodon sp. A (sensu C.S Pavanelli) 782 insectivorous 13.70 14.38 51.01 0.75 1.10 1.58 12.05
Gymnotus inaequilabiatus (Valenciennes, 1836) 8 insectivorous 37.50 63.00* 842.11 0.31c 1.50 0.50 7.34
Hyphessobrycon eques (Steindachner, 1882) 1 insectivorous 3.10 3.30 0.49 0.80a 1.02 2.48 30.60
Aristichthys nobilis (Richardson, 1845) 3 insectivorous 25.70 27.00 151.20 0.16a 0.75 0.48 9.02 Leporellus vittatus (Valenciennes, 1850) 11 insectivorous 20.00 21.00 98.06 0.34a 0.66 0.85 9.69 Moenkhausia aff. intermedia Eigenmann, 1908 166 insectivorous 10.20 10.71 21.23 0.41b 0.73 1.30 13.42
Pimelodella gracilis (Valenciennes, 1836) 31 insectivorous 21.40 22.47 82.25 0.60a 0.59 1.21 9.91
Pimelodus britskii Garavello & Shibatta, 2007 979 insectivorous 37.60 35.49* 696.57 0.18 1.05 0.49 7.56
Rhamphichthys hahni (Meiken, 1937) 1 insectivorous 51.00 53.60 224.00 0.50a 0.50 1.01 7.94
Roeboides descalvadensis Fowler, 1932 13 insectivorous 8.00 8.40 5.66 0.85a 1.40 1.99 19.99
Sternopygus macrurus (Bloch & Schneider, 1801) 1 insectivorous 34.50 36.20 67.57 0.50a 0.50 0.94 10.14 Triportheus nematurus (Kner, 1858) 5 insectivorous 24.00 25.20 187.00 0.70a 1.09 1.29 9.22
Bryconamericus pyahu Azpelicueta, Casciotta & Almirón, 2004 1 insectivorous 2.60 2.70 0.23 0.80a 1.24 2.62 37.25
Bryconamericus sp. D (sensu C.S Pavanelli) 4 insectivorous 7.10 7.50 5.00 0.70 1.54 1.81 21.03
Mimagoniates microlepis (Steindachner, 1876) 42 insectivorous 5.30 5.56 1.91 0.75a 0.61 2.06 21.45
Astyanax gymnogenys Eigenmann, 1911 1 invertivorous 15.60 16.40 5.82 0.74a 0.74 1.90 17.52
Callichthys callichthys (Linnaeus, 1758) 1 invertivorous 13.30 14.00 50.39 0.70a 0.52 1.52 10.81
Characidium sp. 1 invertivorous 5.20 5.50 1.45 0.80a 0.67 2.15 22.95
Corydoras cf. paleatus (Jenyns, 1842) 504 invertivorous 8.40 8.93* 12.93 0.74 1.29 1.78 16.52
Eigenmannia trilineata Lopes & Castello, 1966 3 invertivorous 35.00 36.80 103.75 0.50a 0.06 0.93 8.54
Geophagus brasiliensis (Quoy & Gaimard, 1824) 979 invertivorous 27.90 23.84* 507.05 0.37 1.20 1.54 8.53
Hemigrammus marginatus Ellis, 1911 3 invertivorous 3.80 4.00 0.73 0.80a 0.78 2.35 26.92
Hoplosternum litoralle (Hancock, 1828) 1 invertivorous 22.00 23.10 273.27 0.52b 1.68 1.20 9.55
Iheringichthys labrosus (Lütken, 1874) 571 invertivorous 33.50 35.17 439.55 0.55b 1.63 1.10 8.59
Leporinus amblyrhynchus Garavello & Britski, 1987 18 invertivorous 19.00 19.95 96.58 0.50a 0.83 1.11 10.04
Odontesthes bonariensis (Valenciennes, 1835) 53 invertivorous 41.80 52.50* 4138.51 0.24 0.85 0.48 4.68 Rhinodoras dorbignyi (Kner, 1855) 2 invertivorous 19.00 20.00 157.82 0.30a 0.86 0.79 9.13 Satanoperca pappaterra (Heckel, 1840) 7 invertivorous 20.00 21.00 190.99 0.75a 0.56 1.42 8.30
Gymnotus sylvius Albert & Fernandes-Matioli, 1999 2 invertivorous 26.60 27.90 90.18 0.70a 0.03 1.25 8.74
Odontostilbe sp. 1 invertivorous 5.80 6.10 2.78 0.80a 1.29 2.09 22.61
Astyanax aff. paranae Eigenmann, 1914 1334 omnivorous 15.60 16.38 70.42 0.75a 1.80 1.52 12.89
Astyanax serratus Garavello & Sampaio, 2010 8 omnivorous 14.20 14.90 50.26 0.70a 1.10 1.49 12.07 Astyanax gymnodontus (Eigenmann, 1911) 59 omnivorous 14.00 14.70 56.83 0.70a 1.07 1.50 11.71 Bryconamericus stramineus Eigenmann, 1908 620 omnivorous 8.40 8.82 6.25 0.80a 1.45 1.89 19.96
Rhamdia quelen is a catfish species, prefers calmer and
deeper water along banks and vegetation with a sand or mud bottom (Silva et al., 2011). Despite the large distribution of this
species, from northern Mexico to southern Argentina (Graça & Pavanelli, 2007), studies on the biological aspects of this species have been primarily conducted on captive adult fish for farming purposes (Silva et al., 2011). Thus, comparative studies on the
growth parameters for R. quelen were not found in field. On the
other hand, Oreochromis niloticus showed rapid growth,
reaching adult size in small interval of time, exhibit relatively short reproductive cycles, tolerate a variety of environmental conditions, have high capacity for hybridization and high
Table 2 (cont.). Demographic and biological attributes of 135 fish species captured in 30 reservoirs in the State of Paraná,
southern Brazil, in July and November 2001. N = number of individuals captured, TC = species’ trophic category, Lmax = maximum length (cm), Loo= asymptotic length (cm; values with asterisk were obtained of the literature), Woo= asymptotic weight (g), k = growth constant from von Bertalanffy’s equation (year-1), Ar = caudal fin index (Palomares & Pauly, 1998), M = natural
mortality (year-1) and Q/B = consumption/biomass ratio (year-1). a - Froese & Pauly (2010), b - Angelini & Agostinho (2005a), c
- Perez Lizama & Vazzoler (1993). *For species in which k was calculate, Rn (goodness of fit index) was greater than 0.6.
Species N TC Lmax Lf Wf k* Ar M Q/B
Cyprinus carpio Linnaeus, 1758 43 omnivorous 79.00 79.28* 8254.38 0.14 1.60 0.34 4.69
Deuterodon iguape Eigenmann, 1907 1060 omnivorous 14.50 15.22 50.23 0.80a 0.80 1.62 11.41
Deuterodon sp. C 12 omnivorous 9.70 10.20 14.18 0.70a 0.95 1.66 15.20
Glanidium ribeiroi Hanseman, 1911 113 omnivorous 23.80 25.73* 465.88 0.22 1.73 0.60 8.65
Leporinus friderici (Bloch, 1794) 11 omnivorous 36.60 38.40 1091.00 0.40b 1.37 0.80 6.79
Leporinus macrocephalus Garavello & Britski, 1988 1 omnivorous 10.1 42.00* 1983.96 0.07a 1.13 0.24 5.74
Leporinus obtusidens (Valenciennes, 1836) 28 omnivorous 37.10 38.95 1033.20 0.26b 1.37 0.55 6.97
Leporinus octofasciatus Steindachner, 1915 21 omnivorous 23.80 24.99 226.20 0.22c 1.25 0.61 9.14
Oreochromis niloticus (Linnaeus, 1758) 3 omnivorous 22.00 30.00* 907.28 2.38a 1.28 2.72 6.93 Parauchenipterus galeatus (Linnaeus, 1766) 67 omnivorous 21.00 22.05 259.23 0.50b 1.44 1.15 9.22
Phalloceros harpagos Lucinda, 2008 153 omnivorous 3.80 3.99 0.82 0.90a 0.58 2.54 25.31
Piaractus mesopotamicus (Holmberg, 1887) 49 omnivorous 53.00 55.65 3165.65 0.60a 2.46 0.94 6.87
Pimelodus microstoma Steindachner, 1877 1 omnivorous 28.76 30.20 223.76 0.60a 0.72 1.11 8.28
Pimelodus maculatus La Cépède, 1803 264 omnivorous 40.60 42.63 1050.45 0.43b 1.64 0.90 7.20
Pimelodus ornatus Kner, 1858 2 omnivorous 32.50 34.10 542.24 0.30a 0.56 0.68 6.71
Pimelodus ortmanni Hanseman, 1911 193 omnivorous 39.50 41.50 652.79 0.44 1.60 0.85 9.00
Pterodoras granulosus (Valenciennes, 1821) 12 omnivorous 54.80 57.50 2006.55 0.35b 1.35 0.70 6.03
Astyanax bockmanni Vari & Castro, 2007 769 omnivorous 11.10 12.30* 32.00 0.44a 2.30 1.20 16.66
Acestrorhynchus lacustris (Lütken, 1875) 126 piscivorous 28.50 29.92 281.88 0.40b 2.73 0.90 11.65
Ageneiosus militaris Valenciennes, 1836 14 piscivorous 24.19 25.40 133.32 0.35 2.49 0.80 12.91 Astronotus crassipinnis (Heckel, 1840) 1 piscivorous 22.00 23.10 352.22 0.50a 0.94 1.06 7.87 Cichla kelberi Kullander & Ferreira, 2006 2 piscivorous 23.00 24.20 203.63 0.30a 0.78 0.75 8.54
Clarias gariepinus (Burchell, 1822) 1 piscivorous 64.70 67.90 2706.27 0.19a 0.62 0.42 4.89
Crenicichla iguassuensis Hanseman, 1911 75 piscivorous 30.40 38.54* 759.27 0.10 0.98 0.32 6.78
Crenicichla yaha Casciotta, Almirón & Gómez, 2006 47 piscivorous 30.60 36.75* 688.94 0.14 1.39 0.41 7.48
Galeocharax knerii (Steindachner, 1879) 55 piscivorous 28.00 29.40 275.24 0.70a 1.12 1.24 8.62 Hoplias aff. malabaricus (Bloch, 1794) 433 piscivorous 56.80 53.13* 2514.86 0.42 1.30 0.90 5.70
Hoplias aff. lacerdae Ribeiro, 1908 1 piscivorous 51.30 53.90 1607.45 0.08a 0.84 0.25 5.67
Ictalurus punctatus (Rafinesque, 1818) 4 piscivorous 51.30 138.60* 20367.36 0.06a 0.74 0.16 3.31
Micropterus salmoides (Lacépède, 1802) 14 piscivorous 42.70 44.84 1730.40 0.14a 0.63 0.69 21.50
Oligosarcus longirostris Menezes & Géry, 1983 1768 piscivorous 30.40 30.98* 379.94 0.72 1.50 1.22 8.71 Oligosarcus paranensis Menezes & Géry, 1983 1359 piscivorous 28.30 31.19* 341.48 0.70 2.02 1.22 9.74
Pinirampus pirinampu (Spix & Agassiz, 1829) 25 piscivorous 59.40 62.37 2368.59 0.22b 2.48 0.50 7.19
Plagioscion squamosissimus (Heckel, 1840) 294 piscivorous 46.90 49.24 1768.44 0.47b 1.43 0.90 6.22
Rhamdia branneri Hanseman, 1911 19 piscivorous 36.50 49.77* 1822.22 0.24 1.17 0.53 5.88
Rhamdia quelen (Quoy & Gaimard, 1824) 125 piscivorous 39.40 39.17* 7746.39 0.01 1.01 0.35 4.25 Rhaphiodon vulpinus Spix & Agassiz, 1829 3 piscivorous 44.00 46.20 508.19 0.39b 1.76 0.70 8.55 Salminus brasiliensis (Cuvier, 1816) 7 piscivorous 52.00 54.60 2077.30 0.20b 1.43 0.40 6.02
Serrasalmus maculatus Kner, 1858 69 piscivorous 22.00 23.10 325.81 0.45b 2.35 1.50 10.48
Serrasalmus marginatus Valenciennes, 1837 11 piscivorous 23.70 24.90 294.22 0.60b 3.33 1.30 12.90
Steindachneridion scriptum (Miranda-Ribeiro, 1918) 3 piscivorous 38.00 51.50* 1847.27 0.25a 0.70 0.54 5.36
Steindachneridion melanodermatum Garavello, 2005 1 piscivorous 49.00 43.60* 1613.64 0.25a 0.70 0.57 6.19
Tatia neivai (Ihering, 1930) 20 piscivorous 9.50 10.00 11.78 0.60 0.55 1.51 14.63
Tatia jaracatia Pavanelli & Bifi, 2009 5 piscivorous 6.60 6.90 6.00 0.50a 0.80 1.49 17.60
resistance to diseases and infection (Coward & Bromage, 2000). These biological features might have favored the rapid growth of O. niloticus populations in the reservoirs studied.
Fig. 2. Relationships between von Bertalanffy’s constant (k; Growth rate) and maximum length (Lmax; a), asymptotic length
(Loo; b), asymptotic weight (Woo; c), caudal fin index (Ar; d), natural mortality (M; e) and consumption/biomass ratio (Q/B; f) for
Fig. 3. Relationships between some biological parameters of 135 fish species in the State of Paraná, southern Brazil, caught in
July and November 2001. Asymptotic length (Loo) and consumption/biomass ratio (Q/B; a); maximum length (Lmax) and asymptotic
weight (Woo; b); maximum length (Lmax) and natural mortality (M; c); and caudal fin index (Ar) and natural mortality (M; d).
The knifefishes species, as G. sylvius, E. trilineata,and Rhamphichthys hahni, showed the body shape highly
specialized. The caudal portion of the body is elongate and it has a long anal fin, there are no dorsal, adipose, or pelvic fins, while the caudal fin is either small or absent (Albert, 2001). Thus, the caudal fin index for these species does not follow the specified pattern for other species. In addition, these species can present large maximum length, with such a high natural mortality, because on the shape of the body.
Consumption/Biomass ratio is defined as the number of times a population consumes its own weight within a year (Pauly, 1986, 1998a, 1998b; García & Duarte, 2002). García & Duarte (2002) studied Q/B ratio and estimates of Q/B-predictor parameters for Caribbean fish, and Angelini & Agostinho (2005a) studied parameter estimates for fish from the upper Paraná River Floodplain and from Itaipu Reservoir (Brazil), and they found that Q/B varies inversely with Loo and trophic levels (species from low trophic levels showed high Q/B ratio,
due to their fast life cycles). Small-sized species, which are normally r-strategists (sensu Winemiller, 1989), showed low
asymptotic lengths, short life cycles, high growth rates, early first maturation, high natural mortality, and high fecundity (Vazzoler, 1996). These species usually form the base of food webs, as they are concentrated in the lower trophic levels. Thus, patterns found in this study are similar to those observed previously.
The estimates presented here should be useful for building Ecopath models. Ecological modeling is under development in tropical regions, such as Brazil (Angelini & Petrere, 1996; Wolff et al., 2000; Angelini & Agostinho, 2005a,
2005b; Angelini et al., 2006; Angelini & Gomes, 2008). Pauly
(1998b) pointed out to the need for an adaptation or more precisely a “tropicalization” of the parameters from Beverton and Holt models. Moreover, García & Duarte (2002) suggested that it would be interesting to explore the consistency of published consumption/biomass ratio values for the same species in similar habitats. Those authors compared estimated Q/B values with three empirical models described by Palomares & Pauly (1989, 1998) and by Pauly et al., (1990),
and they concluded that parameters vary for a given fish species; this is a clear sign that empirical models must be used with caution. Thus, empirical models obtained with data from temperate areas should be analyzed with attention. Furthermore, we emphasize that empirical models described by Palomares & Pauly (1989, 1998) and by Pauly et al., (1990)
should be parameterized with data from tropical areas.
Acknowledgements
We thank the Nupélia/UEM, PRONEX (Programa Nacional de Excelência) and Conselho Nacional de Desenvolvimento Científico e Tecnológico (CNPq) for the financial support and the grant for EAG. AAA and LCG are also granted by CNPq (Bolsa Produtividade). We also thank to Weferson Júnio da Graça by the review of list of species.
Literature Cited
Abelha, M. C. F. & E. Goulart. 2004. Oportunismo trófico de
Geophagus brasiliensis (Quoy & Gaimard, 1824) (Osteichthyes,
Cichlidae) no reservatório de Capivari, Estado do Paraná, Brasil. Acta Scientiarum. Biological Sciences, 26: 37-45.
Abelha, M. C. F., E. Goulart, E. A. L. Kashiwaqui & M. R. Silva. 2006. Astyanax paranae Eigenmann, 1914 (Characiformes:
Characidae) in the Alagados Reservoir, Paraná, Brazil: diet composition and variation.Neotropical Ichthyology, 4: 349-356. Abelha, M. C. F., E. Goulart & D. Peretti. 2005. Estrutura trófica e variação sazonal do espectro alimentar da assembléia de peixes do reservatório de Capivari, Paraná, Brasil. Pp. 197-209. In: Rodrigues, L., S. M. Thomaz, A. A. Agostinho & L. C. Gomes (Eds.). Biocenoses em reservatórios: padrões espaciais e tem-porais. São Carlos, RiMa, 321p.
Abujanra, F., M. R. Russo & N. S. Hahn. 1999. Variações espaço-temporais na alimentação de Pimelodus ortmanni (Siluriformes,
Pimelodidae) no reservatório de segredo e áreas adjacentes (PR). Revista UNIMAR, 21: 283-289.
Agostinho, A. A., N. S. Hahn, L. C. Gomes & L. M. Bini. 1997. Estrutura trófica. Pp. 229-248. In: Vazzoler, A. E. A. M., A. A. Agostinho & N. S. Hahn (Eds.). A planície de inundação do alto rio Paraná: aspectos físicos, biológicos e socioeconômicos. Maringá, EDUEM, 460p.
Agostinho, A. A., L. C. Gomes & F. M. Pelicice. 2007. Ecologia e manejo de recursos pesqueiros em reservatórios do Brasil. Maringá, Eduem, 507p.
Albert, J. S. 2001. Species diversity and phylogenetic systematic of American knifefishes (Gymnotiformes, Teleostei). Ann Arbor, Miscellaneous Publications, Museum of Zoology, University of Michigan, 126p.
Allen, K. R. 1971. Relation between production and biomass. Journal of the Fisheries Research Board of Canada,28: 1573-1581. Almeida, V. L. L., N. S. Hahn & A. E. A. M. Vazzoler. 1997. Feeding
patterns in five predatory fishes of the high Paraná River floodplain (Brazil). Ecology of Freshwater Fish, 6: 123-133. Andrian, I. F. & G. Barbieri. 1996. Espectro alimentar e variações
sazonal e espacial na composição da dieta de Parauchenipterus galeatus Linnaeus, 1766, (Siluriformes, Auchenipteridae) na
região do Reservatório de Itaipu (PR). Revista Brasileira de Biologia, 56: 409-422.
Andrian, I. F., C. C. R. C. Doria, G. Torrente & C. M. L. Ferreti. 1994. Espectro alimentar e similaridade na composição da dieta de 4 espécies de Leporinus (Characiformes, Anostomidae) do
rio Paraná, Brasil. Revista UNIMAR,16: 97-106.
Angelini, R. & A. A. Agostinho. 2005a. Parameter estimates for fishes of the Upper Paraná River Floodplain and Itaipu Reservoir (Brazil). NAGA, 28: 53-57.
Angelini, R. & A. A. Agostinho. 2005b. Food web model of the Upper Paraná River Floodplain: description and aggregation effects. Ecological Modelling, 181:109-121.
Angelini, R. & M. Petrere Junior. 1996. The ecosystem of Broa Reservoir, São Paulo State, Brazil, as described using ECOPATH. NAGA, 19: 36-41.
Angelini, R. & L. C. Gomes. 2008.O artesão dos ecossistemas: construindo modelos com dados. Maringá, EDUEM, 173p. Angelini, R., A. A. Agostinho & L. C. Gomes. 2006. Modeling
energy flow in a large neotropical reservoir: a tool to evaluate fishing and stability. Neotropical Ichthyology, 4: 253-260. Bennemann, S. T., A. M. Gealh, M. L. Orsi & L. M. Souza. 2005.
Ocorrência e ecologia trófica de quatro espécies de Astyanax
(Characidae) em diferentes rios da bacia do rio Tibagi, Paraná, Brasil. Iheringia. Série Zoologia, 95: 247-254.
Bennemann, S. T., L. G. Capra, W. Galves & O. A. Shibatta. 2006. Dinâmica trófica de Plagioscion squamosissimus
(Perciformes, Sciaenidae) em trechos de influência da repre-sa Capivara (rios Paranapanema e Tibagi). Iheringia. Série Zoologia, 96: 115-119.
Beverton, R. 1998. Fish, fact and fantasy: a long view. Reviews in Fish Biology and Fisheries, 8: 229-249.
Beverton, R. J. H. & S. J. Holt. 1959. A review of the lifespans and mortality rates of fish in nature, and their relation to growth and other physiological characteristics. Pp. 142-180. In: Wohstenholme, G. E. & M. O’Conner (Eds.). The lifespan of animals. Volume V, London, Churcill, 344p.
Binohlan, C. & D. Pauly. 2000. The Popgrowth table. Pp. 138-145. In: Froese, R. & D. Pauly (Eds.). Fishbase 2000: concepts, design and data sources. Los Baños, Laguna, Iclarm, 240p. Cantanhêde, G., N. S. Hahn, E. A. Gubiani & R. Fugi. 2008. Invasive
molluscs in the diet of Pterodoras granulosus (Valenciennes,
1821) (Pisces, Doradidae) in the Upper Paraná River floodplain, Brazil. Ecology of Freshwater Fish, 17: 47-53.
Cassemiro, F. A. S., N. S. Hahn & R. Fugi. 2002. Avaliação da dieta de Astyanax altiparanae Garutti & Britski, 2000 (Osteichthyes,
Tetragonopterinae) antes e após a formação do reservatório de Salto Caxias, Estado do Paraná, Brasil. Acta Scientiarum. Biological Sciences, 24: 419-425.
bonariensis, of the Salto Caxias reservoir, rio Iguaçu, Paraná, Brazil. Neotropical Ichthyology, 1: 127-131.
Cassemiro, F. A. S., N. S. Hahn & R. L. Delariva. 2005. Estrutura trófica da ictiofauna, ao longo do gradiente longitudinal do reservatório de Salto Caxias (rio Iguaçu, Paraná, Brasil), no terceiro ano após o represamento. Acta Scientiarum. Biological Sciences, 27: 63-71.
Christensen, V. & D. Pauly. 1993. Trophic models of aquatic ecosystems. International Center for Living Aquatic Resources Management, International Council for the Exploration of the Sea, Danish International Development Agency, Makati, Metro Manila, Philippines, Copenhagen K., Denmark, 390p. Comitê Brasileiro de Barragens. 2007: Available at: http://
www.cbdb.org.br/site/listabarragens.asp (last accessed on 14 March 2007).
Companhia Paranaense de Energia Elétrica. 2007: Available at: http:/ /www.copel.com/pagcopel.nsf/secaos/ger_usinas (last accessed on 14 March 2007).
Coward, K. & N. R. Bromage. 2000. Reproductive physiology of female tilapia broodstock. Reviews in Fish Biology and Fisheries, 10: 1-25.
Dias, R. M., D. Bailly, R. R. Antônio, H. I. Suzuki & A. A. Agostinho. 2005. Colonization of the Corumbá Reservoir (Corumbá River, Paraná River Basin, Goiás State, Brazil) by the “lambari” Astyanax altiparanae (Tetragonopterinae;
Characidae). Brazilian Archives of Biology and Technology, 48: 467-476.
Ferreti, C. M. L., I. F. Andrian & G. Torrente. 1996. Dieta de duas espécies de Schizodon (Characiformes, Anostomidae), na
pla-nície de inundação do alto rio Paraná e sua relação com aspectos morfológicos. Boletim do Instituto de Pesca,23: 171-186. Froese, R. & C. Binohlan. 2000. Empirical relationships to estimate
asymptotic length, length at first maturity, and length at maximum yield per recruit in fishes, with a simple method to evaluate length frequency data. Journal of Fish Biology, 56: 758-773. Froese, R. & C. Binohlan. 2003. Simple methods to obtain
preliminary growth estimates for fishes. Journal of Applied Ichthyology,19: 376-379.
Froese, R. & D. Pauly. 2000. Fishbase 2000: Concepts, design and data sources. ICLARM, Los Baños, Laguna, Philippines, 344p. Froese, R. & D. Pauly. 2010. FishBase. World Wide Web electronic
publication. www.fishbase.org, version (05/2010).
Fugi, R. & N. S. Hahn. 1991. Espectro alimentar e relações morfológicas com o aparelho digestivo de 3 espécies de pei-xes comedoras de fundo do Rio Paraná. Revista Brasileira de Biologia,51: 873-879.
Fugi, R., A. A. Agostinho & N. S. Hahn. 2001. Trophic morphology of five benthic-feeding fish species of a tropical floodplain. Revista Brasileira de Biologia, 61: 27-33.
Fugi, R., N. S. Hahn, V. Loureiro-Crippa & G. C. Novakowski. 2005. Estrutura trófica da ictiofauna em reservatórios. Pp. 185-195. In: Rodrigues, L., S. M. Thomaz, A. A. Agostinho & L. C. Gomes (Eds.). Biocenoses em reservatórios: padrões espaciais e temporais. São Carlos, RiMa, 321p.
García, C. B. & L. O. Duarte. 2002. Consumption to biomass (Q/B) ratio and estimates of Q/B-predictor parameters for Caribbean fishes. NAGA, 25: 19-31.
Gayanilo, F. C. Jr. & D. Pauly. 1997. FAO-ICLARM stock assessment tools (FiSAT) - Reference manual. FAO Computerized Information Series (Fisheries). No. 8. FAO, Rome, 262p. Gealh, A. M. & N. S. Hahn. 1998. Alimentação de Oligosarcus
longirostris Menezes & Gèry (Osteichthyes,
Acestrorhynchinae) do reservatório de Salto Segredo, Paraná, Brasil. Revista Brasileira de Zoologia, 15: 985-993.
Graça, W. J. & C. S. Pavanelli. 2007. Peixes da planície de inundação do alto rio Paraná e áreas adjacentes. Maringá, EDUEM, 241p. Gulland, J. A. 1977. Fish population dynamics. New York, John
Wiley & Sons, 372p.
Hahn, N. S., R. Fugi & I. F. Andrian. 1991. Espectro e atividade alimentares do armadinho, Trachydoras paraguayensis
(Doradidae; Siluriformes) em distintos ambientes do Rio Paraná. Revista UNIMAR, 13: 177-194.
Hahn, N. S., A. Monfredinho, R. Fugi & A. A. Agostinho. 1992. Aspectos da alimentação do armado, Pterodoras granulosus
(Ostariophysi, Doradidae) em distintos ambientes do alto rio Paraná. Revista UNIMAR, 14: 163-176.
Hahn, N. S., R. Fugi, V. L. L. Almeida, M. R. Russo & V. E. Loureiro. 1997a. Dieta e atividade alimentar de peixes do reservatório de Segredo. Pp. 143-162. In: Agostinho, A. A. & L. C. Gomes (Eds.). Reservatório de Segredo: bases ecológicas para o manejo. Maringá, EDUEM, 387p.
Hahn, N. S., I. F. Andrian, R. Fugi & V. L. L. Almeida. 1997b. Ecologia trófica. Pp. 209-228. In: Vazzoler, A. E. A. M., A. A. Agostinho & N. S. Hahn (Eds.). A planície de inundação do alto rio Paraná: aspectos físicos, biológicos e socioeconômicos. Maringá, EDUEM, 460p.
Hahn, N. S., A. A. Agostinho, L. C. Gomes & L. M. Bini. 1998. Estrutura trófica da ictiofauna do reservatório de Itaipu (PR -Brasil) nos primeiros anos de sua formação. Interciencia, 23: 299-305.
Hahn, N. S., V. E. Loureiro & R. L. Delariva. 1999. Atividade alimentar da curvina Plagioscion squamosissimus (Heckel,
1840) (Perciformes, Sciaenidae) no rio Paraná. Acta Scientiarum. Biological Sciences, 21: 309-314.
Holt, S. J. 1998. Fifty years on. Reviews in Fish Biology and Fisheries, 8: 357-366.
Ingenito, L. F. S., L. F. Duboc & V. Abilhoa. 2004. Contribuição ao conhecimento da ictiofauna da bacia do alto rio Iguaçu, Paraná, Brasil. Arquivos de Ciências Veterinárias e Zoologia da UNIPAR, 7: 23-36.
Ivlev, V. S. 1945. The biological productivity of waters. Translated by Ricker, W. E. 1966. Journal of the Fisheries Research Board of Canada, 23:1727-1759.
Jarre, A., M. L. Palomares, M. L. Soriano, V. C. Sambilay & D. Pauly. 1991. Some new analytical and comparative methods for estimating the food consumption of fish. International Council for the Exploration of the Sea Marine Science Symposium, 193: 99-108.
Jensen, A. L. 1997. Origin of the relation between K and Linf and synthesis of relations among life history parameters. Canadian Journal of Fisheries and Aquatic Sciences,54: 987-989. Júlio Jr, H. F., S. M. Thomaz, A. A. Agostinho & J. D. Latini. 2005.
Distribuição e caracterização dos reservatórios. Pp. 1-16. In: Rodrigues, L., S. M. Thomaz, A. A. Agostinho & L. C. Gomes (Eds.). Biocenoses em reservatórios: padrões espaciais e tem-porais. São Carlos, RiMa, 321p.
Lolis, A. A. & I. F. Andrian. 1996. Alimentação de Pimelodus maculatus Lacépede, 1803 (Siluriformes, Pimelodidae) na planí-cie de inundação do alto rio Paraná, Brasil. Boletim do Instituto de Pesca, 23: 187-202.
Loureiro, V. E. & N. S. Hahn. 1996. Dieta e atividade alimentar da traíra Hoplias malabaricus (Block, 1794) (Osteichthyes,
Loureiro-Crippa, V. E. & N. S. Hahn. 2006. Use of food resources by the fish fauna of a small reservoir (rio Jordão, Brazil) before and shortly after its filling. Neotropical Ichthyology, 4: 357-362. Menezes, N. A., S. H. Weitzman, O. T. Oyakawa, F. C. T. Lima,
R. M. C. Castro & M. J. Weitzman. 2007. Peixes de água doce da Mata Atlântica: lista preliminar das espécies e comentários sobre conservação de peixes de água doce neotropicais. São Paulo, Museu de Zoologia, Universidade de São Paulo, 407p. Nelson, J. S. 2006. Fishes of the World. New York , John Wiley &
Sons, 601p.
Nikolsky, G. V. 1969. Theory of fish population dynamics. Edinburgh, Oliver & Boyd, 323p.
Oricolli, M. C. G. & S. T. Bennemann. 2006. Dieta de
Bryconamericus iheringii (Ostariophysi:Characidae) em riachos
da bacia do rio Tibagi. Acta Scientiarum. Biological Sciences, 28: 59-63.
Ortêncio Filho, H., N. S. Hahn, R. Fugi & M. R. Russo. 2001. Aspectos da alimentação de Glanidium ribeiroi (Haseman, 1911) (Teleostei, Auchenipteridae), espécie endêmica do rio Iguaçu, PR. Acta Limnologica Brasiliensia, 13: 85-92.
Oyakawa, O. T., A. Akama, K. C. Mautari & J. C. Nolasco. 2006. Peixes de riachos da mata Atlântica nas unidades de conservação do vale do rio Ribeira de Iguape no Estado de São Paulo. São Paulo, Neotrópica, 201p.
Palomares, M. L. D. & D. Pauly. 1989. A multiple regression model for predicting the food consumption of marine fish populations. Australian Journal of Marine & Freshwater Research,40: 259-273.
Palomares, M. L. D. & D. Pauly. 1998. Predicting food consumption of fish populations as functions of mortality, food type, morphometrics, temperature and salinity. Marine and Freshwater Research, 49: 447-453.
Pauly, D. 1980. On the interrelationships between natural mortality, growth parameters and mean environmental temperature in 175 fish stocks. Journal du Conseil International pour I’Exploration de la Mer,39: 175-192.
Pauly, D. 1986. A Simple Method for Estimating the food consumption of fish populations from growth data and food conversion experiments. Fishery Bulletin (U.S.), 84: 827-840. Pauly, D. 1989. Food consumption by tropical and temperate fish populations: some generalizations. Journal of Fish Biology, 35: 11-20.
Pauly, D. 1998a. Tropical fishes: patterns and propensities. Journal of Fish Biology, 53: 1-17.
Pauly, D. 1998b. Beyond our original horizons: the tropicalization of Beverton and Holt. Reviews in Fish Biology and Fisheries, 8:307-334.
Pauly, D., V. Christensen & V. C. Sambilay. 1990. Some features of fish food consumption estimates used by ecosystem modelers. London, ICES Council Meeting, 9p.
Pauly, D., V. Christensen & C. Walters. 2000. Ecopath, Ecosim, and Ecospace as tools for evaluating ecosystem impact of fisheries. ICES Journal of Marine Science, 57: 697-706.
Perez Lizama, M. de Los A. & A. E. A. M. Vazzoler. 1993. Cresci-mento em peixes do Brasil: uma síntese comentada. Revista UNIMAR, 15(Suplemento): 141-173.
Ricker, W. E. 1975. Computation and interpretation of biological statistics of fish populations. Bulletin of the Fisheries Research Board of Canada, 191: 1-382.
Russo, M. R., N. S. Hahn & C. S. Pavanelli. 2004. Resource partitioning between two species of Bryconamericus Eigenmann,
1907 from the Iguaçu river basin, Brazil. Acta Scientiarum. Biological Sciences, 26: 431-436.
Severi, W. & A. A. M. Cordeiro. 1994. Catálogo de peixes da bacia do rio Iguaçu. Curitiba, IAP/GTZ, 128p.
Silva, E. B., P. H. S. Picapedra, P. V. Sanches. R. E. O. Rezende, A. M. Gavião, M. M. Mendonça, E. D. V. Gonçalves & R. B. Conte. 2011. Larvae occurrences of Rhamdia quelen (Quoy & Gaimard, 1824) (Siluriformes: Heptapteridae) in an area under dam influence in the upper Paraná River region, Brazil. Neotropical Ichthyology, 9: 419-426.
Souza-Stevaux, M. C., R. R. B. Negrelle & V. Citadini-Zanette. 1994. Seed dispersal by the fish Pterodoras granulosus in the Paraná River Basin, Brazil. Journal of Tropical Ecology, 10: 621-626.
Sparre, P., E. Ursin & S. C. Venema. 1989. Introduction to tropical fish stock assessment. Part 1. Manual. Fisheries technical paper, Rome, FAO, 337p.
Stergiou, K. I. & P. K. Karachle. 2006. A review of various biological parameters for fish from the Greek Seas. Journal of Biological Research,6: 199-211.
Stergiou, K. I. & V. S. Karpouzi. 2002. Feeding habitats and trophic levels of Mediterranean fishes. Reviews in Fish Biology and Fisheris,11: 217-254.
Thornton, K. W., B. L. Kimmel & F. E. Payne. 1990. Reservoir limnology: ecological perspectives. New York, John Wiley & Sons, 246p.
Vazzoler, A. E. A. M. 1996. Biologia da reprodução de peixes teleósteos: Teoria e prática. Maringá, EDUEM, 169p. Winemiller, K. O. 1989. Patterns of variation in life history among
South American fishes in seasonal environments. Oecologia, 81: 225-241.
Wolff, M., V. Koch & V. Isaac. 2000. A trophic model of Caeté Mangrove Estuary (North Brazil) with considerations for the sustainable use of its resources. Estuarine, Coastal and Shelf Science, 50: 789-803.