NITROGEN CONSUMPTION DURING BATCH CULTIVATION OF NEISSERIA MENINGITIDIS
(SEROGROUP C) IN FRANTZ MEDIUM
Júlia Baruque-Ramos*; Haroldo Hiss; Márcio Alberto Vicentin; Marcelo Fossa da Paz; Argélia Peixoto; Maria Betania Batista Leal; Rony Akio Sato; Umbelina MacedoVassoler; Isaías Raw
Instituto Butantan (Centro de Biotecnologia). São Paulo, SP, Brasil
Submitted: November 24, 1999; Returned to authors for corrections: August 21, 2000; Approved: November 21, 2001
ABSTRACT
Capsular polysaccharide, extracted from microorganism cultivations, is the principal antigen for elaboration of vaccine against the disease caused by Neisseria meningitidis serogroup C. The final protein content allowed in this vaccine is 1%. In order to find a relationship between nitrogen consumption and cell growth, including polysaccharide production, and cell nitrogen content, cultivations were carried out in an 80 liters bioreactor (total capacity), under the following conditions: Frantz medium; temperature of 35ºC; air flow of 5 L/min (0.125 vvm); agitation frequency of 120 rpm and vessel pressure of 6 psi (kLa = 0.07 min-1). Concentrations
of biomass, total polysaccharide, cellular nitrogen, residual organic and inorganic nitrogen in the medium were measured during cultivation. From five cultivations carried out under the same conditions, a mean cell nitrogen percentage of 12.6% (w/w) in respect to the dry biomass was found. The inorganic nitrogen in the medium did not change significantly along the cultivation time, whereas the organic nitrogen consumption was linearly related to cell growth, with constant yield factors (average of 8.44). Polysaccharide production kinetics followed the cell growth kinetics until the beginning of the stationary growth phase. A supplemental polysaccharide production was observed until the end of cultivation, but without cell nitrogen absorption. Thus, the results indicate that polysaccharide is produced in two phases, being the first one biomass formation followed by non-associated to growth.
Key words: N. meningitidis, vaccine, polysaccharide, nitrogen.
INTRODUCTION
Meningococcal disease is a major cause of death and morbidity throughout the world. Neisseria meningitidis is responsible for one third of all bacterial meningitis cases in the planet. The disease is serious and if not treated, mortality reaches 100% (16).
Since 20th century beginning, tries had been done to decrease
meningitis disease with the use of vaccines made from whole dead cells, but they were unsuccessful (16). In this way, isolated bacterium structures are studied for vaccine development, in which surface structures and bacterium extracell products are the most relevant (5).
Meningococci have a typical Gram-negative cell wall with a citoplasmatic membrane, a glycopeptidic coat and an external membrane. The capsules are constituted by polysaccharide, which is the base for serogroup classification of meningococcus. The protein constitution of the external membrane determinates the serotype (21). Besides capsular polysaccharides (PS) and membrane external proteins, the main antigens for vaccine elaboration are pili (2), lipopolysaccharide (LPS) (8) and IgA protease (15).
Capsular polysaccharide, removed from whole cells (5), is the principal antigen for elaboration of vaccine against disease caused by N. meningitidis serogroup C. In order to extract this antigen, a cell rupture needs to be made (6), since the
polysaccharide is adhered to the bacterium. However, this procedure also causes protein liberation. The final protein content allowed in the vaccine against meningitis serogroup C is only 1% (1).
In order to facilitate the posterior purification and decrease the antigen loss, it’s interesting to drive the production process in a way to get high cell density but the smallest protein amount in relation to the polysaccharide quantity. Furthermore, bacterial proteins and nucleic acids are directly related to the structural nitrogen. Thus, informations about nutritional requirements of N. meningitidis including nitrogen consumption are necessary. Although no information is available about nitrogen requirements of N. meningitidis serogroup C, Merck Laboratories researchers had published a paper on medium optimization and nutrients consumption kinetics by N. meningitidis serogroup B (4). However, the relationship between polysaccharide, cell biomass and bacterial nitrogen was not included in the paper.
Therefore, a study of kinetics of nitrogen consumption in batch cultivation of N. meningitidis serogroup C is useful to obtain the relationship between nitrogen requirements, biomass and polysaccharide production. In order to facilitate the purification, a process that provides high polysaccharide formation with the lowest relationship between this product and cellular nitrogen amount needs to be developed. In this study, N. meningitidis serogroup C was batch cultivated in Frantz medium (3), traditionally used for cultivation of this microorganism (1, 2, 3, 4, 6, 11, 12, 17, 19). The following correlations were determinated: global yield coefficients (YX/G,
YX/ON, YP/X); organic and inorganic nitrogen consumption;
cellular nitrogen amounts and the rate between these values and polysaccharide production.
MATERIALS AND METHODS
Cultivation of the microorganism
The inocolum was prepared according to Gotschlich et al. (6). The contents of two ampoules, each one containing the meningococcal strain IMC 2135 (supplied by Instituto Adolpho Lutz, SP, Brazil), maintained in 0.5 mL of Greaves medium (7) at -70ºC, having a mean value of 6.0x10⁶ CFU/mL, were streaked
out onto four Müller-Hinton agar slant tubes (13). The tubes were incubated at 35ºC during 12 h in a candle jar (5-10% CO2). The microorganisms from each slant tube were ressuspended in Frantz medium (3) and transferred to 250 mL conical flasks, containing 50 mL of Frantz medium. The flasks were incubated at 35ºC for 5 h in a rotary shaker at 120 rpm. This culture was transferred to a 2 L conical flask, containing 400 mL of the same medium, and cultivated under the conditions previously described. Possible contaminations of cultures were monitored by Gram staining. The contents of two of these conical flasks were used as inoculum for the bioreactor (New Brunswick model
MPP 80 - total capacity 80 L) with 40 L of Frantz medium. The medium for the inocula and for the bioreactor was sterilized by filtration through a Millipore filter with 0.2 µm pore size.
The Frantz medium contains per liter: L-glutamic acid, 1.60 g; NaCl, 6.00 g; Na2HPO4.7H2O, 4.67 g; NH4Cl, 1,25 g; KCl, 0,09
g; L-cystein.HCl.H2O, 0.02 g; dialyzed yeast extract, 2.00 g;
MgSO4.7H2O, 1.23 g; Glucose, 5.00 g. The pH was corrected to
7.4 with NaOH 5N.
The cultivation conditions were temperature: 35.0ºC; air flow rate: 5 L/min (0.125 vvm, superficial aeration); agitation frequency: 120 rpm (with 2 Rushton six blade disc turbines); vessel head space pressure: 6 psi (0.41 kg.cm-2); height and diameter of the vessel: 72 and 40 cm, respectively; turbine diameter: 16.5 cm, one located at 10 cm from the vessel bottom and the other at 35 cm. Four baffles were installed, in order to enhance the mixture efficiency. The oxygen volumetric transfer coefficient (kLa) was near 0.07 min-1 before the inoculation (t=0
h) (14).
Analytical methods Cell Concentration
Expressed as dry biomass, determined by sample centrifugation at 10,000 g and sediment drying at 60ºC during 48 hours;
Glucose Concentration
Glucoseoxidase method (colorimetric) (18);
Polysaccharide Concentration
According to Gotschlich et al. (6), the cells were disrupted and precipitated by the addition of Cetavlon (Merck Laboratories) into the sample. After a preliminary centrifugation, the precipitated biomass was ressuspended in 1 M CaCl2.2H2O solution. The sample was centrifuged again and the supernatant collected for the polysaccharide determination by the Resorcinol-HCl colorimetric method (6). This method is sensitive to the polysaccharide monomers (sialic acids) formed after the acid hydrolysis of the sample (20);
Supernatant and Cellular Nitrogen Concentration
nitrogen in the supernatant was calculated deducting the inorganic nitrogen from the total nitrogen amount. The volume of HCl expended was employed to calculate the nitrogen amounts in the supernatant and in the dry biomass using the following expressions:
For supernatant sample, total or inorganic nitrogen:
Nit.(g/L) = 1.40148*10*
7V*N
Al
For dry biomass sample:
Nit.(g/g) = 1.40148*10*
4V*N
A2
where,
V = HCl volume (mL); N = HCl normality; A1 = sample volume (mL); A2 = dry mass sample (g);
pH - Measured by an in-line probe (Ingold model 465-90);
Percentage of Dissolved Oxygen
Determined by an in-line polarografic probe (Ingold model 531). The saturation point (100%) was calibrated one hour before the inoculation, under the same cultivation conditions (Frantz medium, 35ºC, 120 rpm, 5 L/min, superficial aeration and 6 psi vessel over pressure).
Yield coefficient
Performed calculating of the ratios between cell biomass generated and glucose consumption (YX/G), cell biomass
generated and organic nitrogen consumption (YX/ON) and
between polysaccharide production and cell biomass generated (YP/X) at a given cultivation time.
RESULTS AND DISCUSSION
The kinetic curves are shown in Figs. 1 and 2.
In a previous work (17), linear growth, observed between 3 and 8 hours, related to oxygen limitation (Fig. 2-c) and associated and non-growth associated polysaccharide cell production (Figs. 1-a and 1-b), were already reported.
During cultivation, glucose concentration dropped from the initial value of 5 g/L to near 1.5 g/L (Fig. 1-a). Existence of residual glucose at the end of cultivation indicated that there was no limitation of this substrate during the experiments. Under such condition, the mean yield in five cultivations (YX/G) was 0.3
during the growth phase (Table 1). After the start of the stationary growth phase, a small decrease in glucose concentration in relation to the cell population and a supplemental polysaccharide formation were observed (Figs. 1-a and 1-b).
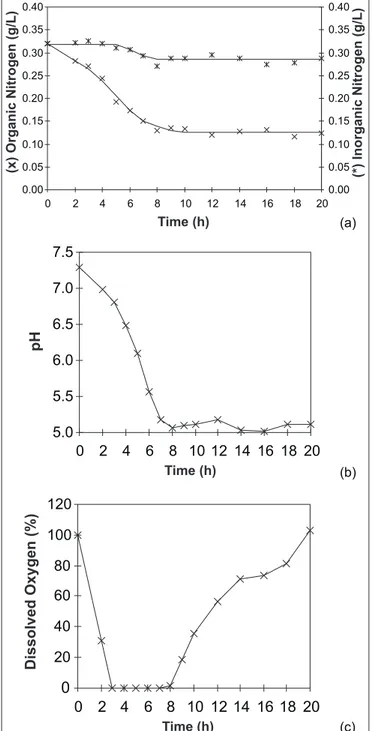
During cultivation, the pH was not under control, which agrees with Aymé et al. (1). According Fu et al (4) the pH drop observed during the cultivation time (Fig. 2-b) was due to acetic acid formation under oxygen limitation (Fig. 2-c). These researchers reported that during N. meningitidis serogroup B cultivation, acetic acid was the main sub-product of glucose metabolism. Based on another work with N. gonorrhoeae (12), Fu et al. suggested that the principal glucose metabolic pathway was the Entner-Doudoroff cycle, which corresponds to approximately 80% of the metabolism. In this cycle, pyruvate is stoichiometrically oxidized to acetate, since the TCA pathway is only partially functional in pathogenic Neisseria species during glucose metabolism. The Pentose-Phosphate pathway corresponds to approximately 20% of the metabolism. The activity of Embden-Meyerhof-Parnas pathway has not been observed by these researchers (4).
The organic nitrogen consumption was linearly related to cell growth with constant yield factors (Fig. 3 and Table 1). No nitrogen absorption was observed during the stationary growth phase (Figs. 1-a and 2-a).
Time (h) 0.0
0.2 0.4 0.6 0.8 1.0 1.2 1.4
0 2 4 6 8 10 12 14 16 18 20
0.0 1.0 2.0 3.0 4.0 5.0 6.0
(x)
Dry
Biomass
(g/L)
(*)
Glucose
(g/L)
0.00 0.02 0.04 0.06 0.08 0.10 0.12 0.14 0.16 0.18
0 2 4 6 8 10 12 14 16 18 20
0.00 0.02 0.04 0.06 0.08 0.10 0.12 0.14 0.16 0.18
Time (h)
(x)
Polysaccharide
(g/L)
(*)
Cellular
Nitrogen
(g/L)
(a)
(b)
Considering only samples presenting more than 0.5 g of dry biomass per liter of medium, the mean cell nitrogen percentage was 12.6 %, with a coefficient of variance of 3.1% (Table 3). This value is similar to previous data reported for N. meningitidis (19). Polysaccharide production followed the cell growth pattern until the stationary growth phase was reached (Figs. a and 1-b). The mean yield factor (YP/X) was 0.070 (Table 1). At this
point, a supplemental polysaccharide production was observed until the end of cultivation (17), with a mean yield factor (YP/X)
Figure 2. (a): Organic and inorganic nitrogen; (b): pH; (c):dissolved oxygen.
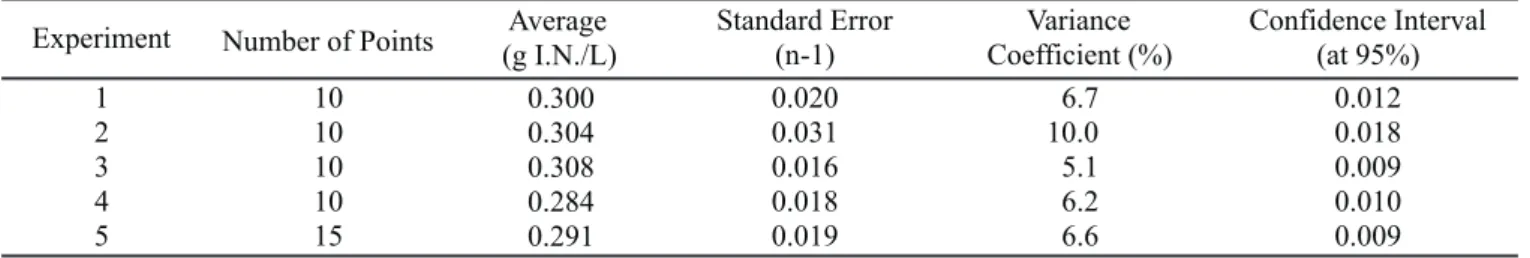
The amount of inorganic nitrogen of the medium presented a small decrease (maximum of 10% relation to initial concentrations) along the cultivation time (Fig. 2-a and Table 2). This small decrease could be explained by the dragging of the compound by with the outgoing air or by the equilibrium between ammonia formation and bacterial absorption.
0.0 0.2 0.4 0.6 0.8 1.0 1.2 1.4
0.00 0.05 0.10 0.15 0.20 0.25 0.30 0.35 Organic Nitrogen (g/L)
Dry
Biomass
(g/L)
0.00 0.02 0.04 0.06 0.08 0.10 0.12 0.14 0.16 0.18
1 2 3 4 5
Polysaccharide-12 h End Cultivation Polysaccharide End Cultivation Cell Nitrogen Experiment
Polysaccharide
Cell
Nitrogen
(g/L)
Figure 3. Relationship between cell growth and organic nitrogen consumption. Straight line equation: X= -7,24.O.N. + 1,82 with r2= 0,9688.
Figure 4. Polysaccharide amounts at the 12th cultivation hour
(stationary growth phase start) and at the 20th culture hour (end
of cultivation) and the cellular nitrogen amounts (end of cultivation) - results of five experiments.
0.00 0.05 0.10 0.15 0.20 0.25 0.30 0.35 0.40
0 2 4 6 8 10 12 14 16 18 20
0.00 0.05 0.10 0.15 0.20 0.25 0.30 0.35 0.40
Time (h)
(x)
Organic
Nitrogen
(g/L)
(*)
Inorganic
Nitrogen
(g/L)
5.0 5.5 6.0 6.5 7.0 7.5
0 2 4 6 8 10 12 14 16 18 20
Time (h)
pH
0 20 40 60 80 100 120
0 2 4 6 8 10 12 14 16 18 20
Time (h)
Dissolved
Oxygen
(%)
(b)
of 0.122 (Table 1), without nitrogen cell absorption (Figs. a, 1-b, 2-a and Table 1). Based on the empirical relation of 6.25 g of protein per g of cellular nitrogen, a comparison between polysaccharide and cell nitrogen contents for the five experiments (Fig. 4) indicated that at the beginning of the stationary growth phase (t=12 h), there was a relation of nearly 15 g of protein per g of polysaccharide, whereas at the end of the cultivation (20 h), this relation fell to almost 7 g of protein per g of polysaccharide.
The results of this study indicate that polysaccharide is produced by N. meningitidis in two phases, being the first one
biomass formation followed by production non-associated to microbial growth.
NOMENCLATURE
G: glucose concentration in the medium (g/L) I.N.: inorganic nitrogen concentration (g/L) P: polysaccharide concentration (g/L) O.N.: organic nitrogen concentration (g/L) X: dry biomass concentration (g/L). Y: global yield factor (see Table 1) Experiment Stationary Growth
Phase Start (h)
YX/Ga
(until stationary growth phase)
YX/ONa
(until stationary growth phase)
YP/Xa
(until stationary growth phase)
.103
YP/Xb
(until 20thhour)
.103
1 12 0.28 8.38 57 138
2 12 0.33 8.52 85 125
3 12 0.35 9.66 57 81
4 12 0.29 8.40 79 123
5 12 0.34 7.24 73 141
Average --- 0.31 8.44 70 122
Standard Error (n-1) --- 0.03 0.86 13 24
Variance Coefficient --- 9.8 10.2 18.2 19.8
a) Yield factor calculated since 0 hour until stationary growth phase start; b) Yield factor calculated since 0 hour until 20th hour. Table 1. Yield coefficients.
Experiment Number of Points (g I.N./L)Average Standard Error(n-1) Coefficient (%)Variance Confidence Interval(at 95%)
1 10 0.300 0.020 6.7 0.012
2 10 0.304 0.031 10.0 0.018
3 10 0.308 0.016 5.1 0.009
4 10 0.284 0.018 6.2 0.010
5 15 0.291 0.019 6.6 0.009
* Considering only the data above 0.5 g of dry biomass per liter of medium; ** Total of points used for average calculation. Table 2. Inorganic nitrogen along cultivation.
Experiment Number of Points Average(%) Standard Error(n-1) Coefficient (%)Variance Confidence Interval(at 95%)
1 6 12.4 1.1 9.0 0.92
2 9 12.8 0.8 6.0 0.47
3 9 12.5 0.5 3.8 0.29
4 8 13.2 0.2 1.6 0.14
5 13 12.0 0.6 5.0 0.30
Average 45** 12.6 0.4 3.1 0.10
ACKNOWLEDGEMENTS
This work was supported by the Brazilian Health Ministry, the Butantan Foundation, CAPES and FUNDAP. We thank Ms. Inês do Amaral Maurelli and Mr. Máximo de Moraes for their technical assistance and Ms. Salete Vargas for the material purchase.
RESUMO
Consumo de nitrogênio durante cultivo descontínuo
de Neisseria meningitidis (sorogrupo C)
em meio de Frantz
Polissacarídeo capsular, extraído de cultivos microbianos, é o principal antígeno para o preparo da vacina contra a doença causada por Neisseria meningitidis sorogrupo C. O conteúdo final de proteína permitido nessa vacina é de 1%. De modo a encontrar uma relação entre o consumo de nitrogênio, o crescimento microbiano (incluindo a produção de polissacarídeo) e o conteúdo de nitrogênio celular, cultivos foram realizados em um fermentador de 80 L (capacidade total), sob as seguintes condições: meio de Frantz; temperatura de 35ºC; vazão de ar de 5 L/min (0,125 vvm); freqüência de agitação de 120 rpm e pressão da dorna de 6 psi (kLa = 0.07 min-1).
Durante os cultivos, foram determinadas as concentrações de biomassa, polissacarídeo, nitrogênio celular, nitrogênio residual orgânico e inorgânico no meio. De cinco fermentações realizadas sob as mesmas condições, encontrou-se uma porcentagem média de nitrogênio celular de 12,6% (p/p) em relação à biomassa seca. O nitrogênio inorgânico do meio não apresentou variação significativa ao longo do tempo de cultivo, enquanto que o consumo de nitrogênio orgânico foi linearmente relacionado com o crescimento da população celular, com fatores de conversão constantes (média de 8,44). A cinética de produção de polissacarídeo acompanhou a de crescimento da cultura celular até o começo da fase estacionária de crescimento e, a partir desse momento até o fim do cultivo, foi observada uma produção suplementar de polissacarídeo, mas sem absorção de nitrogênio pelas células. Assim, os resultados indicaram uma estratégia de produção de polissacarídeo em duas etapas, sendo a primeira crescimento celular seguida da produção de polissacarídeo não-associado ao crescimento microbiano.
Palavras-chave: N. meningitidis, vacina, polissacarídeo, nitrogênio.
REFERENCES
1. Aymé, G.; Donikian, R.; Mynard, M.C.; Lagrandeur, G. Production and Controls of Serogroup A Neisseria meningitidis Polysaccharide Vaccine. In: Table Ronde Sur L’Immunoprophilaxie de la Meningite Cerebro-Spinale. Edition Fondation Mérieux, Lyon (France), 1973. p.4-30. 2. De Voe, I.W.; Gilchrist, J.E. Release of Endotoxin in the Form of
Cell Wall Blebs During Vitro Growth of Neisseria meningitidis. J. Exp. Med., 138: 1156-1167, 1973.
3. Frantz, I.D.Jr. Growth Requirements of the Meningococcus. J. Bact., 43: 757-761, 1942.
4. Fu, J.; Bailey, F.J.; King, J.J.; Parker, C.B.; Robinett, R.S.R.; Kolodin, D.G.; George, H.A.; Herber, W.K. Recent Advances in the Large Scale Cultivation of Neisseria meningitidis Group B for the Production of an Outer Membrane Protein Complex. Bio/.Technol., 13: 170-174, 1995. 5. Gotschlich, E.C. Meningococcal Meningitis. In: GermanierR. (ed.).
Bacterial Vaccines. Academic Press, Orlando, 1984. p.237-255. 6. Gotschlich, E.C.; Liu, T.Y.; Artenstein, M.D. Human Immunity to
the Meningococcus- III.Preparation and Immunochemical Properties of the Group A, Group B, and Group C Meningococcal Polysaccharides. J. Exp. Med., 129(2): 1349-1365, 1969. 7. Greaves, R.I.N. Preservation of Living Cells by Freezedrying. Ann.
N.Y. Acad. Sci., 85: 723, 1960.
8. Huergo, C.C.; Gonzáles, G.S. Vamengoc BC - Vacuna Contra la Enfermedad Meningococcica de los Grupos B y C. Centro Nacional de Vacuna Antimeningococcica Minsap, Habana (Cuba), 1989. 28p. 9. Kemmerer, G.; Hallet, L.T. Improved Micro-Kjeldahl Ammonia
Distillation Apparatus. Ind. Eng. Chem., 19: 1295-1296, 1927. 10. Lima, L.S. et al. Doseamento de Nitrogênio. In: Farmacopéia dos
Estados Unidos do Brasil. Brazil Health Ministry, Brasilia (Brazil), 1959. p.960-967.
11. Mallavia, L.P.; Weiss, E. Catabolic Activities of Neisseria meningitidis: Utilization of Glutamate. J. Bact., 101: 127-132, 1970. 12. Morse, S.A.; Stein, S.; Hines, J. Glucose Metabolism in Neisseria
gonorrhoeae. J. Bact., 120: 702-704, 1974.
13. Müller, H.; Hinton, J. A Proetin-Free Medium for Primary Isolation of the Gonococcus and Meningococcus. Proc. Soc. Exp. Biol. Med., 48: 330, 1941.
14. Pirt, S.J. Oxygen demand and supply. In: Principles of Microbe and Cell Cultivation. John Wiley, New York, 1975. p.81-94.
15. Plaut, A.G.; Gilbert, J.V.; Artenstein, M.S.; Capra, J.D. Neisseria gonorrhoeae and Neisseria meningitidis: Extracellular Enzyme Cleaves Human Immunoglobulin A. Science, 190: 1103-1105, 1975. 16. Plotkin, S.A.S.; Mortimer, E.A. Meningococcal Vaccines. In:
Vaccines. Saunders Company, Philadelphia, 1988. p.263-270. 17. Ramos, J.B.; Hiss, H.; Vicentin, M.A.; Paz, M.F.; Peixoto, A.; Leal,
M.B.B.; Gonçalves, P.C.; Raw, I. Batch Cultivation Kinetics of Neisseria meningitidis (Serogroup C) in Frantz Medium. I. Growth and Polysaccharide Production. Arq. Biol. Tecnol., 39: 215-220, 1996. 18. Spiro, R.G. Analysis of Sugars Found in Glycoproteins. In: Methods
in Enzymology Volume VIII: Complex Carbohydrates. Academic Press, New York, 1966. p.3-13.
19. Steen, E. Possibility of Measuring the Growth of the Meningococcus Cultivation with a Photometer. In: Fotometriske Studier Av
Meningokokkens Vekst I Syntetiske Medier. Akademisk
Trykningssentral, Oslo (Norway), 1954. p.14-58.
20. Svennerholm, L. Quantitative Estimation of Sialic Acids. II. A Colorimetric Resorcinol-Hidrochloric Acid Method. Bioch. et Bioph. Acta, 24: 604-611, 1957.