STRUCTURE AND COMPOSITION OF BACTERIAL AND FUNGAL COMMUNITY IN SOIL UNDER SOYBEAN
MONOCULTURE IN THE BRAZILIAN CERRADO
Bresolin, J.D.; Bustamante, M.M.C.*; Krüger, R.H.; Silva, M.R.S.S.; Perez, K.S.
1Universidade de Brasília, Brasília, DF, Brasil.
Submitted: November 05, 2008; Returned to authors for corrections: April 14, 2009; Approved: January 20, 2010.
ABSTRACT
Soybean is the most important oilseed cultivated in the world and Brazil is the second major producer. Expansion of soybean cultivation has direct and indirect impacts on natural habitats of high conservation value, such as the Brazilian savannas (Cerrado). In addition to deforestation, land conversion includes the use of fertilizers and pesticides and can lead to changes in the soil microbial communities. This study evaluated the soil bacterial and fungal communities and the microbial biomass C in a native Cerrado and in a similar no-tillage soybean monoculture area using PCR-DGGE and sequencing of bands. Compared to the native area, microbial biomass C was lower in the soybean area and cluster analysis indicated that the structure of soil microbial communities differed. 16S and 18S rDNA dendrograms analysis did not show differences between row and inter-row samples, but microbial biomass C values were higher in inter-rows during soybean fructification and harvest. The study pointed to different responses and alterations in bacterial and fungal communities due to soil cover changes (fallow x growth period) and crop development. These changes might be related to differences in the pattern of root exudates affecting the soil microbial community. Among the bands chosen for sequencing there was a predominance of actinobacteria, -proteobacteria and ascomycetous divisions. Even under no-tillage management methods, the soil microbial community was affected due to changes in the soil cover and crop development, hence warning of the impacts caused by changes in land use.
Key words: Savanna, Land use, Cropland, Microbial Communities, DGGE
INTRODUCTION
The Cerrado (Brazilian savanna) is the dominant biome in Central Brazil, covering approximately 24% of the area in the country. In spite of its remarkable biodiversity, the Cerrado has rapidly converted to large-scale agricultural areas due to expanding agricultural activities, especially cattle farming and
soybean plantation (25). Only 5.5% of the Cerrado (83,520 km2) is currently protected in conservation units and recent studies have estimated that by 2030 it may be extinct (24).
Soybean is the most important oilseed cultivated in the world and Brazil is responsible for 24.6% of the soybean world production, ranking as the second largest producer of this crop. In the 1980s the soybean plantations started to aggressively
expand into the savannas of Central Brazil. This expansion was influenced by the savana’s natural conditions, as for instance gentle relief (favoring mechanization) and technological development (including the selection of highly efficient N-fixing soybean cultivars), which rendered a viable cultivation of this crop in an ecosystem formerly considered inhospitable. The ensuing problems include widespread deforestation of the Cerrado and southern Amazon. In spite of the no-tillage practices adopted, a massive use of pesticides and fertilizers and the intense mechanization lead to substantial soil carbon losses and changes in the soil microbial community. Those changes can lead to an unsustainable system and soil degradation (2, 8).
Microorganisms are a critical component of ecosystems as they mediate 80-90% of the processes occurring in the soil (16, 19, 27), thus key players in the carbon and nitrogen biogeochemical cycles.
Function and diversity of bacterial and fungal communities can be a more efficient and dynamic indicator of soil quality than those based on physical and chemical properties (5, 13). However, little is known of the factors that drive diversity, in part due to the complexity of communities but also because not all microorganisms can be cultured under laboratory settings (32). Although the development of molecular biology techniques is responsible for a considerable knowledge increase on the ecological and functional aspects of microbial communities, information regarding the effects of rapid land use changes in tropical ecosystems on belowground diversity is still very scarce (6, 14).
Compared to bacteria, information on diversity and function of soil fungal community is even more limited. Some methods, like phospholipid fatty acid (PLFA), estimate only the total fungal biomass. Studies based on 18S rRNA have conducted a more refined analysis of this group (3, 9). Pinto et al. (37) and Quirino et al. (38) compared the bacterial community structure in native areas and in pastures in the Cerrado region at different times, showing that the community is influenced by vegetation cover and time since the conversion. However, the impacts of the annual crops in the
Cerrado region on the soil bacterial and fungal community have not yet been studied.
The present work aims to compare soil bacterial and fungal community structure and composition from a native Cerrado area and an area with similar characteristics under soybean monoculture along a crop cycle.
MATERIAL AND METHODS
Study Site and Soil Collection
Soil samples were collected from the “Dom Bosco” farm, located in the municipality of Cristalina, Brazil (S 16o 13' W 47o 28'). Two areas were selected: an undisturbed cerrado
stricto sensu (20-50% woody cover) and a cerrado area converted to a soybean (Glicine max cv. 70002 – Bayer S/A) monoculture plantation in 1990 and since then cultivated under no-tillage. The two areas are approximately 3 km apart. The soil of both areas was classified as Oxisols (Dystrophic Red Latosols in the Brazilian classification) with acidic pH, high aluminum saturation and low cation exchange capacity. Table 1 shows its physical and chemical characteristics. This soil type covers approximately 45% of the Cerrado region (39). Before sowing, the area was treated with herbicides and fungicides and the soybean seeds were previously inoculated with
Bradyrizobium japonicum. During the cultivation period
2004 to March 2005 and were kept on ice until they were sieved through a 2 mm mesh and stored at –20 °C for molecular analysis and 4 °C for microbial biomass C.
Determination of soil pH, gravimetric water content and
microbial biomass C
The soil pH was measured in H2O (1:2.5 mass:volume). Gravimetric water content was obtained after drying the samples at 105 oC until constant weight. The microbial biomass C was determined by the fumigation-incubation method (22). Three replications from the composite samples were incubated in air-tight flasks with water content adjusted to field capacity. Carbon dioxide (CO2) evolved was trapped in a 0.1 M KOH solution and quantified by titration using 0.1 N HCl and phenolphthalein as indicators [Kc factor of 0.41 (4)].
Extraction of total DNA
Total DNA was directly extracted from the soil composite samples by the protocol described by van Elsas et al. (44), with modifications. Two grams of soil were resuspended in 5 ml of extraction buffer (0.1 M Tris-HCl, pH 8.0, 0.1 M sodium EDTA, pH 8.0, 1.5 M NaCl, 1% CTAB, 0.1 M NaPO4) and 2 g of glass beads (150-212 microns, acid washed, Sigma®) and vortexed for 4.5 min with 10 s intervals every 90 s. After
vortexing, 200 l of SDS 20% were mixed into the sample and the mixture was incubated for 1 h at 65 °C with gentle agitation every 15 min. The mixture was then centrifuged at room temperature for 15 min at 3400g (Eppendorf 5804). The supernatant was transferred to a new tube and 1 ml PEG solution (13% PEG 8000, 1.6 M NaCl) was added. The mixture was incubated for 1 h at room temperature and then centrifuged at room temperature for 15 min at 3400g (Eppendorf 5804). The pellet was resuspended in 400 l TE. Potassium acetate was added to a final concentration of 0.5 M. The mixture was incubated on ice for 5 min and after centrifugation for 20 min at top speed the supernatant was transferred to a new tube. This solution was then extracted 3 times with an equal volume of phenol 98% and 2 times with an equal volume of chloroform/iso-amyl alcohol (24:1). The final aqueous supernatant was transferred to a new tube and an equal volume of isopropanol 80% was added to the recovered supernatant; after 1 h at room temperature the total DNA was recovered by centrifugation at top speed for 20 min. The pellet obtained was dried in a speed vac (Eppendorf) and resuspended in 200 l TE 1X. This DNA was further purified using the UltraClean TM15 kit (MOBIO Laboratories Inc.) according to the manufacturer’s instructions. The quality and quantity of the extraction were checked on 0.8% agarose gels.
Table 1. Chemical and physical characteristics of soil in the studied areas at Dom Bosco Farm, Cristalina (Federal State of Goiás,
Brazil).
Parameters* Cerrado native area Soybean area
Organic matter dag/kg 3.6 4.1
P mg/dm3 1.8 6.6
K mg/dm3 72.0 85.0
S mg/dm3 11.6 1.7
Ca2+ cmol
c/dm3 0.4 2.9
Mg2+ cmol
c/dm3 0.3 1.4
Al3+ cmolc/dm3 0.3 0.0
H+Al cmolc/dm3 6.8 2.8
Cation exchange capacity cmolc/dm3 7.7 7.3
Clay % 65 74
Silt % 20 19
Sand % 15 7
Polymerase chain reaction (PCR)
Purified total DNA was used as a template for PCR amplification. The primer pairs used to amplify 16S rDNA sequences were U968f-GC (5'-CGCCCGCCGCGCGCGGCG GGCGGGGCGGGGGCACGGGGGGACGCGAAGAACCTT AC-3'; GC clamp underlined) and L1401r (5'-GCGTGTGTACAAGACCC-3') (31). PCR amplification was performed using a Thermocycler (Perkin Elmer). The cycling parameters were 4 min denaturation at 95 °C followed by 25 cycles of 95 °C for 1 min, 47 °C for 1.5 min and 72 °C for 3 min and finally 72 °C for 15 min. Each 50 l PCR reaction contained 10 ng of total soil DNA, Taq 1X reaction buffer (10 mM Tris-HCL pH 8.3 5 mM KCl; 1.5 mM MgCl2), 2.5 mM dNTPs (Promega), 20 M of each primer and 5 u Taq DNA polymerase (Gibco BRL).
The amplification of 18S rDNA sequences occurred by a nested PCR procedure (7, 42). The first round involved amplification of approximately 1400 bp using primers EF4f (5'-GGAAGGG[G/A]TGTATTTATTAG-3') and EF3r (5'-TCCTCTAAATGACCAGTTTG-3'). The product of this reaction was diluted 1:1000 with sterile water and used as template for a subsequent round of PCR with primers EF4f and NS3r-GC (5’-CGCCCGCCGCGCCCCGCGCCCGGCCCGCC GCCCCCGCCCCGGCTGCTGGCACCAGACTTGC-3’; GC clamp underlined) resulting in a PCR product of approximately 500 bp. PCR amplification was performed using a Thermocycler (MJ). Each 50 l PCR reaction contained 10 ng of total soil DNA, Taq 1X reaction buffer (10 mM Tris-HCL pH 8.3; 5 mM KCl; 1.5 mM MgCl2), 2.5 mM dNTPs (Promega), 40 M of each primer, 5 u Taq DNA polymerase (Gibco BRL) and mineral oil. The thermocycling parameters for the first amplification with EF4-EF3 were 4 min denaturation at 94 °C followed by 25 cycles of 95 °C for 1 min, 51 °C for 1 min and 72 °C for 1 min and lastly 72 °C for 10 min. The cycling parameters for the second amplification with EF4-NS3-GC were 4 min denaturation at 94 °C; 10 cycles of 95 °C for 1 min, 60 °C for 1 min (with reduction of 1 °C every cycle) and 72 °C for 1 min; 15 cycles of 94 °C for 1 min, 50 °C
for 1 min and 72 °C for 2 min; 72 °C for 5 min. The amplicons were checked on 1% agarose gels.
Denaturing gradient gel electrophoresis (DGGE)
16S rDNA PCR products (20 l of each) were analyzed by DGGE (Bio-Agency Inc.) using a polyacrilamide gel (6%) with a denaturant gradient of 45-75%. 15 l of the 18S rDNA PCR products were ran in DGGE (Bio-Agency Inc.) using a polyacrylamide gel (10%) with a 30-45% denaturant gradient (100% denaturant is equivalent to 7 M urea and 40% v/v of deionized formamide). Polymerization was achieved by the addition of ammonium persulfate (0.1% v/v) and TEMED (tetra-methyl-ethylene diamine 0.05% v/v). Before polymerization was complete a 2 ml top loading gel containing 0% denaturants was dispensed and the gel comb carefully placed into this. 16S rDNA PCR-DGGE was subjected to electrophoresis for 18 h at 70 V in 1X TAE buffer at a constant temperature of 55 °C and 18S rDNA PCR-DGGE was subjected to electrophoresis for 17 h at 85 V in 1X TAE buffer at a constant temperature of 55 °C. Electrophoresis under the same conditions was performed without the samples for 1 h to clean up the gel and heat the buffer. The gels were stained with SYBR Green I (Molecular Probes Inc., OR, USA) according to the manufacturer’s instructions. The images were captured using a UV transillumination table (TFX 35M, Gibco BRI UV) and KodaK - Digital Science Electrophoresis Documentation and Analysis System (DC 120). The best gels were stained with AgNO3 (12) for further excision and sequencing of DGGE bands. At least three DGGE runs were carried out for the samples in order to estimate the method’s reproducibility.
Sequencing of DGGE bands
Following reamplifications, 5 l of the PCR products were rerun on DGGE gels to confirm their purity and positions relative to the bands from which they were excised. PCR amplification products were run on a 1% agarose gel and bands were excised and purified using the UltraClean TM 15 kit (MOBIO Laboratories Inc.). The products were then sequenced by using a DYEnamic ET Terminator Cycle Sequencing kit (Amersham Biosciences) for the automated ABI Prism 377 DNA Sequencer (Applied Biosystems) according to the manufacturer’s instructions. To confirm the identities, both primer pairs used for PCR amplification were adopted in separate sequencing reactions. Sequences were analyzed and checked for chimeras using the program Bellerophon - Huber-Hugenholtz (21) (http://foo.maths.uq.edu.au/~huber/bellero phon.pl) and compared to the database of sequences deposited at the National Center for Biotechnology (NCBI) using BLAST (http://www.ncbi.nlm.nih.gov).
Statistical analyses
Statistical analyses were carried out using the computer package SPSS v.10 (SPSS Inc., IL, USA). Normality was verified by using the Kolmogorov-Smirnov test. One-way
analysis of variance (repeated measures ANOVA; p < 0.05) was used to determine significant differences in the pH, gravimetric content and microbial biomass C. Student’s t-test was used to determine differences between the samples collected in row and inter-rows. DGGE banding patterns (band presence and absence) matrix data were used to calculate the pairwise similarities of the profiles using the Dice coefficient. The cluster analyses based on this matrix were performed using UPGMA – Dice Coefficient (23) and were carried out using the package NTSYSpc - Numerical Taxonomy and Multivariate Analysis System v.2.10.
RESULTS
The soil pH values in the soybean area were higher (5.2 in March to 6.5 in December) than in the native area (4.6 in March to 5.3 in December). Differences in row and inter-row occurred only in January 2005, with samples from the row showing higher pH values (P 0.05) (Table 2). The values of soil gravimetric water content are organized in the same table. They ranged from 5.1% in September (dry season) to 41.6% in February (rainy season).
Table 2. Values of pH , microbial biomass C and gravimetric water content of the soil samples (0-5 cm) collected at Dom Bosco
Farm, Cristalina (Federal State of Goiás, Brazil).
Sample
Number Sample Description pH
Microbial Biomass C mg C.kg-1 soil
Gravimetric Water Content (%)
1 Native area - October 2004 5.4 + 0.16 325.7 12.6 + 3.2
2 42 days before sowing – row (September 2004) 6.0 + 0.10 220.8 + 113.6 5.7 + 0.8 3 42 days before sowing – inter-row(September 2004) 6.0 + 0.12 84.5 + 65.0 5.1 + 1.6 4 7 days after sowing - row (November 2004) 5.9 + 0.20 190.9 + 26.5 37.3 + 1.4 5 7 days after sowing – inter-row (November 2004) 6.1 + 0.21 250.7 + 91.1 40.8 + 1.3 6 Flowering – row (December 2005) 6.5 + 0.06 130.4 + 33.3 31.4 + 0.9 7 Flowering – inter-row (December 2005) 6.4 + 0.10 248.4 + 10.2 33.8 + 1.0 8 Fructification - row (January 2005) 5.9 + 0.00 176.8 + 31.6 36.6 + 0.9 9 Fructification – inter-row (January 2005) 5.6 + 0.10 275.3 + 17.5 35.6 + 0.4 10 29 days before harvesting - row (February 2005) 5.9 + 0.10 202.3 + 80.8 41.6 + 1.0 11 29 days before harvesting – inter-row (February 2005) 5.9 + 0.06 196.5 + 13.5 41.1 + 1.4 12 7 days after harvesting - row (March 2005) 5.2 + 0.00 193 + 27.8 22.4 + 3.9 13 7 days after harvesting – inter-row (March 2005) 5.2 + 0.06 367.6 + 147.2 27.5 + 1.0
Soil microbial biomass C in the soybean area was between 17% and 66% lower than in the native area. A significant variation between months was observed in the soybean area only for inter-row samples (84.5 mg C.kg-1 soil in September 2004 and 367.6 mg C.kg-1 soil in March 2005) (Table 2). Differences between row and inter-row occurred only in December 2004 and January 2005 when samples from the inter-row presented higher values of soil microbial biomass (P
0.05).
Replicates of profiles produced by DGGE showed reproducibility. Firstly, the band profiles produced by DGGE of bacterial and fungal rDNA amplified fragments from the
row and inter-row samples were compared. The level of similarity between the row and inter-row samples collected on the same day are presented in Table 3. The similarity was higher than 75% in most of the cases. The exceptions were the 16S rDNA fragments from the samples collected during the period of fructification (similarity of 57%) and the 18S rDNA fragments from the samples collected a week after the harvest (similarity of 46%). Because of the high similarity between the row and inter-row samples, the comparison with the native cerrado area and between the different dates will be presented only for the samples from the rows.
Table 3. Dice similarity coefficient between row and inter-row in the cluster analysis of bacterial and fungal communities of soil
samples (0-5 cm) collected in the soybean area.
Sample Number Sample Description Row and Inter-row similarity
16S 18S
2 and 3 42 days before sowing (September 2004) 94.5 % 94.0 %
4 and 5 7 days after sowing (November 2004) 100.0 % 78.6 %
6 and 7 Flowering (December 2005) 89.0 % 78.6 %
8 and 9 Fructification (January 2005) 57.0 % 77.9 %
10 and 11 29 days before harvesting (February 2005) 96.2 % 77.9 %
12 and 13 7 days after harvesting (March 2005) 70.5 % 46.0 %
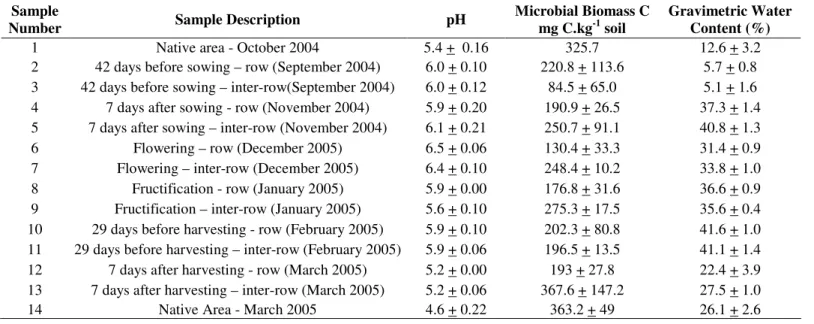
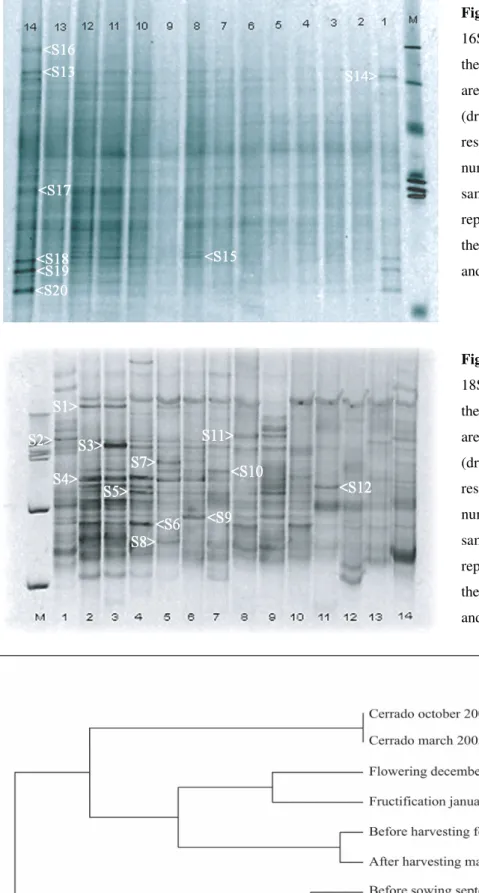
The band profile produced by DGGE of bacterial 16S rDNA amplified fragments was characterized by a few strong and exclusive bands appearing in the samples from the native area (samples 1 and 14 in Figure 1). However, in terms of intensity of bands, the differences between collection dates in the soybean areas were not striking. In contrast, the profile obtained from DGGE of fungal 18S rDNA was characterized by a stronger differentiation of the samples in terms of intensity and position of the bands (Figure 2). In both profiles (16S and 18S rDNA) a large number of weaker bands was observed, indicating microbial communities with complex structure. The
Figure 1. DGGE fingerprints of PCR-amplified
16S rDNA sequences. M - 1kb ladder following the samples listed in table 2. Samples 1 and 14 are from the native Cerrado area in October 2004 (dry season) and March 2005 (end of wet season), respectively. Samples 2 to 13 (odd and even numbers correspond to inter-row and row samples, respectively) are from the soybean area representing the period before sowing (fallow) to the post-harvesting period. The associated letters and numbersindicate the sequenced bands.
Figure 2. DGGE fingerprints of PCR-amplified
18S rDNA sequences. M - 1kb ladder following the samples listed in table 2. Samples 1 and 14 are from the native Cerrado area in October 2004 (dry season) and March 2005 (end of wet season), respectively. Samples 2 to 13 (odd and even numbers correspond to inter-row and row samples, respectively) are from the soybean area representing the period before sowing (fallow) to thepost-harvesting period. The associated letters and numbersindicate the sequenced bands.
Figure 3. Cluster analysis
The dendrogram for the fungal community (Figure 4) indicated the first separation at 51% of similarity. One group included the samples from the native area and those collected two days after the second fertilization in the soybean areas. The second group included the other samples from the soybean area. The further divisions in this second group were related to the temporal sequence of sample collections.
In spite of the variations between the dendrograms, the analysis of the banding patterns of all gels showed a stronger effect of the soil cover, development stage of soybean and time for the bacterial and fungal communities. Bands that appeared in all samples and those exclusively for the cerrado were chosen to be sequenced. BLAST search indicated that all sequences are from uncultured soil microorganisms (Table 4).
DISCUSSION
The cerrado has clearly defined dry and rainy seasons. This variation is most likely responsible for changes in the soil pH, water gravimetric content and microbial biomass C in the samples from the native area (Table 2). Changes in the soil pH and water gravimetric content affect microbial populations. Seasonal variations of soil pH change the distribution pattern of the kind of microorganisms since bacteria prefers neutral to alkaline conditions and fungi prefers the acidic ones (47).
In the soybean area, microbial biomass C concentration did not show variations during the cultivation period, which corresponds to the rainy season in the Cerrado region.
However, even under the no-tillage system, microbial biomass in the soybean area was lower than in the native area, showing the effect of land conversion and cultivation on microbial biomass. Similar results were found by Perez et al. (36) in soils under native Cerrado vegetation, when compared to a soybean monoculture under conventional tillage system. The effect of management (tillage and cover cropping) on soil microbial communities in the Cerrado was also observed in Peixoto et al. (33) using PCR-DGGE analysis with variations in the dominant bacterial population and in Castro et al. (9) with RISA 18S rDNA profiles observing different banding patterns in the Cerrado native area, soybean monoculture and pasture areas.
Figure 4. Cluster analysis
Table 4. Bacterial and fungal diversity of selected 16S and 18S rDNA DGGE bands and GenBank accession numbers.
Observation Band BLAST Search Acess Number
High intensity before sowing in row and inter-row S1 Uncultured soil fungus GQ294579 Higher intensity in native samples S2 Uncultured soil fungus GQ294580 High intensity in inter-row before sowing S3 Uncultured soil fungus GQ294581 Absent in native area in October (rainy season) and high
intensity in sowing period S4 Uncultured soil fungus GQ294582
Present in all profiles and higher in row after sowing S5 _
High intensity in row after sowing and in native areas S6 Uncultured soil fungus GQ294583 Present in inter-row after sowing and in native area in March
(dry season) S7 Uncultured soil fungus GQ294584
Present in all profiles S8 Uncultured soil fungus GQ294585
High intensity and absent in harvest period samples S9 Uncultured soil fungus GQ294586
Absent in native área S10 Uncultured soil fungus GQ294587
High intensity in soybean area fructification period in row and
inter-row S11 Uncultured soil fungus GQ294588
High intensity in inter-row before harvesting and in sowing
period S12 Uncultured soil fungus GQ294589
Present in all profiles and higher intensity in native areas S13 Uncultured soil bacteria GQ294590 Present in all profiles and higher intensity in native areas S14 _
High intensity in row and absent in inter-row in soybean
fructification S15 Uncultured soil bacteria GQ294591
Exclusively present in native area in March (dry season) S16 _
Present in all profiles S17 _
Absent until flowering and high intensity in native areas S18 Uncultured soil bacteria GQ294592 High intensity in native areas S19 Uncultured soil actinobacteria GQ294593
High intensity in native areas S20 Uncultured soil bacteria GQ294594
In 16S and 18S rDNA DGGE profiles a large number of weaker bands was observed, indicating microbial communities with complex structure. However, the profiles of bacterial 16S rDNA and fungal 18S rDNA amplified fragments differed in the distribution and intensity of the bands. The 18S rDNA profiles were characterized by a stronger differentiation of the samples in terms of intensity of the bands. This difference could be related to different levels of spatial variation for bacterial and fungal communities, as fungal growth is usually observed in patches (16). Fungi have many arrangements of hyphae in no-tillage systems. The opposite is observed for bacteria that have greater biomass in tillage systems (47). Thus,
on our samples, fungi may have a greater biomass, which could cause the difference observed in the DGGE profiles.
indicated that the structure of microbial communities is affected by the plant cover structure and composition. Plant activity is a primary determinant of the soil microbial community structure because of the release of specific forms of carbon that can represent important energy sources (15). The type of vegetation and the environmental conditions are contributing factors to the quality and quantity of the litter, influencing decomposition and community heterogeneity (26) and thus acting directly on the soil microbial community. An effect of the presence or absence of plant cover was also detected through the separation of samples collected during the fallow and cultivation period in the soybean area. Smalla et al. (41) compared bulk soils with soils cultivated with strawberry, potato and grape through the analyses of 16S rDNA fragments by PCR-DGGE. Most bacterial populations were equally abundant in the bulk soil but the pattern of soils under farming indicated the presence of very intense bands and low faint bands, hence indicating the effect of plant presence on the bacterial community structure.
In addition to the vegetation cover, our data suggest that variations in the microbial community occurred at different stages of crop development. That is because plants release a variety of compounds in the soil, creating unique environments for the development of microorganisms. Those environments depend on the quantity and quality of exudates which is influenced by plant genotype, the development stage of plants and the environmental conditions such as CO2, light, pH, temperature and nutrients (17, 18, 32, 41, 45, 46). In the study herein, a different distribution of photosynthetic products to the roots may have contributed to a modification in the pattern of exudates released in the soil. As an annual plant, soybean initially has a low accumulation of dry matter and absorption of nutrients. In the next stage, 30 to 60 days after sowing, plant development and nutrient and water uptake occur at higher rates coupled to an intense photosynthesis rate. At the end of the next stage, which corresponds to fructification, there is a decrease in photosynthesis that continues until total senescence (43). This decrease in the synthesis of organic compounds
could contribute to changes in the release of root exudates, hence affecting soil microbial communities.
Other factors, as for instance the application of herbicides, fungicides and insecticides and the difference on the chemical and physical characteristics of soil presented in table 1 may influence the community structure. Besides this, as the high similarity of the groups formed on dendrograms evidence the effect on plant development, other factors may have only some contribution, which was not possible to see from the results.
The bands selected for sequencing are from uncultured soil microorganisms. This is particularly relevant considering that microbial communities of the Cerrado soils have been poorly investigated to date and the rate of conversion of natural systems is very rapid. Most of the studies on soil microbiota in Brazil used the analysis of 16S and 18S rDNA genes and other molecular techniques (6, 9, 35) that result in phylogenetic descriptions of the community. The use of other techniques, such as metagenomics, is necessary for studies on the functioning and ecology of soil microorganisms.
Many bands did not have high quality sequences for homology identification (90% <) (S5, S14, S16 and S17). Considering that DGGE allows the detection of only determinant populations, it is not possible to confirm the absence of other groups in the samples. A similar result was observed by Sekiguchi et al. (40) when trying to sequence DGGE 16S rDNA bands. A library of clones created from those non-sequenced bands allowed the detection of many different phylogenetic sequences, hence suggesting that even if a band appears in a DGGE profile as an unique band it can include small quantities of DNA by a co-migration of the bands (11).
through very extensive cloning and sequencing of components, the use of PCR-DGGE profiling has proven to be a powerful tool in assessing community structure differences in soils (11, 33).
Although similar studies have been already performed, the present manuscript is the first of its kind carried out in the Cerrado. But, additional caution should accompany these results because the data were obtained from relatively few composite samples. Besides the DGGE bias already discussed, the impacts of DNA extraction and PCR amplification may have also contributed to further bias (20). Therefore, further research is needed to confirm the observations reported herein. Despite the critical role of the soil microbial community, studies on its structure and composition in tropical areas are not widespread. The present study pointed out that after 30 years of conversion and continuous cultivation under no-tillage, differences between microbial communities from native Cerrado areas and cropland are significant (regarding the amount of microbial biomass, community structure and composition). It also indicated that the soil microbial community responds to changes in crop development stages and that the responses of bacterial and fungal communities differ. Considering the fast rate of transformation and the intensification of land use in the Cerrado region as well as in other tropical regions, our results provide a warning about the consequences of human activity on soil microbial communities and suggest that more studies are essential for a better understanding of the processes that regulate microbial communities in native areas and the effects of land use changes.
ACKNOWLEDGEMENTS
The authors are very grateful to Mr. Sebastião Conrado, owner of “Dom Bosco Farm”, to the team at the Biotechnology Laboratory from the Universidade Católica de Brasília and the Ecology laboratory of the Universidade de Brasília (Cristiane Oliveira, MSc. Êrika Fernandes, Dr. Alessandra Kozovits and Adriano Porto) for assistance during field and laboratory
measurements. Dr. Fábio Reis Jr. (Embrapa-Cerrados) contributed with valuable advice throughout this study. This research was funded by NASA under Large Scale Biosphere-Atmosphere in Amazonia (LBA) project ND-07 and by EPA through the Assistance Agreement 827291-01 and by CNPq and FAP-DF. J.D. Bresolin received a fellowship from CAPES (Brazil).
REFERENCES
1. Arias, M.E.; González-Pérez, J.A.; Gonzáles-Vila, F.J.; Ball, A.S. (2005). Soil health – a new challenge for microbiologists and chemists. Intern
Microbiol. 8, 13-21.
2. Aidar, H.; Kluthcouski, J. (2003). Evolução das Atividades Lavoureira e Pecuária nos Cerrados. In: Kluthcouski, J.; Stone, L.F.; Aidar, H. (eds).
Integração Lavoura-Pecuária. EMBRAPA Arroz e Feijão, Santo Antônio de Goiás, Brazil, p 23-58.
3. Anderson, I.C.; Cairney, J.W.G. (2004). Diversity and ecology of soil fungal communities: increased understanding through the application of molecular techniques. Environ Microbiol. 6 (8), 769-779.
4. Anderson, J.P.; Domsch, K.H. (1978). A physiological method for quantitative measurement of microbial biomass in soils. Soil Biol
Biochem. 10, 215-221.
5. Bridge, P.; Spooner, B. (2001). Soil fungi: diversity and detection. Plant
Soil. 232, 147-154.
6. Bossio, D.A.; Girvan, M.S.; Verchot, L.; Bullimore, J.; Borelli, T.; Albrecht, A.; Scow, K.M.; Ball, A.S.; Pretty, J.N.; Osborn, A.M. (2005). Soil Microbial Community Response to Land Use Change in an Agricultural Landscape of Western Kenya. Microb Ecol. 49, 50-62. 7. Brodie, E.; Edwards, S.; Clipson, N. (2003). Soil fungal community
structure in a temperate upland grassland soil. FEMS Microbiol Ecol. 45, 105-114.
8. Bustamante, M.M.C.; Median, E.; Asner, G.P.; Nardoto, G.B.; Garcia-Montiel, D.C. (2006). Nitrogen cycling in tropical and temperate savannas. Biogeochem. 79, 209-237.
9. Castro, A.P.; Quirino, B.F.; Pappas, G.Jr.; Kurokawa, A.S.; Neto, E.L.; Krüger, R.H. (2008). Diversity of soil fungal communities of Cerrado and its closely surrounding agriculture fields. Arch Microbiol. 190, 129-139.
10. Costa, R.; Götz, M.; Mrotzek, N.; Lottmann, J.; Berg, G.; Smalla, K. (2006). Effects of site and plant species on rhizosphere community structure as revealed by molecular analysis of microbial guilds. FEMS
Microbiol Ecol. 56(2), 236-249.
12. Creste, S.; Tulmann Neto. A.; Figueira, A. (2001). Detection of Single Sequence Repeat Polymorphisms in Denaturing Polyacrilamide Sequencing Gels by Silver Staining. Plant Mol Biol Reporter. 19, 299-306.
13. Doran, J.W.; Zeiss, M.R. (2000). Soil health and sustainability: managing the biotic component of soil quality. Appl Soil Ecol. 15, 3-11.
14. Enwall, K.; Nyberg, K.; Bertilsson, S.; Cederlund, H.; Stenström, J.; Hallin, S. (2007). Long-term impact of fertilization on activity and composition of bacterial communities and metabolic guilds in agricultural soil. Soil Biol Biochem. 39, 106-115.
15. Garbeva, P.; Veen, J.A.; Elsas, J.D.van. (2004). Microbial diversity in soil: Selection of microbial populations by plant and soil type and implications for disease suppressiveness. Ann Rev Phytopathol. 42, 243-270.
16. Girvan, M.S.; Bullimore, J.; Ball, A.S.; Pretty, J.N.; Osborn, A.M. (2004). Responses of Active Bacterial and Fungal Communities in Soils Under Winter Wheat to Different Fertlizer and Pesticide Regimens. Appl
Environ Microbiol. 70(5), 2692-2701.
17. Grayston, S.J.; Vaughan, D.; Jones, D. (1996). Rhizosphere carbon flow in trees, in comparison with annual plants: the importance of root exudation and its impact on microbial activity and nutrient availability.
Appl Soil Ecol. 5, 29-56.
18. Gregory, P.J. (2006). Roots, rhizosphere and soil: the route to a better understanding of soil science?. Eur J Soil Sci. 57, 2-12.
19. Heilmann, B.; Lebuhn, M.; Beese, F. (1995). Methods for investigation of metabolic activity and shifts in the microbial community in soil treated with a fungicide. Biol Fertil Soils. 19, 186-192.
20. Hermansson, A.; Lindgren, P. (2001). Quantification of Ammonia-Oxidizing Bacteria in Arable Soil by Real Time PCR. Appl Environ.
Microbiol. 67(2), 972-976.
21. Huber, T.; Faulkner, G.; Hugenholtz, P. (2004). Bellerophon: a program to detect chimeric sequences in multiple sequence alignments.
Bioinformatics Appl Note. 20, 2317-2319.
22. Jenkinson, D.S.; Powlson, D.S. (1976). The effects of biocidal treatments on metabolism in soil - A method for measuring soil biomass. Soil Biol
Biochem. 8(3), 209- 213.
23. Johnson, M.J.; Lee, K.I.; Scow, K.M. (2003). DNA fingerprinting reveals links among agricultural crops, soil properties and the composition of soil microbial communities. Geoderma. 114, 279-303.
24. Machado, R.B.; Ramos Neto, M.B.; Pereira, P.G.P.; Caldas, E.F.; Gonçalves, D.A.; Santos, N.S.; Tabork Steininger, M. (2004).
Estimativas de perda da área do Cerrado brasileiro. Conservation International (CI), Brasília, Brasil.
25. Mittermeier, R.A.; Gil, P.R.; Hoffmann, M.; Pilgrim, J.; Brooks, T.; Mittermeier, C.R.; Lamourex, J.; Fonseca, G.A.B. (2005). Hotspots
Revisited – Earth’s Biologically Richest and Most Endangered
Terrestrial Ecorregions. Conservation International (CI), CEMEX.
26. Moreira, F.M.S.; Siqueira, J.O. (2006). Microbiologia e Bioquímica do
Solo. 2nd ed, UFLA, Lavras, Brasil.
27. Nannipieri, P.; Ascher, J.; Ceccherini, M.T.; Landi, L.; Pietramellara, G.; Renella, G. (2003). Microbial Diversity and Soil Functions. Eur J Soil
Sci. 54, 655-670.
28. Nikolausz, M.; Sipos, R.; Révész, S.; Székely, A.; Márialigeti, K. (2005). Observation of bias associated with re-amplification of DNA isolated from denaturing gradient gels. FEMS Microbiol Letters. 244, 385-390. 29. Neher, D.A.; Wu, J.; Barbercheck, M.E.; Anas, O. (2005). Ecosystem
type affects interpretation of soil nematode community measures. App
Soil Ecol. 30, 47-64.
30. Neufeld, J.D.; Mohn, W.W. (2005). Unexpectedly igh bacterial diversity in Artic Tundra Relative to Boreal Forest Soils, Revealed by Serial Analysis of Ribosmal Sequence Tags. App Environ. Microbiol. 71(10), 5710-5718.
31. Nübel, U.; Engelen, B.; Felske, A.; Snaidr, J.; Wieshuber, A.; Amann, R.I.; Ludwig,W.; Backhaus, H. (1996). Sequence Heterogeneities of Genes Encoding 16S rRNAs in Paenibacillus polymyxa Detected by Temperature Gel Gradient Electrophoresis. J. Bacteriol. 178(19), 5636-5643.
32. Nunan, N.; Daniell, T.J.; Singh, B.K.; Papert, A.; McNicol, J.W.; Prosser, J.I. (2005). Links between plant and rhizoplane bacterial communities in grassland soils, characterized using molecular techniques. App Environ Microbiol. 71, 6784-6792.
33. Peixoto, R.S.; Coutinho, H.L.C.; Madari, B.; Machado, P.L.O.A.; Rumjanek, N.G.; Elsas, J.D. van.; Seldin, L.; Rosado, A.S. (2006). Soil aggregation and bacterial community structure as affected by tillage and cover croping in the Brazilian Cerrados. Soil Tillage Res. 90, 16-28. 34. Pereira, J.C.; Neves, M.C.P.; Gava, C.A.T. (2000). Efeito do cultivo da
soja na dinâmica da população bacteriana em solos de Cerrado. Pesquisa
Agropecuária Brasileira. 35(6), 1183-1190.
35. Pereira, R.M.; Silveira, E.L.; Scaquitto, D.C.; Pedrinho, E.A.N.; Val-Moraes, S.P.; Wickert, E.; Carareto-Alves, L.M.; Lemos, E.G.M. (2006). Molecular Characterization of bacterial populations of different soils.
Braz J Microbiol. 37, 439-447.
36. Perez, K.S.S.; Ramos, M.L.G.; McManus, C. (2004). Carbono da biomassa microbiana em solo cultivado com soja sob diferentes sistemas de manejo nos Cerrados. Pesquisa Agropecuária Brasileira. 39(6), 567-573.
37. Pinto, A.S.; Bustamante, M.M.C.; Silva, M.R.S.S.; Kisselle, K.W.; Brossard, M.; Krüger, R.H.; Zepp, R.G.; Burke, R.A. (2006). Effects of different treatments of pasture restoration on soil trace gas emissions in the Cerrados of Central Brazil. Earth Interactions. 10, 1-26.
39. Reatto, A.; Correia, J.R.; Spera, S.T. (1998). Solos do Bioma Cerrado. In: Sano, S.M.; Almeida, S.P. (eds). Cerrado-Ambiente e Flora. Embrapa, Planaltina, Brasil, p 195-246.
40. Sekiguchi, H.; Tomioka, N.; Nakahara, T.; Uchiyama, H. (2001). A single band does not always represent a single bacterial strain in denaturing gradient gel electrophoresis analysis. Biotech Letters. 23, 1205-1208.
41. Smalla, K.; Wieland, G.; Buchner, A.; Zock, A.; Parzy, J.; Kaiser, S.; Roskot, N.; Heuer, H.; Berg, G. (2001). Bulk and Rhizosphere Soil Bacterial Communities Studied by Denaturing Gradient Gel Electrophoresis: Plant-Dependent Enrichment and Seasonal Shifts Revealed. Appl Environ Microbiol. 67(10), 4742-4751.
42. Smit, E.; Leeflang, P.; Glandorf, B.; Elsas, J.D. van.; Wernass, K. (1999). Analysis of fungal diversity in the wheat rhizosphere by sequencing of cloned PCR-Amplified genes encoding 18S rRNA and temperature gradient gel electrophoresis. Amer Soc Microbiol. 65(6), 2614-2621. 43. Tanaka, R.T.; Mascarenhas, H.A.A.; Borkert, C.M. (1993). Nutrição
mineral da soja. In: Arantes, N.E.; Souza, P.I.M. (eds). Cultura da soja
nos Cerrados. Associação Brasileira para Pesquisa da Potassa e do Fosfato, Piracicaba, Brasil.
44. Van Elsas, J. D.; Mäntynen, V.; Wolters, A.C. (1997). Soil DNA extraction and assessment of the fate of Mycobacterium chlorophenolicum strain PCP-1 in different soil by 16S ribosomal RNA gene sequence based most-probable-number PCR and immunofluorescence. Biol Fertil Soils. 24:188-195.
45. Wardle, D.A.; Yeates, G.W.; Nicholson, K.S.; Bonner, K.I.; Watson, R.N. (1999). Response of soil biomass dynamics, activity and plant litter decomposition to agricultural intensification over a seven-year period.
Soil Biol Biochem. 31, 1701-1720.
46. Yang, C.H.; Crowley, D.E. (2000). Rhizosphere microbial community structure in relation to root location and plant iron nutritional status. Appl
Environ Microbiol. 63, 345-351.