ABSTRACT: The study of labile carbon fractions (LCF) provides an understanding of the behavior of soil organic matter (SOM) under different soil management systems and cover crops. The aim of this study was to assess the effect of different soil management systems with respect to tillage, cover crop and phosphate fertilization on the amount of the LCF of SOM. Treatments con-sisted of conventional tillage (CT) and no-tillage (NT) with millet as the cover crop and a no-tillage system with velvet bean at two phosphorus dosages. Soil samples were collected and analyzed for organic carbon (OC), C oxidizable by KMnO4 (C-KMnO4), particulate OC (POC), microbial bio-mass carbon and light SOM in the 0.0-0.05, 0.05-0.10 and 0.10-0.20 m soil layers. The Carbon Management Index (CMI) was calculated to evaluate the impacts of soil management treatments on the quality of the SOM. The different LCFs are sensitive to different soil management systems, and there are significant correlations between them. C-KMnO4 is considered the best indicator of OC carbon lability. In the soil surface layers, the CT reduced the carbon content in all of the labile fractions of the SOM. The use of phosphorus led to the accumulation of OC and carbon in the dif-ferent soil fractions regardless of the tillage system or cover crop. The application of phosphate fertilizer improved the ability of the NTsystem to promote soil quality, as assessed by the CMI. Keywords: labile organic matter, soil organic matter, phosphorus fertilization
1University of Brasília/FAV/Central Institute of Sciences, Campus Darcy Ribeiro − 70910-970 − Brasília, DF − Brazil. 2Embrapa Cerrados, BR 020, km 18 − 73310-970 − Planaltina, DF − Brazil.
*Corresponding author <[email protected]>
Edited by: Carlos Eduardo Pellegrino Cerri
Relationships between labile soil organic carbon fractions under different soil
Géssica Pereira de Souza1, Cícero Célio de Figueiredo1*, Djalma Martinhão Gomes de Sousa2
Received February 04, 2015
Accepted March 06, 2016
Introduction
The formation of soil organic matter (SOM) is very complex (Haynes, 2005). This complexity makes it difficult to understand SOM dynamics when the soil is subjected to different management systems. Therefore, chemical and physical fractionation methods have been developed to evaluate SOM by studying its fractions, thus assessing more accurately the effects caused by manage-ment systems and crops on these fractions (von Lützow et al., 2007; Li et al., 2015). The fractions of labile SOM have high rates of decomposition and short residence times in the soil (Haynes, 2005). Because of this rapid cy-cling, the labile SOM is a more sensitive fraction for eval-uating changes caused by agricultural practices (Vieira et al., 2007; Campos et al., 2011) than the total carbon (TC) (Figueiredo et al., 2013; Quanying et al., 2014).
In the tropics, phosphorus (P) depletion and the decrease in SOM lead to land degradation (Aguiar et al., 2013), and there is a relationship between the SOM and P in soils under different management systems. Further-more, the nature and dynamics of the SOM and P are associated and can be a basis for predicting the modi-fications that land-use changes can have on soil quality (Aguiar et al., 2013).
Several studies have demonstrated the behavior of the labile fraction of SOM under different tillage systems (Loss et al., 2014; Quanying et al., 2014). However, these studies usually consider only specific fractions of the la-bile SOM and do not reflect the relationships between labile fractions obtained by different procedures, which makes it difficult to compare results from different stud-ies. Furthermore, the magnitude of change in the labile
organic carbon fraction was different from one to the other (Quanying et al., 2014). To resolve such issues, the carbon management index (CMI) has been used as a tool fort determining the state and rate of change in soil C of land use systems in an integrated manner (Blair et al., 1995; Nogueirol et al., 2014).
We hypothesized that (i) the tillage system impacts the labile SOM fraction more strongly than the soil or-ganic carbon (OC); (ii) positive correlations are present between the various labile fractions; (iii) phosphorus fer-tilization and a no-tillage system promote the accumula-tion of SOM and an increase in the CMI. Our goal was to assess the effect of soil management with respect to till-age, cover crop and phosphate fertilization on the amount of the labile carbon fractions of the SOM in the Cerrado.
Materials and Methods
Location and characteristics of the experimental area
The study was carried out in an experimental area of Embrapa Cerrados, in Planaltina, DF, Brazil (15°36’ S, 47°42’ W and an altitude of 1.014 m). The climate is Cwa according to Köppen’s classification (Alvares et al., 2013), with a mean annual temperature and precipita-tion of 21.3 °C and 1,570 mm, respectively. The soil was categorized as an Acrustox according to the Soil Taxono-my classification (Soil Survey Staff, 2006), with the relief characterized as gently undulating, 3 % slope, and the contents of clay, silt and sand are 571, 72 and 357 g kg−1,
respectively.
The area was deforested in 1976 and was used for pasture and grain production for 20 years. In 1996, prior to sowing soybean, limestone was applied to decrease
soil acidity and increase grain yield. In the same agricul-tural year of 1996 and the following year (1997/98), soy-beans were planted and 80 kg ha−1 of P
2O5 were applied
in the planting furrow; 80 kg ha−1 of K
2O as potassium
chloride and 30 kg ha−1of sulfur (S) as gypsum were
broadcasted on the soil surface. In 1998/99, corn was grown in the area, and 80 kg ha−1 of K
2O, 30 kg ha −1 of
S and 150 kg ha−1 of urea N, without phosphorus, were
applied at planting. These three crops were grown to gain knowledge about the variability of the area so that the proper experimental design might be selected, and to obtain high soil fertility for the study of P management.
The experiment began in 1999 when the treat-ments of phosphorus (P) rates were established. The soil chemical conditions were appropriate, due to the corn-soybean succession, and winter cover crops were sown at the end of the rainy season and remowed at the time of flowering. In 2008 and 2009, the cover crops were fertilized with 45 kg ha−1 of urea N to increase the
pro-duction of plant biomass.
Because of a common phenomenon in the region called “veranico” (mid-summer drought), the soybean and corn crops received supplemental sprinkler irriga-tion in drought situairriga-tions during the rainy season. The irrigation was controlled by tensiometers installed in plots at a depth of 0.20 m and started when the soil wa-ter tension reached 45 kPa. The cover crops were also irrigated in the winter.
Experimental design and soil sampling
The experimental layout consisted of a random-ized block design with split plots. Three management systems were randomly assigned to the plots and the P rates were assigned to the subplots.
The following management systems were studied: 1) a conventional tillage system consisting of plowing and harrowing before planting, with millet (Pennisetum glaucum) as the cover crop (CTml); 2) a no-tillage system with millet coverage (NTml); and 3) no-tillage with vel-vet beans (Mucuna aterrima) as the cover crop (NTmc). Treatments with no P fertilization (P0) and with 100 kg ha−1 yr−1 of P
2O5 as granular triple super phosphate (P1)
were used in the planting furrow.
Soil samples were collected in Mar 2010, during the filling of soybean grain, at depths of 0.0-0.05; 0.05-0.10 and 0.10-0.20 m using an auger that was 0.05 m in diam-eter. One composite sample per plot was collected, which was formed by 20 subsamples (four locations within each plot × five subsamples per location - one on the line and four on the equidistant inter-row spacings). The soil was homogenized and separated for chemical analysis, air-dried and passed through a sieve of 2 mm or 0.5 mm.
Soil samples were collected at the same depths as in the experimental area in an area under native Cerrado vegetation that was close to the experimental plots, and these were used as reference samples. The soil samples were collected from 20 random points in two different places.
Organic carbon and fractionation of organic matter
Organic carbon (OC) was determined by wet oxida-tion with potassium dichromate (10 mL of 0.167 mol L−1
K2Cr2O7) in sulfuric acid (20 mL H2SO4) without an ex-ternal heat source, followed by titration with 0.4 mol L−1
Fe(NH4)2(SO4)2.6H2O (Walkley and Black, 1934). The var-ious labile fractions were determined by four different methods described below.
•Forparticulateorganiccarbon(POC),theorganicmat-ter was physically fractionated according to Cambardel-la and Elliot (1992). After air-drying, subsamples were sieved through a 2 mm sieve. Twenty grams of each subsample were placed in a 250 mL plastic bottle and 70 mL of sodium hexametaphosphate at a concentra-tion of 5.0 g L−1 was added. The mixture was shaken
for 15 h in a horizontal shaker, at 130 oscillations per min−1. After this process, the entire contents of the vial
were placed in a 53 µm sieve and washed with a weak jet of distilled water. The material retained in the sieve, which consisted of particulate organic carbon (POC > 53 µm) was oven dried at 50 °C to constant weight and then milled in a mortar until it could be passed through a 0.149 mm sieve, for the assessment of the total organic C content of the particulate fraction by dry combustion in a CHNS/O analyzer.
•Forthecarboninthelightfractionoftheorganicmat-ter (CMOL), the carbon content was obtained by separa-tion of the light fracsepara-tion organic matter (LFOM) with 2 mol L−1 phosphoric acid followed by agitation and
cen-trifugation according to Schiavo et al. (2009). The mate-rial retained on the filter after the supernatant had been filtered was the LFOM. Based on the LFOM values, the C content of this fraction was calculated by multiplying the LFOM by 0.58 (Van Bemmelen factor) because, on average, 58 % of the SOM is C (Nelson and Sommers, 1996).
•ForC-KMnO4, the C oxidizable by a solution of KMnO4 0.033 mol L−1 was determined according to Blair et
al. (1995). For this purpose, 1 g of air-dried fine earth (ADFE) sieved with a 0.5 mm mesh was agitated and centrifuged with 25 mL of a solution of 0.033 mol L−1
KMnO4. After centrifugation, 1 mL of the supernatant was pipetted into a 250 mL volumetric flask and made up to volume with distilled water. Absorbance at 565 nm was determined with a spectrophotometer. The change in the concentration of KMnO4, estimated from an analytical curve with known C values, was used to estimate the amount of oxidized C (C-KMnO4), consider-ing that 1.0 mmol of Mn is consumed in the oxidation of 0.75 mmol (9 mg) of C.
adjust-ed to equilibrium at a tension of 0.03 MPa (~80 % of the soil field capacity). These samples were pre-incubated at room temperature (26 ± 2 °C) for 7 days in capped 600 mL containers kept in the dark. Then, three sub-samples were fumigated (F) for 24 h in a drier containing a Petri dish with 25 mL of chloroform without ethanol (CHCl3). The other, non-fumigated (NF), subsamples were kept at room temperature. After fumigation, the F and NF subsamples were shaken on a horizontal shaker (150 rpm) for 30 min with 50 mL of the extraction solu-tion (0.5 M K2SO4). Subsequently, the subsamples were filtered through qualitative filter paper. The MBC was determined according to Vance et al. (1987), using an 8 mL aliquot of the filtered extract and was determined as the difference between the C extracted from the F and NF soil samples using a correction factor (kC) of 0.35 (Joergensen, 1996).
Carbon Management Index (CMI)
The CMI was calculated at the 0-0.10 m soil depth according to the mathematical procedures proposed by Blair et al. (1995) as follows:
CMI = Carbon Pool Index (CPI) × Lability Index (LI) × 100
where CPI is the carbon pool index and LI the lability index.
The CPI and the LI are calculated as follows:
CPI = C pool in treatment / C pool in reference, LI = L in treatment / L in reference.
where L refers to the C lability calculated as: L = content of labile C / content of non-labile C.
The native Cerrado was used as the reference, with the CMI defined as 100. The labile C was consid-ered as the C-KMnO4. The non-labile C content was esti-mated from the difference between the TC and the labile C (Blair et al., 1995).
Statistical analysis
The levels of OC and the different labile fractions were statistically analyzed using the SAS 9.1 software. For analysis of variance, the OC, POC, CMOL, C-KM-nO4 and MBC levels were compared for each soil layer. Where the analysis of variance indicated significance, Tukey’s test (p < 0.05) was used to test for differences between the means.
Results and Discussion
Effect of management systems on soil organic carbon
The analysis of variance for the OC content indi-cated that only the effect of the management system was significant (Table 1). The management systems reduced the soil organic carbon in relation to the native Cerrado vegetation, especially in CTml, with losses of 37 %, 18
% and 8 %, in the 0.0-0.05; 0.05-0.10 and 0.10-0.20 m layers, respectively (Table 1). A similar finding was ob-tained by Rangel et al. (2008) that reported a decrease in the OC level at the 0.0-0.10 m depth compared to the natural system for all systems of soil uses and manage-ments. However, the NTml was found to be most closely related to the accumulation of OC in the soil of the na-tive Cerrado, demonstrating the potential of this system to produce grain with a reduced impact on the soil car-bon balance. This pattern of behavior of the OC in NT is well established and is caused by the absence of me-chanical incorporation of the crop residue (Figueiredo et al., 2013), followed by a pronounced increase in root growth in the upper layers of the soil, compared to CT (Nunes et al., 2011).
In the layers assessed, the conventional tillage sys-tem resulted in further reductions in the organic carbon level, even when millet was used as the cover crop, due to the more rapid decomposition of the SOM promoted by soil disturbance (Nunes et al., 2011). Furthermore, the results showed that for tropical climatic conditions which favor the rapid decomposition of the crop residue, the transformation of natural vegetation in the agro-eco-systems under conventional tillage promotes a reduction in SOM mainly in the topsoil.
Labile fractions of organic matter affected by soil management systems
The levels of carbon in the labile fractions were affected by the management system and P rates (Figures 1A and B). However, the interaction system × P rate was not significant.
In the 0.0-0.05 m layer, the no-tillage systems showed higher C-KMnO4 contents than CTml, indicat-ing that plowindicat-ing and harrowindicat-ing can reduce crop resi-dues on the soil surface, and have a direct impact on the most easily oxidized SOM fractions. In the 0.05-0.10 and 0.10-0.20 m layers, no differences were evident in C-KMnO4 content between the soil management systems. Of the various fractions analyzed by Plaza-Bonilla et al. (2014), C-KMnO4 presented the greatest difference be-tween management systems, with an increase of 54 % in a no-tillage system compared to conventional tillage. These findings demonstrate that this fraction responds to the management system and is related to the organic Table 1 – Total organic carbon content in different layers of an Oxisol cultivated for 11 years in a corn-soybean succession under different management systems and native Cerrado vegetation as reference.
Depth (m) NT velvet bean NT millet CT millet Cerrado g kg−1
0.0-0.05 20.56 B 22.51 A 16.01 C 25.38
0.05-0.10 16.52 AB 17.94 A 15.71 B 19.11
0.10-0.20 13.22 B 14.23 A 14.49 A 15.76
matter deposited on the surface of the soil as the crop residue, as well as to the greater development of the crop root system in the upper soil layers.
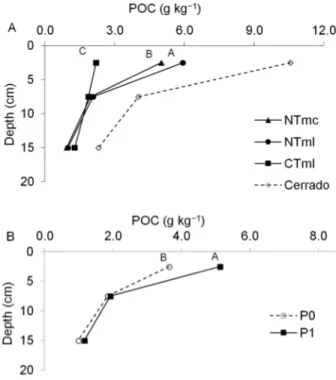
The levels of particulate organic carbon (POC) ranged from 0.94 to 10.56 g kg−1 of soil (Figure 2A);
these levels were close to those found by other authors in studies conducted in Cerrado areas, in clayey and very clayey soils (Figueiredo et al., 2010). The simple effects of soil tillage system and phosphorus rates were significant (p < 0.05) for this parameter.
There was a difference in POC between manage-ment systems and cover crops, but this difference was restricted to the 0.0-0.05 and 0.10-0.20 m layers. In the upper layer, the no-tillage systems had a higher POC con-tent than the CTml, and NTmc was higher than NTml. The highest input of biomass occurred with millet com-pared to velvet bean, and the lesser soil disturbance due to NT explains these differences, stressing the impor-tance of minimal soil disturbance for the accumulation
of C in the particulate fractions of the SOM, which rep-resents the principal substrate that ensures the mineral-ization of nutrients by the soil microbiota (Figure 2A). The presence of C-carbohydrates rather than C-polyphe-nols in the larger fractions (2000-50 mm) indicates the highly labile characteristics of such fractions (Rovira et al., 2010). Moreover, this behavior demonstrates that the variation in POC content depends on the species under cultivation (Loss et al., 2014). Because it is labile (Rovira et al., 2010), this organic matter C fraction can quickly decompose, and constitutes a transient C reserve in the soil.
P application also increased the POC level in the upper layer, even though the soil showed adequate and appropriate P values at the beginning of the experiment (Figure 2B). This is due to higher production of plant biomass by the soybean, corn, millet and velvet bean crops when fertilized with P, as observed by Nunes et al. (2011) in the same experiment. Furthermore, in the area with no phosphorus fertilization, P was exported by the crops during harvest, which reduces the P level in the soil, because P is not replaced, thus reducing the grain yield and the plant biomass input in the soil (Nunes et al., 2011).
Figure 1 − Distribution of oxidizable C by a KMnO4 0.033 mol L−1 (C-KMnO4) solution as a function of soil depth of an Oxisol under different management systems (A) (conventional tillage system with millet – CTml, no-tillage system with millet – NTml, no-tillage system with velvet bean – NTmc and native Cerrado vegetation as reference) and doses of phosphorus (B) (P0 and P1: 0 and 100 kg ha−1 yr−1 of P
2O5, respectively). Means with equal letters between systems and P doses at the same depth do not differ by Tukey´s test (p < 0.05).
Figure 2 − Distribution of particulate organic carbon (POC) as a function of soil depth of an Oxisol under different management systems (A) (conventional tillage system with millet – CTml, no-tillage system with millet – NTml, no-no-tillage system with velvet bean – NTmc and native Cerrado vegetation as reference) and doses of phosphorus (B) (P0 and P1: 0 and 100 kg ha−1 yr−1 of P
In the 0.0-0.05 m layer, CMOL levels were ranked as follows: NTml > NTmc = CTml, which indicates that this fraction has a relatively short cycle and is very sensitive to changes due to soil management practices (Tirol-Padre and Ladha, 2004) particularly in the upper soil layers. Deme-trio et al. (1998) observed that the effect of incorporating residues in the soil on the C content is significant for the CMOL fraction, and the speed and degree of transforma-tion of the CMOL fractransforma-tion depend on its chemical charac-teristics when the other factors remain constant.
In the 0.05-0.10 m layer, in turn, the CMOL frac-tion was not affected by the different management sys-tems. As shown for the C-KMnO4 and POC fractions, CMOL is probably associated with a greater amount of crop residue deposited on the soil surface by millet, which has greater accumulation under a no-tillage sys-tem (Nunes et al., 2011).
In contrast, in the 0.10-0.20 m layer, the CTml pre-sented a higher CMOL content than the no-tillage sys-tems, demonstrating the effect of incorporation of the organic residue via plowing. The P dosage had no effect on the CMOL content.
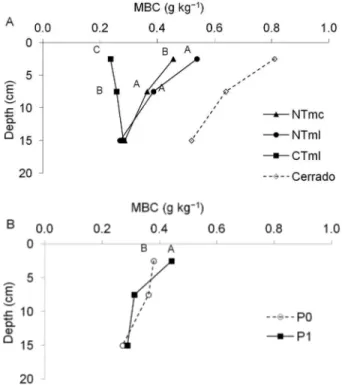
In addition to reducing the level of organic carbon (Table 1), the replacement of the native Cerrado vegeta-tion by agricultural producvegeta-tion also reduced the level of the labile SOM fractions. However, the adoption of the NTml in the Cerrado area increased the level of the CMOL fraction by 64 % in the 0.0-0.05 m layer compared to CTml (Figure 3), demonstrating that millet associated with corn-soybean succession, regardless of the P rate, fa-vored the accumulation of CMOL in the upper soil layers. Under the no-tillage system, the MBC levels were higher than in the CT in the two uppermost soil layers, and no differences were observed between the manage-ment systems in the 0.10-0.20 m layer. For cover crops under NTml, the MBC values were higher than with vel-vet bean in the 0.0-0.05 m layer, indicating that grass as
a cover crop provided a greater amount of soil surface residue, favoring an environment more suitable for mi-crobial activity (Figure 4A).
In general, conservational management systems such as NT have higher MBC levels, and this parameter is negatively affected when the soil is disturbed, as ob-served by other authors in Cerrado soils (Figueiredo et al., 2010; Figueiredo et al., 2013). Additionally, higher aeration and organic residue incorporation due to soil disturbance, such as occurred in the CT, can at first in-crease the MBC level but over time, the rapid decompo-sition of the litter can have a detrimental effect on the microbial population (Nunes et al., 2011).
Although restricted to the 0.0-0.05 m layer, P application increased the MBC content because of the higher availability of labile SOM, which is the primary energy source for the microorganisms (Figure 4B).
POC and MBC were the fractions most affected (reduced) in the upper soil layer by using a native vegeta-tion area for agricultural purposes, with losses of 71 % and 73 %, respectively, under CTml (Figures 2A and 4A). According to Lopes et al. (2013), in the Cerrado region, the MBC levels in soils cultivated with grain are low, even under the best management practices.
Figure 3 − Distribution of light organic matter carbon as a function of soil depth of an Oxisol under different management systems (conventional tillage system with millet – CTml, no-tillage system with millet – NTml, no-tillage system with velvet bean – NTmc and native Cerrado vegetation as reference). Means with equal letters between systems at the same depth do not differ by Tukey’s test (p < 0.05).
Figure 4 − Distribution of microbial biomass carbon (MBC) as a function of soil depth of an Oxisol under different management systems (A) (conventional tillage system with millet – CTml, no-tillage system with millet – NTml, no-no-tillage system with velvet bean – NTmc and native Cerrado vegetation as reference) and doses of phosphorus (B) (P0 and P1: 0 and 100 kg ha−1 yr−1 of P
Relationships between labile fractions of soil organic carbon
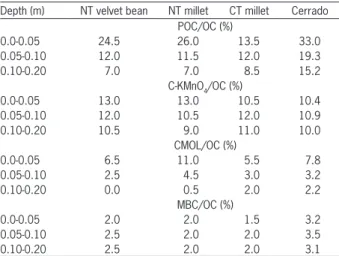
The percentages of the different labile fractions with respect to organic carbon were very different, ranging from 0 to 33 % (Table 2). The POC represent-ed, on average, the highest percentage (14 %) of the OC because of the nature of the particle size analysis used to determine this fraction. In this case, the soil was completely dispersed by a treatment with a dispersing agent (hexametaphosphate) and mechanical agitation, to prevent aggregates from remaining intact in the coarser fractions, which allowed for the determination of the en-tire particulate organic matter inside and between the soil aggregates (Roscoe and Buurman, 2003).
The CMOL accounted for approximately 4 % of the OC and 30 % of the POC. This fraction represents the free OC in the soil, deposited on the surface of the aggregates, and is the most easily accessible fraction for microorganisms with a short residence time in the soil that ranges from 1 to 5 years (Janzen et al., 1992).
Owing to the good relationship between the POC and CMOL fractions (Table 3) it can be inferred that the CMOL represents the portion of the POC outside of the soil aggregates. Moreover, in the present study, because CMOL represented only 30 % of the POC, most of the particulate organic matter in this Oxisol is, supposedly, inside soil aggregates.
The labile fraction with the lowest value and per-centage was the MBC, which on average was 2 % of the OC. This fraction is extremely sensitive and considered the active fraction of SOM (Costa et al., 2013). Studies indicate, on a scale of decreasing sensitivity, that the mi-crobial soil biomass was highly variable and sensitive and was the active compartment of the organic carbon
dynamics, followed by light organic matter which had an intermediate sensitivity (Rovira et al., 2010).
All of the labile fractions obtained by the different methods had positive and significant correlations, with r-values above 0.68. Wendling et al. (2008) also found positive correlations between the POC and C-KMnO4 fractions.
The fraction that best correlated with the POC was C-KMnO4 (r = 0.90). The lowest correlation between la-bile carbon fractions occurred in the MBC fraction. This fraction is composed of a very limited set of substances and biomolecules compared to plant residue and other constituents of the other soil organic carbon labile frac-tions.
C-KMnO4 was found to be a suitable indicator of the organic carbon labile fraction, given its methodologi-cal facility and sensitivity to the management system and applied P rate.
Carbon Management Index
The carbon management index for all of the man-agement systems was lower than that for the native Cer-rado (reference) (Figure 5). The combination of no-tillage
Figure 5 − Carbon management index at 0-0.10 m soil layer of an Oxisol under different management systems (conventional tillage system with millet – CTml, no-tillage system with millet – NTml, no-tillage system with velvet bean – NTmc and native Cerrado vegetation as reference) and doses of phosphorus (P0 and P1: 0 and 100 kg ha−1 yr−1 of P
2O5, respectively). Means with equal letters do not differ by Tukey’s test (p < 0.05).
Table 2 – Percentages of labile fractions in relation to total organic carbon in different layers of an Oxisol cultivated under different management systems and in Cerrado native vegetation.
Depth (m) NT velvet bean NT millet CT millet Cerrado POC/OC (%)
0.0-0.05 24.5 26.0 13.5 33.0
0.05-0.10 12.0 11.5 12.0 19.3
0.10-0.20 7.0 7.0 8.5 15.2
C-KMnO4/OC (%)
0.0-0.05 13.0 13.0 10.5 10.4
0.05-0.10 12.0 10.5 12.0 10.9
0.10-0.20 10.5 9.0 11.0 10.0
CMOL/OC (%)
0.0-0.05 6.5 11.0 5.5 7.8
0.05-0.10 2.5 4.5 3.0 3.2
0.10-0.20 0.0 0.5 2.0 2.2
MBC/OC (%)
0.0-0.05 2.0 2.0 1.5 3.2
0.05-0.10 2.5 2.0 2.0 3.5
0.10-0.20 2.5 2.0 2.0 3.1
CT: conventional tillage system; NT: no-tillage system. OC: total organic carbon; POC: particulate organic carbon; C-KMnO4: oxidizable C by solution of KMnO4 0.033 mol L−1; CMOL: light organic matter carbon; MBC: microbial biomass carbon
Table 3 – Pearson correlation coefficients between labile fractions of soil organic carbon at the 0.0-0.20 m depths (weighted average of the assessed layers), regardless of the system and P application rate.
OC C-KMnO4 CMOL MBC POC
OC 1.00
C-KMnO4 0.91*** 1.00
CMOL 0.86*** 0.80*** 1.00
MBC 0.79*** 0.74*** 0.68*** 1.00
POC 0.92*** 0.90*** 0.87*** 0.77*** 1.00
with P fertilizer, regardless of the cover crop, promoted a higher CMI than the conventional system without P ap-plication. While the CTml P0 treatment was 40 % lower than the CMI, the NTml P1 treatment had CMI values close to those of the native Cerrado. These results indi-cate that CT decreased not only the OC level but also the quality of the SOM, mainly with regard to its lability. In addition, these results demonstrate the higher capacity of the no-tillage system associated with P fertilization to preserve and enhance the quality of the soil organic matter.
The results confirm the utility of the CMI as a tool to evaluate soil quality as affected by management systems in the Cerrado. Vieira et al. (2007) found a positive rela-tionship between the CMI and the physical, chemical and biological indicators of soil quality. Increases in CMI were also obtained in other studies as a result of practices such as the addition of organic matter via compost and sludge (Nogueirol et al., 2014), legume-based cropping systems and the addition of mineral N (Vieira et al., 2007), and green cane trash management (Blair et al., 1995).
Conclusions
The labile fractions were found to be sensitive to soil management practices, and the lowest levels of these parameters were observed under a conventional tillage system. The primary changes occurred in the surface soil layer (0.0-0.05 m), where in general the use of a no-tillage system with millet as the cover crop showed the highest carbon values in the studied fractions. P fertil-ization for eleven years did not change the total organic carbon, but promoted the accumulation of C-KMnO4, particulate organic carbon and microbial biomass car-bon in the soil, regardless of soil management system and cover crop. A positive correlation was observed be-tween the various labile fractions, as well as bebe-tween these fractions and the total organic carbon in the soil. P fertilizer application improved the capacity of the no-tillage system to promote soil quality, as assessed by the carbon management index. Our results confirm that the carbon management index is an appropriate and sensi-tive parameter for the assessment of changes promoted by soil management systems in the Cerrado.
References
Aguiar, A.C.F.; Cândido, C.S.; Carvalho, C.S.; Monroe, P.H.M.; Moura, E.G. 2013. Organic matter fraction and pools of phosphorus as indicators of the impact of land use in the Amazonian periphery. Ecological Indicators 30: 158-164. Alvares, C.A.; Stape, J.L.; Sentelhas, P.C.; Gonçalves, J.L.M.;
Sparovek, G. 2013. Koppen's climate classification map for Brazil. Meteorologische Zeitschrift 22: 711-728.
Blair, G.J.; Lefroy, R.D.B.; Lisle, L. 1995. Soil carbon fractions based on their degree of oxidation, and the development of a carbon management index for agricultural systems. Australian Journal of Agricultural Research 46: 1459-1466.
Cambardella, C.A.; Elliott, E.T. 1992. Particulate soil organic matter changes across a grassland cultivation sequence. Soil Science Society of America Journal 56: 777-783.
Campos, B.H.C.; Amado, T.J.C.; Bayer, C.; Nicoloso, R.S.; Fiorin, J.E. 2011. Carbon stock and its compartments in a subtropical oxisol under long-term tillage and crop rotation systems. Revista Brasileira de Ciência do Solo 35: 805-817.
Costa, A.R.; Sato, J.H.; Ramos, M.L.G.; Figueiredo, C.C.; Souza, G.P.; Rocha, O.C.; Guerra, A.F. 2013. Microbiological properties and oxidizable organic carbon fractions of an oxisol under coffee with split phosphorus applications and irrigation regime. Revista Brasileira de Ciência do Solo 37: 55-65. Figueiredo, C.C.; Resck, D.V.S.; Carneiro, M.A. 2010. Labile
and stable fractions of soil organic matter under management systems and native cerrado. Revista Brasileira de Ciência do Solo 34: 907-916.
Figueiredo, C.C.; Resck, D.V.S.; Carneiro, M.A.; Ramos, M.L.G.; Sá, J.C.M. 2013. Stratification ratio of organic matter pools influenced by management systems in a weathered Oxisol from a tropical agro-ecoregion in Brazil. Soil Research 51: 133-141. Haynes, R.J. 2005. Labile organic matter fractions as central
components of the quality of agricultural soils: an overview. Advances in Agronomy 85: 221-268.
Janzen, H.H.; Campbell, C.A.; Brandt, S.A.; Lafond, G.P.; Townleysmith, L. 1992. Light-fraction organic matter in soils from long-term crop rotations. Soil Science Society of America Journal 56: 1799-1806.
Joergensen, R.G. 1996. The fumigation-extraction method to estimate soil microbial biomass: calibration of the kec value. Soil Biology and Biochemistry 28: 25-31.
Li, Z.; Zhao, B.; Wang, Q.; Cao, X.; Zhang, J. 2015. Differences in chemical composition of soil organic carbon resulting from long-term fertilization strategies. Plos One 10: 1-14.
Loss, A.; Pereira, M.G.; Costa, E.M.; Beutler, S.J. 2014. Soil fertility, physical and chemical organic matter fractions, natural
13C and 15N abundance in biogenic and physicogenic aggregates
in areas under different land use systems. Soil Research 52: 685-697.
Lopes, A.A.C.; Sousa, D.J.M.; Chaer, G.M.; Reis Junior, F.B.; Goedert, W.J.; Mendes, I.C. 2013. Interpretation of microbial soil indicators as a function of crop yield and organic carbon. Soil Science Society of America Journal 77: 461-472.
Nelson, D.W.; Sommers, L.E. 1996. Total carbon, organic carbon, and organic matter. p. 961-1010. In: Black, C.A., ed. Methods of soil analysis. Part 3. Chemical methods. Soil Science Society of America, Madison, WI, USA.
Nogueirol, R.C.; Cerri, C.E.P.; Da Silva, W.T.L.; Alleoni, L.R.F. 2014. Effect of no-tillage and amendments on carbon lability in tropical soils. Soil and Tillage Research 143: 67-76.
Nunes, R.S.; Lopes, A.A.C.; Sousa, D.M.G.; Mendes, I.C. 2011. Management systems and the carbon and nitrogen stocks of cerrado oxisol under soybean-maize succession. Revista Brasileira de Ciência do Solo 35: 1407-1419 (in Portuguese, with abstract in English).
Rangel, O.J.P.; Silva, C.A.; Guimarães, P.T.G.; Guilhermes, L.R.G. 2008. Oxidizable organic carbon fractions in a latosol cultivated with coffee at different planting spacings. Ciência e Agrotecnologia 32: 429-437 (in Portuguese, with abstract in English).
Roscoe, R.; Buurman, P. 2003. Tillage effects on soil organic matter dynamics in density fractions of a cerrado Oxisol. Soil and Tillage Research 70: 107-119.
Rovira, P.; Jorba, M.; Romanyà, J. 2010. Active and passive organic matter fractions in Mediterranean forest soils. Biology and Fertility of Soils 46: 355-369.
Schiavo, J.A.; Busato, J.G.; Martins, M.A.; Canellas, L.P. 2009.
Recovery of degraded areas revegetated with Acacia mangium
and Eucalyptus with special reference to organic matter humification. Scientia Agricola 66: 353-360.
Soil Survey Staff. 2006. Keys to Soil Taxonomy. USDA-SCS, Washington, DC, USA.
Sousa, D.M.G.; Lobato, E. 2004. Cerrado: Soil Correction and Fertilization = Cerrado: Correção do Solo e Adubação. 2ed. Embrapa Cerrados, Planaltina, DF, Brazil (in Portuguese). Tirol-Padre, A.; Ladha, K.J. 2004. Assessing the reliability of
permanganate-oxidizable carbon as an index of soil labile carbon. Soil Science Society of America Journal 68: 969-978.
Vance, E.D.; Brookes, P.C.; Jenkinson, D.S. 1987. An extraction method for measuring soil microbial biomass carbon. Soil Biology and Biochemistry 19: 703-707.
Vieira, F.C.B.; Bayer, C.; Zanatta, J.A.; Dieckow, J.; Mielniczuk, J.; He, Z.L. 2007. Carbon management index based on physical fractionation of soil organic matter in an Acrisol under long-term no-till cropping systems. Soil and Tillage Research 96: 195-204.
von Lützow, M.; Kögel-Knabner, I.; Ekschmitt, K.; Flessa, H.; Guggenberger, G.; Matzner, E.; Marschner, B. 2007. SOM fractionation methods: relevance to functional pools and to stabilization mechanisms. Soil Biology and Biochemistry 39: 2183-2207.
Walkley, A.; Black, J.A. 1934. An examination of the degtjareff method for determining soil organic matter and a proposed modification of the chromic titration method. Soil Science 37: 29-38.