1 Recebido em 10.09.2008 e aceito para publicação em 25.08.2010.
2 Curso de Engenharia Florestal, UFT, Gurupi, TO. E-mail: <vclandrade@hotmail.com>. 3 Universidade Federal de Viçosa, UFV, Brasil. E-mail: <hgleite@ufv.br>.
HIPSOMETRIC RELATIONSHIP MODELING USING DATA SAMPLED IN
TREE SCALING AND INVENTORY PLOTS
1Valdir Carlos Lima de Andrade2 e Helio Garcia Leite3
MODELAGEM DA RELAÇÃO HIPSOMÉTRICA EMPREGANDO DADOS
AMOSTRADOS NA CUBAGEM DE ÁRVORES E EM PARCELAS DE
INVENTÁRIO
1. INTRODUCTION
Forest inventories are traditionally conducted by measuring the total height (h) of only some trees in
each plot, a method proposed by Ker and Smith (1957), according to Batista et al. (2001). Height of the remaining trees is estimated by hipsometric equations generally generated by means of regression analysis relating
h only to the diameter measured at 1.3 meters from
the site (d1,3), as shown in some examples found in
Sadiq and Smith (1983), Arabatzis and Burkhart (1992), Zakrzewski and Ter-Mikaelian (1994), Garcia (1998) and Batista et al. (2001).
Several other functional forms of hipsometric equations are mentioned in specialized literature, which, according to some examples found in Curtis (1967), Campos (1979), Lopes et al. (1998), Knowe (1994), Nigh
ABSTRACT – This work evaluated eight hypsometric models to represent tree height-diameter relationship, using data obtained from the scaling of 118 trees and 25 inventory plots. Residue graphic analysis and percent deviation mean criteria, qui-square test precision, residual standard error between real and estimated heights and the graybill f test were adopted. The identity of the hypsometric models was also verified by applying the F(Ho) test on the plot data grouped to the scaling data. It was concluded that better accuracy can be obtained by using the model prodan, with h and d1,3 data measured in 10 trees by plots grouped into these scaling data measurements of even-aged forest stands.
Keywords: Forest Bio-Statistics, Model Identity and Regression Analysis.
RESUMO – Neste trabalho foram avaliados oito modelos hipsométricos para representar a relação altura-diâmetro, empregando-se dados obtidos na cubagem de 118 árvores e 25 parcelas de inventário. Na avaliação da relação hipsométrica, adotaram-se a análise gráfica de resíduos e os critérios da média dos desvios percentuais, precisão obtida pelo teste de qui-quadrado, erro-padrão residual entre altura real e estimada e o teste f de graybill. Verificou-se, também, a identidade de modelos hipsométricos aplicando o teste aos dados das parcelas agrupados aos dados da cubagem. Concluiu-se que é obtida melhor acurácia ao utilizar o modelo de prodan, tendo os dados de h e d1,3 medidos em 10 árvores por parcela agrupados a esses dados medidos na cubagem de povoamentos florestais equiâneos.
and Love (1999), Jayaramam and Lappi (2001) and Eerikainen (2003), include total height and diameter of the dominant trees, site index, age and mean quadratic diameter as independent variables.
Recently, Batista et al. (2001) applied scaling data to analyze the behavior of some hipsometric models in an uneven-aged forest formation, constituted by
Tabebuia cassinoides caixetais). However, for practical
purposes, the behavior of equations must be analyzed when applied in forest inventory plots.
Modeling the hypsometric relation using only the information obtained from some inventory plot trees is justifiable since, in general, scaling is performed through selective procedure of tree sampling and inventory is performed by means of casual or systematic sampling. Thus, it is fair to state that the h and d1,3
pairs obtained from the plots are more representative for inventory purposes. In this case, the variable h
is obtained by using some type of hypsometer; therefore, measuring errors certainly will occur.
On the other hand, information on h obtained scaled
trees is non-sampling error-free since the measurement is made after the trees are felled, using a tapeline; therefore, this is the exact information of h. Consequently, the
following questions arise:
a) In order to estimate the hypsometric equations, can the grouping of the h and d1,3 data obtained in scaling and inventory plots be preferable to using the h and d1,3 data obtained only in the plots?
b) Using the grouping of h and d1,3 data obtained
in scaling and in the plots, is it possible to reduce the number of trees in which h must be measured by
plot without compromising the accuracy in estimating
h in the inventory plot trees ?
The aim of this study is to find the answers to these questions.
2. MATERIAL AND METHODS
Data on h and d1,3 were obtained by scaling
188 felled trees and by measuring the first 20 trees of 25 plots of a continuous forest inventory conducted in a 6-year-old eucalypt stand. These data were used to estimate the hipsometric equations shown in Table 1, which, according to Curtis (1967), refer to the Henricksen (hk), Mishailof (mf), Stofell and Van Soest (svs), prodan (pn) and Staebler (sr)
models, besides the curtis (cs) model, the straight line model (ra) and logarithmization of a model presented in Curtis (ha).
To evaluate the hypsometric models presented in Table 1, residue analysis was performed by means of graphics and the following statistical criteria:
and
where:
PDM = percent deviation means;
yiand yi = estimated and observed total height
value;
n= number of pairs of yi and yi;
yi = Observed h mean;
S(yi yi ) = Residual standard error between yi and yi;
P = exactness obtained by the Qui-square test (Freese, 1960); and
Xn2= Qui-square plotted for n freedom degrees
at 95% probability.
The statistical criteria above were used to classify the models by attributing weight 1 to the best model, weight 2 to the model ranked second and successively up to the last evaluated model. The final result was grouped in the weighted mean generating a mean percent (MP %) obtained by:
The three best models selected were fitted by using the h and d1,3 data obtained from the five and ten first
trees in each of the 25 plots, respectively designated
100 ) ( 1
1 ^
å
= -=
n
i i
i i
y y y n PDM
100 2
) (
) (
1 2 ^
^
y n
y y
y y S
n
i i i
i i
-± =
-å
=å
= -±
=
n
i i
i i
n y
y y P
1
2 ^
2 2
) ( 196
c
^
^
^ ^
å
å
=
(
*
)
/
(
)
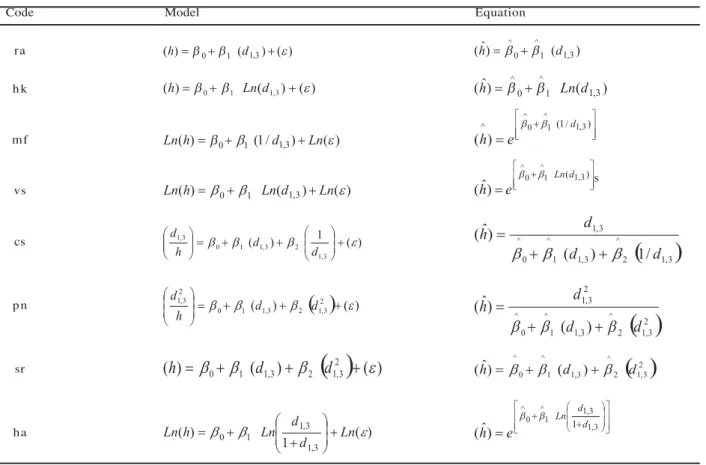
Table 1 – Hypsometric models evaluated by using the h and d1,3 data sampled in the first 20 trees of 25 plots of a continuous forest inventory; where: βi = regression parameters to be estimated, ε = model error, Ln = Neperian logarithm, e = exponential.
Tabela 1 – Modelos hipsométricos avaliados empregando-se os dados de h e d1,3 amostrados em 20 primeiras árvores de 25 parcelas de um inventário florestal contínuo, em que βi = parâmetros de regressão a estimar, = erro do modelo, Ln = logaritmo neperiano e = inverso de Ln.
Code Model Equation
ra h k mf s vs cs p n sr ha ) ( ) ( )
(h =b0+b1 d1,3 + e (ˆ) 1 ( 1,3)
^ 0 ^
d h =b +b )
( ) ( )
(h =b0+b1 Lnd1,3 + e (ˆ) 1 ( 1,3) ^
0 ^
d Ln h =b +b
) ( ) / 1 ( )
(h b0 b1 d1,3 Lne
Ln = + + ú
ú û ù ê ê ë é + = ) / 1 (
^ 1 1,3
^ 0 ^ ) ( d e h b b ) ( ) ( )
(h b0 b1 Lnd1,3 Lne
Ln = + +
( )
( ) ) ( 2 3 , 1 2 3 , 1 1 0 2 3 ,1 =b +b +b + e
÷ ÷ ø ö ç ç è æ d d h d
( )
2 3 , 1 2 ^ 3 , 1 1 ^ 0 ^ 2 3 , 1)
(
)
ˆ
(
d
d
d
h
b
b
b
+
+
=
( )
(
)
)
(
)
(
h
=
b
0+
b
1d
1,3+
b
2d
12,3+
e
( )
2 3 , 1 2 ^ 3 , 1 1 ^ 0 ^ ) ( ) ˆ
(h =b +b d +b d
) ( 1 ) ( 3 , 1 3 , 1 1
0 b e
b Ln
d d Ln h
Ln ÷÷+
ø ö ç ç è æ + + = ú ú û ù ê ê ë é ÷ ÷ ø ö ç ç è æ + +
= 1,3
3 , 1 1 ^ 0 ^ 1 ) ˆ ( d d Ln e h b b ú ú û ù ê ê ë é + = ) ( 1,3 1 ^ 0 ^ ) ˆ ( d Ln e h b b
5 tree-sampling and 10 tree-sampling. The FHotest with
Dummy variables was adopted (Leite and Andrade, 2003), to analyze the use of the h and d1,3 of data obtained in these samplings grouped to the 188 tree scaling data as well as per diameter class. The statistics FHo
was obtained by means of:
where:
---= sum of the squares of the parameters of the complete model;
--- = sum of the squares of the parameters of the reduced model;
---= sum of the squares of the complete model residue;
H = number of compared models;
P = number of parameters of the reduced model;
and
N = total number of observations considering the
H models and α=0.01.
The FHo test was applied to evaluate the following
hypotheses:
1) A hypsometric equation such as h = f(d1,3) must
be estimated using the h and d1,3 data measured in
the plots of a forest inventory grouped to the h and
d1,3 data measured in the scaling.
( ) 1 ) ( Re ) 1 ( ) ( Re ) ( Re -ú û ù ê ë é -ú û ù ê ë é -= Hp N s SQ p H w g SQ g SQ
FHo
W
W
) ( RegW SQ
) (
Regw
SQ
) (
Res W
SQ ) ( 1 ) ( 3 , 1 2 3 , 1 1 0 3 ,
1 b b b + e
÷ ÷ ø ö ç ç è æ + + = ÷÷ ø ö çç è æ d d h d
(
1,3)
2 ^ 3 , 1 1 ^ 0 ^ 3 , 1 / 1 ) ( ) ˆ ( d d d h
b
b
b
+ +2) A hypsometric equation such as h=f(d1,3) must
not be estimated using the h and d1,3 data separated
by diameter class.
To decide the best model, following the F(Ho) test
analysis, the F test of Graybill was applied according to procedure by Guimarães (1994), However, when significance of this test occurred, an equation was considered ideal when a PDM lower than 1% and correlation coefficient ( ryy) higher than 85% were obtained.
3. RESULTS AND DISCUSSION
The statistics obtained after fitting the hypsometric evaluated models are presented in Table 2, along with the mean percent (MP) and the fitted coefficient of determination ( ).
Based on the analysis of the MP statistics and residue graphics, the models referring to the equations that ranked up to third, i.e., sr, cs, hk and pn, respectively, were selected for representing the lowest MP statistic values and the best residue distribution.
To choose the best hypsometric model, a complementary analysis on the biological behavior was carried out using data from the 25 plots (Figure 1). The sr model was not found to be adequate for use in trees with d1,3 higher than 35 cm, approximately, since after this diameter, tree height estimate tends to decrease and a positive horizontal asymptote tends to stabilize as expected, as observed in models mf and ha.
Models hk and pn must not be used in trees with
d1,3 smaller than 4 cm, approximately, since the estimated
tree height results in a negative value and what is rather
expected is the behavior described for the models mf and ha, which is biologically compatible with reality, since tree height is characterized with a sigmoid curve. In contrast, model svs behavior tends to be inadequate as tree diameter increases similarly to model ra. Finally, models cs, pn and hk were found to be biologically adequate in relation to the expected tree height behavior as diameter increases.
Considering the biological interpretation (Figure 1), the behavior of models mf and ha prove to be important when considered for tree height estimation, since they present a sigmoid curve; however, the height dispersion observed around that curve shows a strong tendency to underestimate the height of trees with a diameter over 19 cm and overestimates the height of trees with diameters under 11 cm, approximately. This tendency is also observed in the other hypsometric models but with better behavior for models cs, pn and hk.
^
2
R
Table 2 – Statistics obtained after fitting the evaluated hypsometric models, using the h and d1,3 data obtained from the first 20 trees of 25 plots, n = 487.
Tabela 2 – Estatísticas obtidas após o ajuste dos modelos hipsométricos avaliados, empregando-se os dados de h e d1,3 obtidos em 20 primeiras árvores de 25 parcelas, n = 487.
Model Estimated parameters (%) MP (%)
β0 β1 β2
ra 8.62780 0.86350 78.2 9.5
h k -9.94700 11.82230 78.9 8.5
mf 3.57092 -7.09520 78.4 10.2
svs 1.46034 0.59717 79.8 8.8
cs 0.44375 0.01782 -0.32668 60.8 8.5
p n -0.84154 0.5213 0.01513 94.2 8.6
sr 4.54465 1.45636 -0.01995 79.1 7.1
ha 3.59860 7.77491 78.8 10.3
^ ^ ^
2
R
Figure 1 – Residue distribution and tendency of the hypsometric curves obtained for the 8 evaluated models. Figura 1 – Distribuição de resíduos e tendência das curvas
Models must not be used since, biologically, tree height behavior is not a straight line, while model sr must not be used since it results in great errors for trees with larger diameters, imposing a greater influence on the bias of a forest inventory than errors in smaller diameters, as is the case of models hk and pn.
Models mf and ha were excluded because they presented the same problem model sr did when estimating trees with larger diameters, though being biologically compatible. Thus, to decide for the three best hypsometric models, it was necessary to adopt the criterion of mean percent obtained per diameter class, defined as: class 1 for d1,3 < = 11 cm, class 2 for 11 cm < d1,3 <= 19 cm
and class 3 for d1,3 > 19 cm. The results obtained are shown in Table 3.
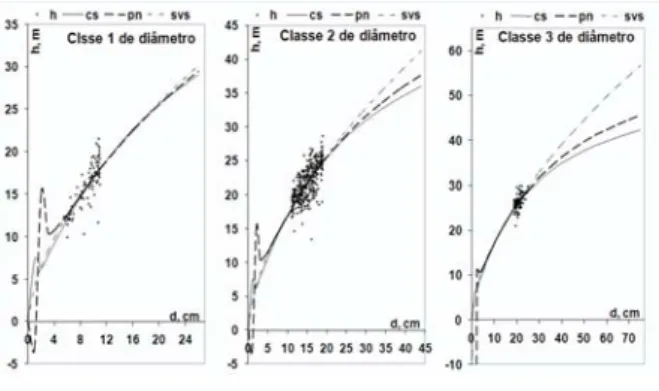
The results presented in Table 3 show that the three best models are cs, svs and pn, respectively. Figure 2 presents residue distribution and curve tendency for these three models. Models cs and pn are not recommended to be used in trees with d1,3 < 4 cm, approximately, for diameter classes 1 and 2, while in class 3, only model pn was found to have this problem. The three models presented the same residue dispersion around their curve.
Following the selection of models pn, cs and svs, their fitting was analyzed by using the h and d1,3 data
obtained in the 5 tree-sampling and 10 tree-sampling plus the 188 tree scaling data. The result obtained by applying the test was non-significance in all the models at 5% probability; thus it allowed hypothesis 1 to be accepted, It can be inferred at 95% probability that it is possible to estimate a single hypsometric equation by applying the h and d1,3 data measured in the inventory
plots grouped to the h and d1,3 data measured in the
scaling.
The hypsometric equation estimation using the h
and d1,3 data obtained in the plots and scaling also needed
to be verified as well as whether it must be carried out
separately per diameter class or by using all the classes containing the h and d1,3 data in a single plot. In this
case, by applying the FHo test, significance was obtained
in all the models at 5% probability, leading to the rejection of hypothesis 2. This allows inference, at 95% probability, that a hypsometric equation must be estimated by using the h an d1,3 data measured in the plots and in the scaling
separately, per diameter class. The statistics obtained in this fitting are presented in Table 4.
Using the estimates presented in Table 4, models cs, pn and svs were evaluated by applying the equations generated from different data of the 10 trees selected in the 25 plots. The results are presented in Table 5, showing that the 5 tree-sampling is not adequate for the use of models pn and svs, since the F(H0) test
was significant with a high PDM value. In the other hypsometric relationship samplings, the three selected models were found to be adequate F(H0)
ns.
Compared to the 5 sampling , the 10 tree-sampling plus the scaling data proved to be the most adequate to replace the 20 tree-sampling, since it resulted in dispersion closest to the 20 tree- sampling (Figure 3).
Table 3 – Mean percentile obtained for the evaluated hypsometric models, separately, per diameter class using the h and
d1,3 data obtained in the 20 first trees of 25 plots where: 1 = first place, 2 = second place and 3 = third place. Tabela 3 – Percentual médio obtido dos modelos hipsométricos avaliados, separadamente, por classe de diâmetro utilizando os dados de h e d1,3 obtidos em 20 primeiras árvores de 25 parcelas, em que 1 = primeiro lugar, 2 = segundo
lugar e 3 = terceiro lugar.
Model
s r c s h k pn ra m f svs h a
MP (%)= 8.1 5.2 8.5 7.7 9.9 8.7 5.9 8.9
1 3 2
Figure 2 – Residue distribution and tendency of the hypsometric curves obtained for the three models selected per diameter class.
Thus, the number of trees to have h and d1,3 measured
in the plots of an inventory to group them into the
h and d1,3 data measured in the scaling separately from
the diameter class, is reduced by 50%.
Considering that the 10 tree-sampling grouped to the scaling data was the one closest to the 20 tree-sampling (Figure 3), selection of the best model was focused on that sampling. Since model pn presented
Table 4 – Statistics obtained after fitting the three selected models by using the plot and scaling data separated by diameter class. Tabela 4 – Estatísticas obtidas após o ajuste dos três modelos selecionados, empregando-se os dados de parcelas e de
cubagem separados por classe de diâmetro.
Model β0 β1 β2 Class
5 tree-sampling per plot and scaling
cs 0.16729 0.03354 0.81262 1
0.31794 0.02638 -0.38461 2
3.50183 -0.05881 -30.53850 3
p n 0.511065 0.24127 0.02916 1
-1.90080 0.52730 0.01932 2
-32.13620 3.64900 -0.06217 3
svs 1.27569 0.68216 1
2.00965 0.39662 2
0.68724 0.84653 3
10 tree-sampling per plot and scaling
cs 0.22673 0.02975 0.57024 1
0.87417 0.00602 -4.00462 2
4.58940 -0.08334 -42.59260 3
p n 0.32267 0.28752 0.02616 1
-5.24696 1.04395 0.00035 2
-43.46020 4.66983 -0.08519 3
svs 1.27995 0.68177 1
1.80418 0.47086 2
0.90136 0.77736 3
^ ^
^
Table 5 – Statistics obtained for the tests to apply the equations generated by fitting the three selected hypsometric models. Tabela 5 – Estatísticas obtidas pelo teste de aplicação das equações geradas pelo ajuste dos três modelos hipsométricos
selecionados.
Model PDM(%) syy(%) P(%) β0 β1 ryy(%) F(H0)
Sampling with 5 trees per plot and scaling
cs -0.15 7.85 15.89 -0.58023 1.03567 87.88 2.1ns
p n -0.16 7.82 15.82 -0.62470 1.03778 88.01 2.2ns
svs 0.23 7.82 15.83 -0.64165 1.03454 87.99 1.0ns
Sampling with 10 trees per plot and scaling
cs -0.41 7.69 15.55 0.03844 1.00937 88.42 2.5ns
p n -0.42 7.68 15.52 0.03036 1.00985 88.45 2.5ns
svs 0.03 7.70 15.59 -0.17432 1.01479 88.40 1.0ns
Sampling with 5 trees per plot
cs 0.14 7.70 15.68 1.16555 0.95099 88.39 1.4ns
p n -4.21 7.85 17.74 -4.35492 1.26312 87.91 69.8*
svs 4.72 7.74 19.09 3.66025 0.79862 88.26 65.7*
Sampling with 10 trees per plot
cs -0.61 7.69 15.58 0.96780 0.96757 88.40 3.3ns
p n -0.65 7.72 15.66 1.12777 0.96076 88.31 3.7ns
svs -0.21 7.72 15.69 1.52552 0.93794 88.33 2.9ns
^ ^
the lowest P and syy statistic value, it was selected
as the most adequate to characterize the hypsometric relation of the study area.
It must be emphasized that although only functional relationships of type h = f(d1,3) were used, this study
can be easily adapted to the application of functional relationships, including other independent variables such as height and diameter of dominant trees, site index, age, etc.., that, hypothetically, may lead to better results in the characterization of the hypsometric relationship of even-aged forest stands.
4. CONCLUSIONS
The hypsometric relationship modeling analyses using h and d1,3 data sampled in the plots and scaling
allowed a conclusion that:
Preference should be given to hypsometric equations using h and d1,3 data sampled in plots grouped
into the scaling sampled data, separately, per diameter class.
Using the 10 tree-sampling to group into scaling data was better than using the 5 tree- sampling to replace the 20 tree-sampling per plot;
Using a data base constituted by h and d1,3
data sampled in the scaling and in the plots of an inventory results in hypsometric equations with good
Figure 3 – Dispersion of the h and d1,3 data obtained by sampling carried out in 25 plots, scaling of 188 felled trees and in the grouping plot data with scaling.
Figura 3 – Dispersão dos dados de h e d1,3 obtidos pela amostragem feita em 25 parcelas, na cubagem de 188 árvores abatidas e no agrupamento dos dados de parcelas com cubagem.
stability and expressive reduction of the number of sample-trees in the plots without hindering the accuracy of the hypsometric curve obtained.
5. REFERENCES
ARABATZIS, A. A.; BURKHART, H. E. An evaluation of sampling methods and model forms for estimating height-diameter relationships in Loblolly Pine plantations. Forest Science, v.38, n.1, p.192-198, 1992.
BATISTA, J. L. F.; COUTO, H. T. Z.;
MARQUESINI, M. Desempenho de modelos de relações hipsométricas: estudo em três tipos de floresta. Scientia Forestalis, n.60,
p.149-163, 2001.
CAMPOS, J. C. C. A growth and yield study in thinned, even-aged stands of
Pinus pátula in Brazil. 1979. 129f. Thesis (Doctor of Philosophy) - University of Washington, Washington, 1979.
CURTIS, R.O. Height-diameter and height-diameter-age equations for second-growth Douglas-fir. Forest Science, v.13, n.4, p.365-375, 1967.
EERIKAINEN, K. Predicting the height-diameter pattern of planted Pinus kesya stands in Zambia
and Zimbabwe. Forest Ecology and Management, v.175, p.355-366, 2003.
FREESE, F. Testing accuracy. Forest Science, v.6, n.2, p.139-145, 1960.
GARCÍA, O. Estimating top height with variable plot size. Canadian Journal of Forest Research, v.28, p.1509-1517, 1998.
GUIMARÃES, D.P. Desenvolvimento de um modelo de distribuição diamétrica de passo invariante para prognose e projeção da estrutura de povoamentos de eucalipto. 1994. 160f. Tese (Doutorado em Ciência Florestal) - Universidade Federal de Viçosa, Viçosa, MG, 1994.
JAYARAMAM, K.; LAPPI, J. Estimation of height-diameter curves through multilevel models with special reference to even-aged teak stands. Forest Ecology and Management, v.142, p.155-162, 2001.
^
P
P
KNOWE, S. A. Effect of competition control treatments on height-age and height-diameter relationships in young Douglas-fir plantations. Forest Ecology and Management, v.67, p.101-111, 1994.
LEITE, H. G.; ANDRADE, V. C. L. Importância das variáveis altura dominante e altura total em equações hipsométricas e volumétricas. Revista Árvores, n.27, p.301-310, 2003.
LOPES, C. R. G. et al. Produção de madeira, carvão e carbono em plantações de Eucalyptus cloeziana.
Revista Árvore, v.22, n.3, p.345-356, 1998.
NIGH, D. G.; LOVE, B. A. A model for estimating juvenile height of lodgepole pine. Forest Ecology and Management, v.123, p.157-166, 1999.
SADIQ, R. A.; SMITH, V. G. Estimation of individual tree volumes with age and diameter. Canadian Journal of Forest Research, v.13, p.32-39, 1983.