MASTER IN FINANCE
THIS REPORT WAS PREPARED EXCLUSIVELY FOR ACADEMIC PURPOSES BY CATARINA BORGES OLIVEIRA AND MARIA INÊS RIBEIRO, MASTER IN FINANCE STUDENTS OF THE NOVA SCHOOL OF BUSINESS AND ECONOMICS.THE REPORT WAS SUPERVISED BY A NOVA SBE FACULTY MEMBER, ACTING IN A MERE ACADEMIC CAPACITY, WHO REVIEWED THE VALUATION METHODOLOGY AND THE FINANCIAL
MODEL.
(PLEASE REFER TO THE DISCLOSURES AND DISCLAIMERS AT END OF THE DOCUMENT)
Page 1/42
§ Netflix’s stellar growth is expected to continue in the following years, mainly fuelled by heavy investments in original content and increasing growth in international segments. By 2028, revenues are expected to more than triple relatively to 2018 (an increase of 241.1%). § As of 2017, the domestic streaming segment made up the majority of total revenues. As the international segment gains importance, we can expect it to represent more than half of total revenues from 2019 onwards, with a share of 66.1% in 2028.
§ The company is expected to invest a total of $11 Billion in streaming content in 2018. The focus will be on original productions, as a way of differentiating itself from competition and attracting more subscribers. This trend is expected to continue in the future. We anticipate Netflix to invest around $21.05 billion in content in 2028. § Nonetheless, competition in the streaming world has been heating up, which may hinder Netflix’s ability to fulfil growth expectations and further subsidize its content strategy.
§ On the other hand, the company is considering introducing a new pricing tier that will most likely improve its growth potential in emerging markets and enhance international revenues.
§ Based on a discounted cash flow valuation, with several scenarios considered, Netflix’s price target for the FY19 corresponds to $361.27, meaning it is trading at a discount of 22.71%. This leads to a final BUY recommendation.
Company description
Founded in 1997, Netflix is the world’s leading Internet entertainment services network. Replacing the linear TV experience, its service allows subscribers to watch entertainment for a flat monthly fee, while being commercial-free. The company operates in over 190 countries and it currently has more than 137 million members worldwide.
N
ETFLIX
C
OMPANY
R
EPORT
ENTERTAINMENT SERVICES 4JANUARY 2019
CATARINA BORGES OLIVEIRA,MARIA INÊS RIBEIRO 23971@novasbe.pt, 23996@novasbe.pt
Recommendation: BUY
Price Target FY19: $361.27
Price (as of
4-Dec-18) $279.22
Reuters: NFLX.OQ, Bloomberg: NFLX US
52-week range ($) 178.38-423.21
Market Cap ($m) 123 621
Outstanding Shares (m) 436.08
Source: Bloomberg
Source: Company Data; Yahoo Finance
(Values in millions) 2017 2018E 2019F Revenues 11693 15837 18333 Revenue Growth 32% 35% 16% Operating Income 838.68 1422.69 1594.96 Operating Margin 7% 9% 9% NOPLAT 816.62 1330.4 1263.3 Paid Memberships 110.64 138.45 158.83 ROIC 18.2% 17.8% 10.6% EPS 1.25 2.39 2.02
Source: Company Data and Valuation Forecasts
Netflix is the New Black
NETFLIX COMPANY REPORT PAGE 2/42
Table of Contents
EXECUTIVE SUMMARY ... 3 COMPANY OVERVIEW ... 4 BUSSINESS MODEL ... 4 COMPANY DESCRIPTION ... 4 PRODUCTS ... 4COMPANY GROWTH EVOLUTION ... 5
COST STRUCTURE,MAIN ASSETS AND LIABILITIES ... 6
CAPITAL STRUCTURE ANALYSIS ... 6
STOCK PERFORMANCE ... 7
THE SECTOR ... 7
THE ENTERTAINMENT AND MEDIA INDUSTRY ... 7
STREAMING VIDEO-ON-DEMAND SEGMENT ... 8
THE DIGITAL CONSUMER ... 8
NETFLIX WITHIN THE INDUSTRY ... 9
NETFLIX WINS THE CROWN ... 9
PRICING ... 10 INCREASING COMPETITION ... 11 INTRINSIC VALUATION ... 11 MEMBERSHIP FORECAST ... 12 PRICING ... 16 REVENUES FORECAST ... 16
CONTENT INVESTMENT & COST OF REVENUES FORECAST ... 16
CONTENT ASSETS ... 17
CONTENT LIABILITIES ... 17
MARKETING FORECAST ... 18
TECHNOLOGY, GENERAL AND OTHER EXPENSES FORECAST ... 18
OPERATING MARGIN ... 18
WACC ... 19
FREE CASH FLOW, ROIC AND TARGET PRICE ... 20
RELATIVE VALUATION ... 20
COMPARABLES ... 20
RELATIVE VALUATION RESULTS ... 21
SENSITIVITY & SCENARIO ANALYSIS ... 21
FINAL RECOMMENDATION ... 21
REFERENCES ... 22
APPENDIXES ... 29
APPENDIX 1 – FINANCIAL STATEMENTS ... 29
APPENDIX 2 – DISCLOSURES AND DISCLAIMERS ... 30
APPENDIX 3 –MARIA INÊS RIBEIRO (23996) ... 33
NETFLIX COMPANY REPORT
PAGE 3/42
Executive summary
The entertainment and media industry is undergoing a rapid transformation, fuelled by the growth of digital segments. As change takes place, the traditional TV experience is progressively being replaced by Streaming Video-On-Demand (SVOD) services. Consumers value the convenience and flexibility offered by digital video platforms, especially if it means having the opportunity to access high-quality content at all times.
With more than 137 million subscribers worldwide, Netflix is the leading player in the streaming market. The company has been experiencing outstanding growth for the past few years, albeit at a decreasing rate. Since 2015, paid streaming memberships have been growing at an average of 6% per quarter.With impressive returns in the past years, Netflix has consistently outperformed the stock market. Netflix’s strategy consists of investing heavily in content, especially in original programming. The company is expected to invest a total of 11 Billion dollars in content in 2018. This gives Netflix a competitive advantage over its competitors, as the company is building an unparalleled catalogue of original titles. Nonetheless, the streaming video landscape is becoming increasingly competitive, with new entertainment alternatives surfacing every year.
So far, the US has represented the majority of Netflix’s revenues; however, the company’s potential lies in the growth of international segments. With the increasing focus on original content, including locally-produced content, the company is expected to increase its revenues from $15.8 Billion in 2018 to $54.0 Billion in 2028.
As the company plans to continue producing content rather than licensing it, streaming content costs are expected to increase, as well as its Marketing budget. Given this, Return on Invested Capital will remain relatively low in the short-term (between 10% and 19% until 2020). However, as Netflix grows its subscriber base, its returns are expected to increase significantly in upcoming years. The company is expected to turn cash flow positive in 2021, when Return on Invested Capital reaches 21.97%and operating margin is approximately 19.22%.
Based on a Discounted Cash Flow valuation, this gives us a base case target price of $401.78 for the Financial Year 2019. Incorporating a bear case which assumes Netflix will lose some of its economic moat to competition, and a bull case which assumes Netflix will increase its penetration in emerging markets if it introduces a new price-tier, Netflix’s expected target price corresponds to $361.27. This represents a finalBUYrecommendation.
3,601 3,824 4,044 4,250 4,436 4,595 4,730 13,403 16,428 19,572 21,175 22,222 23,099 23,883 3,282 3,465 3,647 3,820 3,978 4,113 4,225 0 5000 10000 15000 20000 25000 30000 35000 2016 2017 2018 2019* 2020* 2021* 2022* R eve nu e in m ill io n U .S . d ol la rs
TVoD SVoD EST
Digital Video Revenues Worldwide
Figure 1: Growth of SVOD Revenues Source: Statista, 2018a
Netflix Annual Revenue (2002-2017)
Figure 2: Netflix Annual Revenue (2002-2017)
Source: Statista, 2018a
Figure 4: Forecasted FCF (5,000,000.00) - 5,000,000.00 10,000,000.00 15,000,000.00 20,000,000.00 25,000,000.00 Th ou sa nd d ol la rs
Free Cash Flow Forecast Figure 3: Forecasted Total Revenues
-10,000,000.00 20,000,000.00 30,000,000.00 40,000,000.00 50,000,000.00 60,000,000.00 2017 2018 2019 2020 2021 2022 2023 2024 2025 2026 2027 2028 Th ou sa nd d ol la rs
Total Revenue Forecast
NETFLIX COMPANY REPORT
PAGE 4/42
Company overview
Bussiness Model
Netflix is the world’s leading Internet entertainment services network. It operates in over 190 countries offering more than 140 million hours of TV entertainment per day on nearly any internet-connected screen. Replacing the linear TV experience, the service allows subscribers to play, pause and resume watching while being commercial-free. For a flat no-commitment monthly fee, members can enjoy unlimited viewing of TV series, movies, feature films and documentaries, including originals, anytime and anywhere (Netflix Website, 2018a).
Company description
Netflix started in 1997, in the US, as a DVD-rental-by-mail company with a pay-per-rent model founded by Reed Hastings and Marc Randolph. In 2002 the company becomes public and then in 2007, the company headquartered in Los Gatos, California, introduces streaming of television shows and movies. In 2010, it starts internationalizing, launching services in Canada, and continues expanding in the following years. (Netflix Media Center, 2018). Currently, the Internet entertainment network still offers its DVD rental service in the US and is, as of 2016, a global provider of streaming services.
Pricing options include different tiers so that the customer can select the plan that best fits their needs and the agreements (memberships) kept with customers deliver recurring revenues to the business (Netflix Official Website, 2018b).
Netflix’s main growth/value driver is membership growth – the ability to continue to attract consumers and retain existing ones, making customer base grow, both in the U.S. and in International markets, especially in recent ones.
Products
Netflix’s products include the streaming services provided to both Domestic and International segments and DVD rentals by mail, available only in the United States. Streaming content includes exclusive and non-exclusive licensing agreements for subscription video-on-demand (SVOD) rights from multiple suppliers and original programming, since 2013. Content is more focused on TV shows and movies, including a variety of genres, including kids’ cartoons, and languages. Netflix originals include both content that is exclusive to the company but not produced by it, in which licensing may be agreed before the content is successfully produced; and self-produced originals, which are produced in-house by Netflix and owned by the company.
Revenues Distribution by Segment (2017)
Revenues Domestic Revenues International Revenues DVD
Figure 8: Revenue by Segment (in 2017)
Source: company data
0 20000 40000 60000 80000 100000 120000 0 2000000 4000000 6000000 8000000 10000000 12000000 14000000 2015 2016 2017 Revenues and Memberhsip Evolution (2015 to 2017)
Revenues Memberhsips
Figure 7: Revenue and Membership Evolution (2015 to 2017) 2002 1997 Netflix’s IPO 2007 Launch of Streaming Services Launch in Canada 2010 Launch in Latin America and Caribbean 2011 Launch in UK, Ireland, Nordic countries 2012 Launch in the Netherlands 1stOriginal 2013 2014 Launch in Austria, Belgium, France, Germany, Luxembourg and Switzerland 2015 Launch in Australia, New Zealand, Japan, Italy, Spain, Portugal Netflix available worldwide 2016 2017 First Oscar 2018
Figure 6: Netflix’s Path
Figure 5: Countries where Netflix is available (in red)
NETFLIX COMPANY REPORT
PAGE 5/42 Licensing deals are generally time-based and although the company tries for multi-year exclusive rights this is not always the case. Suppliers include movie studios, TV networks, distributors and sometimes films and TV shows producers. Differences occur between countries in content availability, but Netflix is working to increasingly get licensing deals on a global basis (Netflix Official Website, 2018a). Non-original programmes include deals with BBC (“Sherlock”), Warner Bros. (“Friends”), Twenty First Century Fox (“New Girl”) and ABC (“Modern Family”) (Oaks, 2017).
The entertainment network began the inclusion of original content in 2013 with the series “House of Cards” (Netflix Media Center, 2018) and it was a success. Nominated for 53 Emmy awards so far, the series was awarded 7 times.
Netflix is increasing content spend and this increase is currently more targeted at owned original productions given that they offer more control over content, less reliance on outside studios, and the ability to strengthen brand value (Netflix Letter to shareholders Q3, 2018). Spending on originals is thus rapidly growing in proportion of total spending (Netflix Official Website, 2018a); however, in 2017, licensed programmes still represented more than 90% of the company’s content library (Epstein, 2016).
Company Growth Evolution
The journey of Netflix since it was founded has been of continuous expansion and growth. Since 2002, when the company issued its initial public offering, annual revenues have not stopped growing. Revenues did not rise exponentially after Netflix launched its streaming service; but in 2011, one year after it started internationalizing and after four years of growth in the United States, Netflix saw a growth of approximately 48% in revenues, compared with the previous year. Thereafter, revenues continued to grow at a lower but increasing rate.
Looking into more recent years, paid membership growth for the Domestic Streaming Segment has slowed down (26% growth in 2012 and 10% in 2017), while the growth for the International Streaming Segment continues above 40%. As for the DVD segment, paid memberships have been decreasing at a yearly average rate of 17% (considering the last three years). Currently, the number of paid streaming subscribers worldwide is over 130 million and total revenues amount 3,999.37 million dollars, as of September 2018. Nevertheless, the company has been free-cash-flow negative for a long time and this situation is expected to continue for some years more (Netflix Official Website, 2018b). The gap between net income and free cash flow occurs mainly because of timing differences – cash payments for streaming content are weighted more upfront relative to streaming amortization expenses on the Income Statement (Netflix Official Website, 2018b).
Figure 10: Netflix Annual Revenue (2002-2017)
Source: Statista, 2018a
Netflix Annual Revenue (2002-2017)
0 10000 20000 30000 40000 50000 60000 70000 2012 2013 2014 2015 2016 2017 Me m be rs hi ps (i n th ou sa nd s)
Evolution of Paid Memberships by Segment
Paid Memberships Domestic Paid Memberships International Paid Memberships DVD
Figure 11: Evolution of Paid Memberships by Segment (2012 to 2017)
Source: Company Data
Proportion of Originals and Licensed Titles (2017)
Original Titles Licensed Titles
Figure 9: Proportion of Originals and Licensed Titles in 2017
Source: Epstein, 2016
NETFLIX COMPANY REPORT
PAGE 6/42
Cost Structure, Main Assets and Liabilities
Netflix’s costs are mainly of fixed nature. Licensing deals are usually for a fixed fee and a defined window of availability and payments demand more upfront cash relative to the expense that is recorded (amortization) (Netflix Official Website, 2018b). Even productions require certain multi-year commitments with third parties that are generally of long-term fixed cost nature (Netflix Annual Report, 2017). Costs with content are increasing mainly due to the growing emphasis on owned originals and international expansion (Netflix Official Website, 2018b) and, in the last three years, operating margin ranged from 4.3% to 7.2%.
Netflix’s content library constitutes the main asset of the company. Once a title is acquired through licensing a content library asset, along with a content liability, is recorded on the balance sheet. For productions, costs are capitalized and amounts included in non-current content assets (Netflix Annual Report, 2017) (Netflix Official Website, 2018b). Working capital has been always positive and it grew this last year. As for the return on assets ratio, it grew in 2017 which means that management is getting more effective in converting the invested money into net income. Besides content liabilities, the other big proportion of liabilities belongs to Long-term Debt, which represents 42% of total liabilities. Return on invested capital assumed a value of 9.9 in 2017, which is slightly above the current industry average.
Capital Structure Analysis
As of the third quarter of 2018, Netflix counts with approximately $8.34 Billion of long-term debt. This corresponds to a Debt to Market Capitalization ratio of 0.685. This ratio has been increasing, as well as Debt to book value of Equity and Debt to Total Assets (which corresponded to 1.81 and 0.34 in 2017, respectively). This is in line with the fact that the company prefers issuing debt rather than equity to finance its content investment. The company has chosen to do so given the current low interest rates, tax benefits and its low debt to enterprise value. Last April it raised $1.5 Billion in debt, and it is currently planning to raise a further $2Billion (Netflix Press Release, 2018). This will lead to a total of $10 Billion in long-term debt, and most likely set these ratios higher. This isn’t necessarily bad news for investors, as the company continues to yield impressive results, however it increases its risk profile: if the company does not turn cash flow positive in the next years as expected, it may have trouble paying its obligations. Considering this, as of 2015, Netflix’s solvency ratio (which measures its ability to meet its obligations based on its cash flows) was 2.32%. The ratio improved to 4.09% in 2017, however this value is still quite low. Moreover, Netflix had an Interest Coverage Ratio of 2.37 in 2017, which decreased compared to the previous year. This relatively high value is a good
2015 2016 2017 Solvency Ratio 0.02 0.02 0.04 D/E 1.07 1.26 1.81 D/A 0.23 0.25 0.34 Interest Coverage 1.87 3.18 2.37
Figure 16: Solvency & Coverage Ratios
0 1000000 2000000 3000000 4000000 5000000 6000000 7000000 8000000 9000000 Total Cost of Revenues Domestic Segment International Segment DVD Segment Th ou sa nd D ol la rs
Cost of Revenues by Segment (2015 to 2017)
2015 2016 2017
Figure 12: Cost of Revenues Evolution by Segment (2015 to 2017)
Figure 13: Total Assets and Liabilities and Proportion of Content Related Items (2015 to 2017) Graph: 2015 2016 2017 Working Capital 1902216 1133634 2203662 Operating Margin 0.05 0.04 0.07 ROA 0.03 0.05 ROIC 7.39 5.09 9.94
Figure 14: Liquidity and Profitability Ratios
0 2000000 4000000 6000000 8000000 10000000 12000000 14000000 16000000 18000000 20000000
Assets Liabilities Assets Liabilities Assets Liabilities 2015 2016 2017 Th ou sa nd d ol la rs
Total Assets and Liabilities (2015 to 2017)
Content Related (current and non-current) Other Long Term Debt
Figure 15: Evolution of Long-Term Debt (2015-2018)
Source: Company Data
$2,371,362 $3,364,311 $6,499,432 $8,336,586 $-$1,000,000 $2,000,000 $3,000,000 $4,000,000 $5,000,000 $6,000,000 $7,000,000 $8,000,000 $9,000,000 2015 2016 2017 3Q18 Th ou sa nd d ol la rs
NETFLIX COMPANY REPORT
PAGE 7/42 sign; however, it may be alarming if the ratio decreases further, in the case of, for example, interest rate hikes (Sommer, 2018). Nonetheless, the company foresees an improvement in its leverage situation as Cash Flows get closer to Break Even (Netflix Third Quarter Earnings Call, 2018).
Stock Performance
Netflix launched its Initial Public Offering on May 2002, selling at a price of 15.00 dollars per share. It is traded on the NASDAQ stock exchange as “NFLX” and, as of November 18th, has a 52-week high record of $423.21, a low of $178.38 and
volume of 9,009,485 (Netflix Official Website, 2018c). Currently, Netflix has approximately 327 stockholders of common stock but a significantly larger number of beneficial owners (Netflix Annual Report, 2017). 76% of the company’s shares are held by institutions and 1.74% by insiders (Yahoo Finance, 2018). The company underwent a seven-for-one stock split on July 2015 (Netflix Annual Report, 2017) and its current number of shares is 436,080,000 (Bloomberg, 2018). Comparing the performance of Netflix’s stock and the one of S&P index in the last 3 years, Netflix shows higher cumulative returns.
Price to earnings ratio has been decreasing since 2015, but in 2017 it was still over the current industry average, which is not surprising given that Netflix is still at a growing stage, contrary to its comparable peers. Concerning earnings per share, this ratio has been increasing since 2015 to 2017. Netflix has never announced or paid cash dividends and has no intention to in the foreseeable future (dividend payout is zero) (Netflix Annual Report, 2017).
The Sector
The Entertainment and Media Industry
The entertainment and media industry is undergoing a rapid transformation, mainly driven by the growth of digital segments. Global digital services accounted for 48.4% of the industry’s revenue in 2017 (vs. 37% in 2013) and will start representing more than half of this income from 2018 onwards (PwC, 2017a). Consumer spending on digital media has “more than tripled” on the first half of this decade and is projected to “nearly double” in the second half, with a CAGR of 8%. Conversely, traditional media consumer spending (such as Pay TV subscriptions) has been slowing down (projected to grow at 1.3% CAGR until 2020) (PwC, 2017a). Overall, this growth in digital consumer spending is particularly strong for emerging markets: Africa and the Middle East will be the fastest-growing regions, projected to grow at a CAGR of 10.9% until 2020 (mainly due to the expansion of mobile broadband) followed by Latin America (CAGR of 7.6% until 2020) and Asia Pacific (CAGR of
2015 2016 2017 P/E ratio 408.5 287.91 143.8 EPS 0.281 0.426 1.251
Figure 18: Market Efficiency Ratios Figure 17: Cumulative Returns Netflix vs S&P
Source: Yahoo Finance, 2018
Figure 19: Expected global growth of Entertainment segments (2017-2020) Source: PwC, 2017a
NETFLIX COMPANY REPORT
PAGE 8/42 6.1%). Albeit at a slower pace, Central and Eastern Europe will also show significant growth (corresponding to a CAGR of 5.9%), while Western Europe and North America will most likely experience below average growth (corresponding to 2.7% and 2.9%, respectively, as these markets are maturing (McKinsey, 2016).
Streaming video-on-demand Segment
The Over-the-Top (OTT) video is one of the fastest growing sectors in the industry, powered by the rising popularity of streaming video-on-demand (SVOD) services (Eeden and Chow, 2018) (Statista, 2018a). The United States represent the segment’s biggest market, having registered a total of US$11.3 billion in SVOD revenue as of September 2018. As of 2017, 55% of US households pay a subscription streaming video service, while a decade ago only 10% of households did so (Deloitte, 2018a). The second largest market is Europe, which registered a revenue of US$4.02 billion last year. Even though these markets are becoming saturated, they are expected to continue growing. Worldwide, 2018 figures indicate that around 250 million households use a subscription video service (which translates in a total revenue of US$19.6 billion in 2018) (Statista, 2018b).
The Digital Consumer
Nowadays, consumers expect to view the content they desire whenever they desire. This is one of the reasons why streaming services are becoming so popular: they offer users convenience, control and flexibility to access content at all times. Furthermore, quality and content originality are highly valued. According to Deloitte Digital Media Trends Survey (2018), 54% of streaming video subscribers said they adopted a service because of its original content. Another key aspect is that the mobile device is becoming consumers’ top choice for accessing media and entertainment, as they enjoy the convenience of watching content on the go. According to Ericsson (Ericsson ConsumerLab, 2017), approximately 70% of consumers across the world are watching video content on a smartphone.
Concerning the typical users’ age, streaming video services are most popular among younger generations such as Generation Z (individuals aged 14-20) and Millennials (aged 21-34), however the viewing habits of older generations (particularly generation X, individuals aged 35-51) are becoming similar to those of their younger counterparts. This can be seen as favourable in the SVOD industry given that this this generation has higher levels of disposable income and typically outspends younger generations in when it comes entertainment (Henderson, 2016). In the US, according to a Deloitte’s survey (2018), 64% of Generation X households already subscribe to a streaming service, close to the percentage of 70% and 68% for Generation Z and Millennials, respectively.
Figure 21: Streaming Video Subscriptions by Generation Source: Deloitte, 2018 3,601 3,824 4,044 4,250 4,436 4,595 4,730 13,403 16,428 19,572 21,175 22,222 23,099 23,883 3,282 3,465 3,647 3,820 3,978 4,113 4,225 0 5000 10000 15000 20000 25000 30000 35000 2016 2017 2018 2019* 2020* 2021* 2022* R eve nu e in m ill io n U .S . d ol la rs
TVoD SVoD EST
Figure 20: SVOD importance in worldwide digital video revenues
Source: Statista, 2018a
NETFLIX COMPANY REPORT
PAGE 9/42
Netflix within the industry
Netflix’s main competitors are Amazon Prime Video and Hulu Plus. Hulu Plus is owned by 21stcentury FOX, Walt Disney, NBC Universal (a subsidiary of Comcast)
and AT&T. Other Networks such as CBS (“CBS All Access”), HBO (“HBO Now”) also own their own streaming services. Following this trend, Disney is also on the works of launching its own streaming service. YouTube also has its own subscription-based service, “Youtube TV” and “Youtube Red”. Additionally, considering that Netflix has globalized its service since 2016, it is also competing with local providers from each country, many of which have a first-mover advantage against the US-based company.
Netflix is currently the most successful player in the SVOD industry. This popularity is especially remarkable in the US, where 59% of adults subscribe to Netflix. Even though Amazon does not disclose all information about its Prime Video segment, it is reported to have around 26 million users in the US (Plaugic, 2018). Even though the company operates globally, its popularity is still very behind Netflix’s. Nonetheless, there are some markets where Amazon has a higher market share, such as Germany, India, Japan and Brazil (Roshan, 2018).
Hulu was reported to have around 17 million US subscribers in 2017. Even though the company’s popularity has been increasing, it still has a low subscriber base compared to Netflix. Besides this, Hulu is not available internationally. As for HBO, it is available in several regions of the world, but not globally. Looking at YouTube, its premium service is still at an early stage: YouTube TV only counts with 800,000 subscribers, and is only available in the US (Anon, 2018).
The company also competes indirectly with other forms of media and entertainment. There are other digital video alternatives such as the standard YouTube platform. Moreover, the company will keep competing with cable TV, as many households are not ready to “cut the cord” just yet.This becomes particularly critical considering the many individuals who enjoy watching the news or live stream sports (something Netflix is not interested in offering) (Netflix Third Quarter Earnings Call, 2017). Moreover, Netflix is also competing with free-of-charge alternatives, given that it is relatively easy for individuals to access content through piracy. This holds especially true in emerging markets: in Colombia and Mexico, for instance, over 75% of consumers are reported to watch pirated content, according to Statista (2017).
Netflix wins the Crown
Besides having the advantage of being a first-mover and innovator in the industry, what makes Netflix stand out from competition is that the company has the biggest collection of (high-quality) original content. Netflix launched 300 original shows in
NETFLIX COMPANY REPORT
PAGE 10/42 2017 and is expected to have produced a total of 700 titles by the end of 2018, which will result in around 8$ Billion spent on content this year (The Economist, 2018). Netflix’s competitors have been following this trend, however they do not own a broad catalogue of originals quite like Netflix. HBO also has extremely popular, award-winning original content such as Game of Thrones (Bowman, 2018), however, the general consensus is that Netflix has the best original content, according to a Morgan Stanley survey (Levy, 2016).
The positive influence of original content can be noted through consumer viewing patterns: for instance, even though Netflix does not disclose viewership rates, the season 2 premiere episode of the original series “Stranger Things” registered an average of 15.8 million US viewers on the first days upon its release, according to Nielsen estimates (Spangler, 2018a). Moreover, according to 7Park estimates, original content accounted for 37% of Netflix’s streams in 2018 (an increase of 13% compared to the previous year) (Spangler, 2018b). If the company maintains this upward trend, it could be less prone to losing customers to competitor alternatives. Further, in the long-term, this focus on original programming allows the company to save in costs, by saving in licensing fees and relying less on outside studios, which add a “30% to 50% markup” to content productions (Lovely, 2018).
Furthermore, as Netflix went global in recent years, it has been making an effort to appeal to different foreign markets by producing local original titles: from the 700 titles planned for 2018, 80 are non-English productions (Spangler, 2018c). Many of these have been quite successful, not only in the local region where the show takes place, but all over the world. For example, Netflix’s first Brazilian show “3%” was one of the most viewed shows in the country, and, after being dubbed, it was also frequently watched in other Latin American countries. As a result, this local programming is driving international growth, and these initiatives are teaching Netflix how to adapt to different cultural tastes.
Finally, another advantage of Netflix’s service is that it enables users to download
content and watch it later offline. Conversely, other providers such as Hulu require users to be connected to an Internet source at all times (Nield, 2018).
Pricing
Netflix is competitively priced within the industry. Its pricing plans range from $7.99 to $13.99 a month (even though prices vary from country to country). Hulu can charge from $7.99 to $11.99 a month; however, the cheapest price plan includes advertisements, which positions Netflix at an advantageous position (Hulu Official Website, 2018). In the case of Amazon, consumers can access Amazon Prime for an average of $8.25 a month, which offers a broader range of content compared to Netflix, including both exclusive content and content also available on Netflix
Figure 23: Number of original titles produced by Netflix worldwide Source: Statista, 2018
Number of original titles produced by Netflix worldwide
Pricing Plans
Figure 25: Price Plan Comparison of selected streaming services
Figure 24: Top Ten Netflix Series in the US in 2018
Source: 7Park, 2018
NETFLIX COMPANY REPORT
PAGE 11/42 (Amazon Official Website, 2018). As for HBO, the $9.99 special price for students may pose a challenge to Netflix, however, the 14.99$ price for other users places HBO as a costly alternative compared to its peers (HBO Official Website, 2018). All in all, Netflix offers great value-for-money, given its abundance of content and the lack of commercials. Considering this, the company still has room to increase its prices and it can be verified that the company holds pricing power: even though streaming video subscribers are generally price sensitive (Statista, 2018b), the company increased its prices twice in recent years and its number of subscriptions was not negatively impacted. This may be especially critical to Netflix’s success: its continuous investment in content comes at a big expense, and therefore the company may be forced to keep rising prices in the future (Statista, 2018b).
Increasing Competition
The streaming video-on-demand market is becoming increasingly competitive, giving the numerous alternatives available to consumers, including free of charge ones. As new competitors emerge, the company’s leading position in the industry may be threatened. This becomes especially true considering that this new competition comes from established players from the media industry who, even before debuting their own streaming services, are arguably “Content Kings” as much as Netflix is (such as Disney). Moreover, these players have been using strategic partnerships, as well as mergers and acquisitions as a way to consolidate their positions and gain power, increasing the number of content available to users. As these companies take over, Netflix is susceptible to lose a significant share of its content, which may decrease its value proposition in the future (Cruz, 2018). All things considered, it becomes particularly important for Netflix to keep producing original content and reduce its dependence on third party agreements. The availability of quality media appears to be consumers’ main concern, so in the end it all comes down to who can offer the best content while maintaining an affordable price. And Netflix seems to be leading that race.
Intrinsic Valuation
To estimate Netflix’s intrinsic value based on a Discounted Cash Flow analysis, an explicit period of 10 years (from 2018 to 2028) was considered. The values from 2018 are based on the company’s actual statements (retrieved from its quarterly results), except for the last quarter (October-December 2018), which was forecasted based on the Netflix’s performance throughout the year and information given on shareholder letters. Moreover, it is assumed that one membership corresponds to one household.
Figure 28: Public opinion on the value-for-money of selected video streaming services in the US (as of February 2018) Source: Statista, 2018b
Public opinion on the value-for-money of selected video streaming services
Figure 26: Segments as a % of Total Revenues, 2017
Source: Company data
53% 44%
4%
Segments as % of Total Revenues
NETFLIX COMPANY REPORT
PAGE 12/42
Membership Forecast
Netflix is divided into three segments: Domestic Streaming, International Streaming and DVDs and all three segments derive revenues from monthly memberships fees. Currently, the Domestic Streaming segment is the one that represents the biggest part of total revenues, followed by the International segment and finally the DVD segment. The International Streaming segment is currently the one that is growing the most, with an average yearly growth rate in revenues of 61.43%. As for the Domestic DVD segment, it is declining. Memberships are falling every year at an average rate of 16.59% (considering the last three years).
Concerning the Domestic Streaming segment, Netflix is expected to have 58,384 thousand paid memberships by the end of 2018. Assuming that Netflix’s total market corresponds to the number of households who have access to broadband internet, this corresponds to a penetration rate of 55%. As of 2018, it is assumed that approximately 80,061 thousand of U.S. households subscribe to at least one streaming service (Mercer, 2018), corresponding to a penetration of 75% for the total streaming market, which means that only 20% of streaming consumers subscribe to a service other than Netflix. The growth of US memberships has been slowing down for the past few years, however there is still room to grow. Netflix is making major content investments in 2018 and following years, as well as increasing its Marketing Budget. Bearing this in mind, and assuming the company will uphold its leading position in the industry, we can expect this to increase the number of subscriptions, especially in the next 3 years. As such, it is predicted that the growth of U.S. Netflix memberships will become relatively stable (around 2-3%) from 2023 onwards, and the company will reach a penetration rate of approximately 75% in 2028. This assumes that 16% of consumers will opt to use a competitor streaming service instead of Netflix. Considering this, the company is expected to have 94,068 subscriptions by 2028. Another important remark is that the forecasted penetration rates were paralleled with the penetration of pay TV (satellite and cable) when it was introduced in the region, and with the diffusion of this service throughout subsequent years. For instance, pay TV reached a peak penetration rate of 87% in the US in 2006 (Euromonitor International, 2018c), which is a slightly below the forecasted penetration of the total streaming market in 2028 (91%). This is expected since younger audiences are more receptive to all-forms of media, particularly in digital platforms, and thus more prone to adopt the service. This becomes especially true considering how immediate it is to subscribe to a streaming platform, something valued by Millennials and generations alike.
The International Streaming segment was divided into 7 regions: Canada, Western Europe, Eastern Europe, Latin America, Asia Pacific (excluding China), Middle East
Figure 27: Forecasted memberships for the domestic segment (US)
0 20000 40000 60000 80000 100000 120000 140000 2018 2019 2020 2021 2022 2023 2024 2025 2026 2027 2028 Me m be rs hi ps (i n th ou sa nd s)
U.S. Forecasted Memberships
NETFLIX COMPANY REPORT
PAGE 13/42 and Africa and Rest of the World. The U.S. was used as a benchmark to estimate the future penetration rates and respective memberships for these regions, with additional factors taken into account. Key determinants include: (1) The year Netflix entered the region; (2) The degree of similarity with the US culture and consumer tastes; (3) The diffusion of mobile entertainment devices such as laptops, smartphones and tablets; (4) The number of established competitors in the region. With an expected 5,599 thousand memberships, Netflix’s penetration rate in Canada will be approximately 44% in 2018. Canada was the first country Netflix expanded to in 2010. Total penetration of the streaming market is 64% in 2018 and Netflix is the current market leader (Mercer, 2018). Again, as the company invests in its content strategy and expands its marketing budget, this favourable position in the industry is expected to keep improving. Coupled with the fact that the country shares a great deal of similarities with the United States in terms of culture and tastes, this market is expected to reach almost the same penetration as the U.S., corresponding to a 72% penetration rate for Netflix in 2028. We expect Netflix to hit a relatively steady membership growth (around 2%) just one year after the U.S., that is, in 2024. Total penetration of the streaming market in 2028 is expected to be 86%, and competitor’s penetration to assume a percentage of 14%. Looking at the penetration of pay TV for the time period deemed comparable (in this case, from 1983 to 1993, based on how many years had passed since the introduction of this media and how penetrated the market was at the time), this total streaming penetration is similar, though somewhat higher, for the same reasons highlighted for the U.S. (Pay TV reached a 77% penetration in 1993, and kept growing at small rates from thereon).
Looking into Western Europe, Netflix’s penetration rate of 2018 corresponds to 18.83%. Netflix started expanding to the region in 2012 and it became available in every country in 2016. Much like Canada, Western Europeans have similar entertainment tastes as those of U.S. consumers, therefore we can assume that Netflix’s current and new content will be well received, and marketing efforts will be successful in the region. However, some European countries have other well-established competitors. For example, Amazon Prime is the market leader in Germany and there are some local providers as well, as is the case of France, that already own the rights to stream some of Netflix’s content (Scott, 2014). Moreover, the cord-cutting phenomenon is less pronounced in Europe. Considering this, the number of Netflix subscribers in the region will still grow by a considerable amount (around 15%) for some years, and then start slowing down after 2025. For the reasons mentioned, we can expect Netflix to reach a penetration of just over 57%, representing 107,173 thousand memberships in 2028. Penetration for competitors is expected to be 20%, which is smaller in relative terms to the current one (15%
Figure 28: Forecasted memberships Canada 0 2000 4000 6000 8000 10000 12000 14000 16000 2018 2019 2020 2021 2022 2023 2024 2025 2026 2027 2028 Me m be rs hi ps (i n th ou sa nd s)
Canada Forecasted Memberships
Netflix Memberships Households with Broadband Internet Streaming Memberships
Figure 29: Forecasted memberships in Western Europe 0 50000 100000 150000 200000 250000 2018 2019 2020 2021 2022 2023 2024 2025 2026 2027 2028 Me m be rs hi ps (i n th ou sa nd s)
Western Europe Forecasted Memberships
NETFLIX COMPANY REPORT
PAGE 14/42 out of 33% for the total streaming market). Again, this means that the total penetration rate of the streaming market (77%) will be higher than the penetration of pay TV, which reached a peak of 58% in 2012 and has been slowing down since then (Euromonitor International, 2018d).
Netflix has a low penetration rate in Eastern Europe: it is expected to reach 4.4% in 2018. Eastern European citizens’ tastes are not as similar to the U.S.; these households are not ready to abandon traditional cable, and local TV stations are still particularly popular in the region, especially since they offer content in local language (Eshun, 2016). In fact, the penetration rate of pay TV has still been rising (currently assuming 64%), and only now, in 2017, has it began to fall (Euromonitor International, 2018e). Furthermore, the possession of smart mobile devices is not as strong as in Western Europe, though in the long term it will be identical (Euromonitor International, 2018a).Considering this, there is still room to grow in Eastern Europe, and we project the company will reach a penetration rate of 14% in 2028, which corresponds to a total of 14,986 thousand memberships. As for the total streaming market, it is expected to assume 20% penetration. Besides the reasons highlighted before, other factors that contribute to this small number are the prevalent low levels of disposable income among the population, and reluctance to use credit cards (Dreier, 2018). We project the growth for Netflix penetration to be more concentrated in later years (around 20% in 2023 and 2024), when Netflix grows its offer of local content (Netflix only premiered its first two eastern European TV shows in 2018) (Feldman, 2018), and then continue in subsequent years (with a 6% growth assumed for 2028), as more consumers leave cable.
Netflix launched its service in Latin America in 2011. Even though there are several competitors in the area (both international and local ones), the company is the current market leader (GlobalData, 2018). There are currently 18,443 thousand households who subscribe to Netflix, corresponding to a penetration rate of 21% in 2018. This penetration is higher than the one of Western Europe, for example; however, we believe the region has a higher growth potential, considering its network infrastructures are still developing and possession of smartphones is becoming increasingly common (which is considered the preferred media platform in the region) (Passport, 2018a). Therefore, even though Netflix introduced itself on the region in earlier years, it is expected to display strong levels of growth throughout the next decade: growth will be more concentrated in early years (around 15%), since the company is already producing local-language programming in the region; even after slowing down, around 2024, Netflix’s memberships will maintain relatively high growth rates (around 7% from that year onwards). By 2028, Netflix will reach a penetration rate of 38%, corresponding to 53,949 thousand memberships. By this time, the total streaming market will have
Figure 30: Forecasted memberships Eastern Europe 0 20000 40000 60000 80000 100000 120000 2018 2019 2020 2021 2022 2023 2024 2025 2026 2027 2028 Me m be rs hi ps (i n th ou sa nd s)
Eastern Europe Forecasted Memberships
Paid Memberships Households with Broadband Internet Streaming Memberships
Figure 31: Forecasted memberships Latin America 0 20000 40000 60000 80000 100000 120000 140000 160000 2018 2019 2020 2021 2022 2023 2024 2025 2026 2027 2028 Me m be rs hi ps (i n th ou sa nd s)
Latin America Forecasted Memberships
NETFLIX COMPANY REPORT
PAGE 15/42 reached a forecasted penetration of 52%. This value is similar to the current penetration of pay TV in the region, which is still increasing every year: it went up from 25%, ten years ago, to 53% in the present (Euromonitor International, 2018f). The Asia Pacific region has a total streaming penetration rate of 6.5% in 2018. However, Netflix’s penetration corresponds to only 2%. This region includes Australia, where viewers are known to appreciate U.S. TV shows and movies, and competition is not as fierce (Powell, 2017). However, the company’s penetration rate is most likely being dragged down by Asian countries, especially considering that China is excluded from the equation. While some high-income countries in the region may be welcoming to the service, other countries (such as India) may prove more challenging to penetrate, based on cultural and economic differences, as well as preference for local content (Szalai, 2014). This is aggravated by the fact that there are well-established local competitors in the region (such as the popular streaming service iFlix) that are up to 3 times more affordable than Netflix (CB Insights, 2017). Given this, we expect Netflix to have 40,641 thousand memberships in 2028, corresponding to a penetration rate of 5.28%. However, this number will still grow by a considerable amount (around 10.4%) in following years, as consumers are not abandoning pay TV just yet (its penetration has been growing and will continue doing so for the next decade) (Euromonitor International, 2018g). The total streaming market is forecasted to reach a 12% penetration in 2028, which means that remaining competitors will still represent more than half of total streaming memberships.
Netflix launched in the Middle East & Africa in 2016, having attained a penetration rate of 5% in 2018. There are areas in the region (such as United Arab Emirates and Israel) that are very technologically advanced and may further Netflix’s integration in the area. Moreover, the diffusion of smartphones and tablets will experience outstanding growth in the future in the region, including Africa (from 52% in 2018 to 89% in 2028) (Passport, 2018b). However, there are big cultural and linguistic gaps between these regions and the United States. Even though the company is debuting its first local middle eastern show in 2019 (White, 2018) the company’s adaptation may still be a challenge, especially considering the abundance of local competitors in the area (Fingas, 2018). As such, in this region Netflix is estimated to reach a penetration of 7% in 2028, which corresponds to 11,8784 thousand subscribers. As for the total streaming market, its forecasted penetration corresponds to 15%, which means that, even though there will be a slight improvement, Netflix will not completely dominate this market for the time being. Nonetheless, a yearly membership growth of around 13% is expected from there on. Further, pay TV penetration is still growing in the region (currently corresponding to approximately 38% penetration) and will continue doing so in the
Figure 32: Forecasted memberships Asia-Pacific Region 0 100000 200000 300000 400000 500000 600000 700000 800000 900000 2018 2019 2020 2021 2022 2023 2024 2025 2026 2027 2028 Me m be rs hi ps (i n th ou sa nd s)
Asia Pacific Forecasted Memberships
Paid Memberships Households with Broadband Internet Streaming Memberships
Figure 33: Forecasted memberships Middle East & Africa
0.0 20000.0 40000.0 60000.0 80000.0 100000.0 120000.0 140000.0 160000.0 180000.0 200000.0 2018 2019 2020 2021 2022 2023 2024 2025 2026 2027 2028 Me m be rs hi ps (i n th ou sa nd s)
Middle East & Africa Forecasted Memberships
NETFLIX COMPANY REPORT
PAGE 16/42 foreseeable future (Euromonitor International, 2018h), therefore it will still take some time before the streaming market reaches its full potential in the region. Since Netflix only went fully global in 2016, it will keep growing its number of memberships in the Rest of the World, reaching 6,218 thousand members in 2028. The DVD segment revenues have been decreasing at an increasing rate, and we predict this trend to continue. Overall, this will result in total decrease of almost 100% from 2018 to 2028.
Pricing
Netflix has three different pricing plans that users can choose from; however, it does not disclose information about users’ pricing plan choices, therefore an average price was used. Netflix’s average price in 2018 corresponds to $11.4 for the domestic segment and $8.95 for the international segment (Netflix Letter to shareholders Q1, 2018). Most recently, Netflix rose prices in 2016 and 2018 by 12% and 13% for the domestic and international segment, respectively, without impacting negatively its number of subscribers. Therefore, we can expect further price increases, given that Netflix is spending billions on content and these price hikes will likely be necessary to maintain or increase profitability. Additionally, price increases, especially in the more developed markets, can be used to support the recent expansion for new lower-priced geographies. Furthermore, given the broad range of content Netflix currently owns, which most consumers perceive to be superior among the industry, and the fact that it is still reasonably priced compared to most competitors, Netflix still has the power to increase prices. Taking this into account, we can expect further price hikes (again, of 12 and 13%) in the foreseeable future, in approximately every two years. Besides this, a US forecasted yearly inflation rate of 2.3% was considered throughout the whole period for the domestic segment (Comstat, 2018), as well as the corresponding inflation rates for each international region (Euromonitor International, 2018b).
Revenues Forecast
Revenues in 2018 will correspond to 15.8 billion dollars. In 2028 this value is expected to reach 54.0 billion dollars, more than triple the amount of 2018 (an increase of 241.1%). This corresponded to an average yearly growth of 13.35%, with a growth rate of 4.5% in 2028. With a share of 66.1% of total revenues in 2028 (vs 49% in 2018), the international segment will make up the majority of revenues.
Content Investment & Cost of Revenues Forecast
As the company focuses on its content strategy and attempts to increase its penetration in new markets, a big content investment is expected, especially in the
Figure 34: Forecasted Total Revenues
-10,000,000.00 20,000,000.00 30,000,000.00 40,000,000.00 50,000,000.00 60,000,000.00 2017 2018 2019 2020 2021 2022 2023 2024 2025 2026 2027 2028 Th ou sa nd d ol la rs
Total Revenue Forecast
NETFLIX COMPANY REPORT
PAGE 17/42 next 2 to 3 years. Netflix recently stated that around 85% of its content spending will go towards original productions (Spangler, 2018d), which corresponds to $6.5 Billion in 2018 and a final number of 700 new productions for the year. Licensed content still makes up more than 75% of Netflix’s library, however the company is striving to attain a 50/50 mix of original and licensed titles (Netflix 2Q16 Earnings Call). Considering this, as the company continues ramping up its number of original productions, we expect the number of original titles to surpass the number of licensed titles from 2021 onwards. By 2028, the company is estimated to own a total of 12,883 original titles, corresponding to 1371 productions for the year and nearly $17.9 billion invested (vs. $3.2 billion for licensed content).
Netflix accounts for content spending (licensed and produced) through streaming amortization expenses. Amortization of streaming content assets is done on an accelerated basis, due to expected upfront viewing, and over a maximum of 10 years after the content is made available for Netflix’s use (Netflix Annual Report, 2017).Cash spent on content to amortization ratio has been at a constant rate of 1.44 and there are no reasons to assume changes to this ratio in the future. Considering Netflix’s large content investment, we expect amortization to increase at growth rates around 20% in the upcoming years. However, after that period growth is expected to continue but at decreasing rates and assume, at a more mature stage, a growth of 2% a year, reaching approximately $14.7 billion in 2028. Amortization constitutes a great proportion of Cost of Revenues. Thus, Amortization to Cost of Revenues ratio was used to predict the cost of revenues. According to this estimation, Cost of Revenues is predicted to reach 9.4 billion dollars in 2018 and 18.0 billion dollars in 2028.
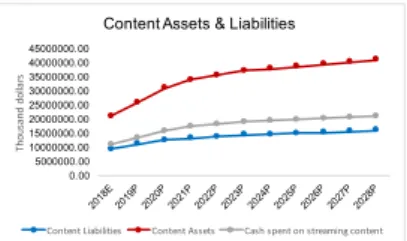
Content Assets
Streaming content assets are expected to increase, maintaining the upward trend observed in the past few years. These are forecasted as a percentage of cash spent on streaming content assets. Current content assets are expected to assume a percentage of 52% in 2018. This number will likely decrease in the next few years, as Netflix invests predominantly in original programming (which are only recorded as non-current content assets), and will only stabilize in 2021. As for non-current content assets, its value as a percentage of cash spent has been increasing. For the same reason, this trend is expected to continue for some years, before becoming more stable again in 2021, when the company attains a greater subscriber base and reputation.
Content Liabilities
Figure 35: Forecasted Investment inlicensed and produced content
-2,000,000.00 4,000,000.00 6,000,000.00 8,000,000.00 10,000,000.00 12,000,000.00 14,000,000.00 16,000,000.00 18,000,000.00 20,000,000.00 2018E 2019P 2020P 2021P 2022P 2023P 2024P 2025P 2026P 2027P 2028P Th ou sa nd d ol la rs
Investment in Streaming Content (licensed and produced)
Investment in original content Invesment in licensed content
Figure 36: Forecasted amount of original and licensed content
0 2000 4000 6000 8000 10000 12000 14000 16000 18000 Nu m be r of ti tle s
Original vs Licensed Titles
Total Original Titles Total Licensed Titles
Figure 37: Forecasted Amortization and Cash Spent on Streaming Content Assets
-5,000,000.00 10,000,000.00 15,000,000.00 20,000,000.00 25,000,000.00 Th ou sa nd d ol la rs
Cash Invested on Content and Amortization Forecast
Amortization Cash Invested on Content
Figure 38: Forecasted Cost of Revenues and Amortization -5,000,000.00 10,000,000.00 15,000,000.00 20,000,000.00 Th ou sa nd d ol la rs
Amortization and Cost of Revenues Forecast
NETFLIX COMPANY REPORT
PAGE 18/42 As content investment increases, content liabilities (both current and non-current) will increase as well. However, as a percentage of cash spent on streaming content, they are expected to slightly decrease, as they have been in the recent past. A reason that explains this is the fact that licensing is a big part of the recorded liabilities; therefore, as focus on productions intensifies, its portion in the company’s content library will decrease. Non-current content liabilities are forecasted to represent around 6.7 billion dollars in 2028.
Marketing Forecast
We believe Marketing will grow as memberships keep growing, therefore its cost was forecasted based on a percentage of revenues. In the past 3 years, Marketing expenses have represented 11 to 12% of total revenues. The company’s Marketing Budget for 2018 corresponded to $2 Billion, and this budget is expected to increase substantially in the next years to attract new consumers (especially in new international segments) and keep existing ones from leaving. This becomes especially important as new entertainment alternatives are emerging. Considering this, we expect Marketing costs to represent 13.6% of revenues in the next years, reaching a peak value of $3.2 Billion in 2020. From 2021 onwards, this percentage will start decreasing, as some markets are beginning to stabilize (such as Canada and the US) and others are becoming more aware of Netflix’s service and content library. Besides, it is expected that content quality and reputation will prevent the company from relying intensively on marketing activities. Nonetheless, even though they are decreasing, Marketing Costs will still correspond to just under $3 Billion throughout the years for the time considered (2021-2028).
Technology, General and Other Expenses Forecast
Technology & Development costs, that mainly include expenses related with improvement, maintenance and testing of the network’s user interface (Netflix Annual Report, 2017), are expected to increase in the next 2 to 3 years. From 2021 onwards, as the company becomes more efficient in its operations, these are expected to decrease as a percentage of revenues.
General & Administrative costs, that consist of payroll and other related expenses for corporate and support personnel (Netflix Annual Report, 2017), are expected to increase as memberships/revenues increase. As so, they were assumed to maintain a rate of around 6% of revenues.
Operating Margin
Operating margins have been low since 2015, and this will continue as Netflix increasingly produces content rather than licensing it. However, as subscribers
Figure 42: Evolution of Forecasted Operating Margin
Figure 39: Forecasted Content Assets and Content Liabilities 0.00 5000000.00 10000000.00 15000000.00 20000000.00 25000000.00 30000000.00 35000000.00 40000000.00 45000000.00 Th ou sa nd d ol la rs
Content Assets & Liabilities
Content Liabilities Content Assets Cash spent on streaming content
Figure 40: Forecasted Marketing Expenses
-500,000.00 1,000,000.00 1,500,000.00 2,000,000.00 2,500,000.00 3,000,000.00 3,500,000.00 Th ou sa nd d ol la rs Marketing Forecast
Figure 41: Forecasted Technology, General and Other Expenses
-500,000.00 1,000,000.00 1,500,000.00 2,000,000.00 2,500,000.00 3,000,000.00 3,500,000.00 4,000,000.00 4,500,000.00 Th ou sa nd d ol ar s
Techonology, General and Other Expenses Forecast
NETFLIX COMPANY REPORT
PAGE 19/42 increase, its operating margin is expected to increase. More specifically, the relative cost of streaming contents will decrease in relation to revenues. As so, we predict that margins will increase, especially in the first four years of the explicit forecast period (2018-2028), reaching approximately 31.9% in 2022.
WACC
The rate used to discount Netflix’s core free cash flows was the Weighted Average Cost of Capital (WACC). The capital structure considered was Netflix’s target capital structure for the long-term (25%) (Netflix Third Quarter Earnings Call, 2018) instead of the current one (which corresponds to 6.9% at market values).
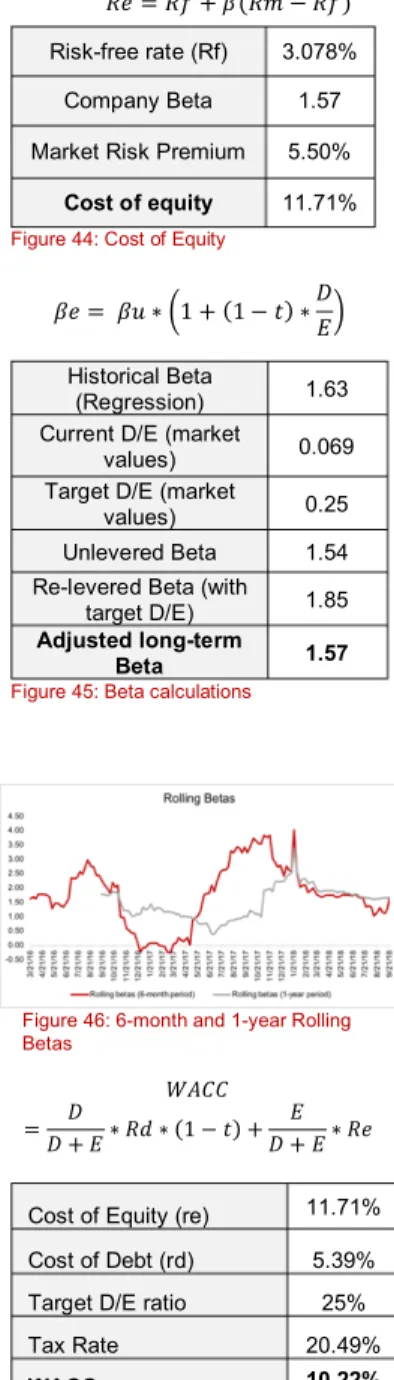
Netflix is rated Ba3 by Moody’s Rating Agency. As such, it is important that the company’s default probability is accounted for in the cost of debt calculation. Cost of debt was calculated using a 10-year fixed income corporate bond with a yield of 6.06% (Bloomberg, 2018). The annualized probability of default for a company with this rating is 1.47% and the expected loss rate is 46.15% (it is a senior unsecured obligation), which results in a cost of debt of 5.39% (Moody’s, 2018). Considering an effective core tax rate of 20.49%, after-tax cost of debt is 4.28%.
The cost of equity was calculated based on the Capital Asset Pricing Model (CAPM). The risk-free rate used was the yield of a 10-year US government Bond, which corresponded to 3.078% (Investing.com, 2018), and the Market Risk Premium, corresponding to 5.5% was calculated based on KPMG’s 2018 research on MRP (Weimer, 2018). The company’s Beta was calculated by regressing Netflix’s weekly returns against those of the Market (measured by the S&P500 Index). Only 3 years of weekly data were considered, given that Netflix is a growing company that recently became global, thus a longer period could make the analysis less reliable. This corresponded to a beta of 1.63. However, since this result is based on historical information, several techniques were employed to improve its accuracy. These techniques exclude comparable company data, which was deemed inadequate for this analysis, since most of Netflix’s competitors operate in other activities besides streaming. Looking at Netflix’s 6-month and 1-year rolling betas, they have been somewhat volatile, with no noticeable pattern. Moreover, the regression beta has a wide 95% confidence interval, ranging from 1.09 to 2.16. Finally, the historical beta obtained does not incorporate Netflix’s long-term prospects. As such, this beta was unlevered and releveled, replacing Netflix’s current debt to market capitalization ratio for its long-term target capital structure. This resulted in a levered beta of 1.95. Nevertheless, we believe that, in the long-term, Netflix’s returns will not deviate that much from those of the market. Under this assumption, an adjustment was made to bring the company’s beta closer to 1. 𝑊𝐴𝐶𝐶
=𝐷 + 𝐸𝐷 ∗ 𝑅𝑑 ∗ (1 − 𝑡) +𝐷 + 𝐸𝐸 ∗ 𝑅𝑒
Cost of Equity (re) 11.71% Cost of Debt (rd) 5.39% Target D/E ratio 25% Tax Rate 20.49%
WACC 10.22%
Figure 47: WACC calculations
𝑅𝑒 = 𝑅𝑓 + 𝛽(𝑅𝑚 − 𝑅𝑓) Risk-free rate (Rf) 3.078%
Company Beta 1.57 Market Risk Premium 5.50%
Cost of equity 11.71%
Figure 44: Cost of Equity
𝑅𝑑 = 𝑦𝑡𝑚 − 𝑝 ∗ 𝐿
Netflix Rating Ba3 Yield of a 10y fixed
income bond 6.06% Probability of default
(p) 1.47%
Expected Loss rate
(L) 46.15% Cost of Debt 5.39%
Figure 43: Cost of Debt
𝛽𝑒 = 𝛽𝑢 ∗ 91 + (1 − 𝑡) ∗𝐷 𝐸: Historical Beta
(Regression) 1.63 Current D/E (market
values) 0.069 Target D/E (market
values) 0.25 Unlevered Beta 1.54 Re-levered Beta (with
target D/E) 1.85 Adjusted long-term
Beta 1.57 Figure 45: Beta calculations
Figure 46: 6-month and 1-year Rolling Betas
NETFLIX COMPANY REPORT
PAGE 20/42 This resulted in a final beta of 1.58. With these inputs, a Cost of equity of 11.71% was obtained. This corresponds to a final WACC of 10.22%.
Free Cash Flow, ROIC and Target Price
At the moment, core business free cash flows are negative. This is not surprising given the major content investment that Netflix is currently undergoing. This situation is to continue and reach its peak in 2018. Past 2018, Netflix is expected to increase its free cash flow as Return on Invested Capital increases. Netflix’s Return on Invested Capital (ROIC) will increase significantly throughout this period until 2022 (going from 10.6% in 2019 to 41% in 2022). By 2022, this value will have surpassed the Entertainment Industry’s average of 31.22% (Damodaran, 2018). Furthermore, while in 2018 and previous years this gap has been relatively small, from 2019 onwards the company’s return will be substantially higher compared to its cost of capital. Considering this, Free cash flow turns positive in 2021 (when ROIC reaches approximately 22%) and is expected to increase further from this year onwards. Past the explicit period considered, Netflix is believed to continue growing at a rate superior than the long-term economy one. The reason is that the company will keep growing internationally, given that some markets will not be entirely saturated by 2028, and the company will still have room to increase its penetration rates (especially in the Middle East and Africa, Asia Pacific, Eastern Europe and Latin America, with growth rates of approximately 13%, 10%, 5.8% and 6%, respectively). Therefore, a 10-year growing annuity (2028-2038) was considered, with a growth rate of around 4.78%. After this period, a growing perpetuity was assumed, with a growth rate of 2.4%, corresponding to the predicted growth rate of the global economy (PwC, 2017b). Calculations led to an enterprise value of 184,028,979.91 dollars. After adjusting the value by subtracting the company’s value of Net Debt (corresponding to approximately $8.8 Billion) – an Equity Value of 175,210,075.55 dollars was obtained, which equals a value per share of $401.78.
Relative Valuation
Comparables
Seven key companies were chosen to integrate Netflix’s peer group. The companies selected operate in the same industry or share similarities in terms of business model: the companies are technology-based, provide video entertainment content and/or operate in the streaming video-on-demand industry and all have an international reach. The size of the companies (based on their Market Capitalization) and their profitability (based on revenue growth and profit margins)
Figure 48: Forecasted FCF (5,000,000.00) - 5,000,000.00 10,000,000.00 15,000,000.00 20,000,000.00 25,000,000.00 Th ou sa nd d ol la rs
Free Cash Flow Forecast
Figure 49: Evolution of Forecasted ROIC
0.00% 10.00% 20.00% 30.00% 40.00% 50.00% 60.00% 70.00% 80.00% 90.00% 2018E 2019P 2020P 2021P 2022P 2023P 2024P 2025P 2026P 2027P 2028P
Return on Invested Capital
NETFLIX COMPANY REPORT
PAGE 21/42 were also taken into account, as well as the degree of financial risk (measured through financial leverage). Given this, the chosen companies are Walt Disney, 21stCentury FOX, Vivendi, Comcast, Charter Communications, AT&T and Amazon.
Multiples considered for this valuation include the trailing and forward price-earnings ratio (P/E), the Price to Book Value ratio (P/BV) and the EV/EBITDA ratio. Other multiples such as the price-earnings-growth (PEG) ratio and EV/Sales were considered, taking into account that Netflix is a fast-growing company, while some of its peers are already in a more mature stage.
Relative Valuation Results
By attributing different weights to each multiple (as some are more suitable than others for the stage Netflix is in), the final Share Price of Netflix corresponds to $124.6. An important remark is that this value is merely indicative, considering that some of the comparable companies operate in multiple business sectors besides streaming video, which may reduce the accuracy of the multiples used.
Sensitivity & Scenario Analysis
The sensitivity analysis focused on two variables that impact this valuation – growth rate applied to the annuity and the WACC. For this analysis, the growth rate ranged from 3.82% to 5.73% and the impact on equity value was 5.26% for the optimistic case and -4.91% for the pessimistic. As for the WACC, its impact on equity value was considerably larger – a WACC of 12% would turn share price to $300.88 (a decrease of 25.11%) and a WACC of 7% would increase equity value in 99.58%. For the scenario analysis, two additional scenarios were developed, a pessimistic (Attachment 3) and an optimistic one (Attachment 4). The pessimistic scenario offers a view on how Netflix would be affected as competitors integrate and fight for exclusivity of streaming content, while the optimistic one focuses on the possibility of Netflix introducing a new pricing tier.
Both Scenarios, pessimistic and optimistic, will be considered in our valuation with a weight of 20%, leaving us with an expected price of $361.27 per share.
Final Recommendation
At present, Netflix’s share is trading at the value of $279.22 (Bloomberg, as of 4/12/2018). The valuation suggests that Netflix’s real fair value is approximately $361.27 – that is, Netflix’s stock is considered to be slightly overvalued at the moment, being traded at a discount of approximately 9.66%. Taking this into consideration, the recommendation for an investor regarding Netflix’s stock is “Buy”. Multiple NFLX Share Price Weight of multiple Trailing P/E 191.74 13% Forward P/E 110.38 13% PEG 224.80 20% EV/EBITDA 33.79 20% EV/Sales 107.62 20% P/BV 82.93 13% Final Price 124.6 Figure 50: Price Based on Relative Valuation
Figure 51: Sensitivity Analysis
Share Value Change in Equity Value 5.73% 722.90 5.26% g annuity 4.78% 401.78 0.00% 3.82% 382.06 -4.91% 12% 300.88 -25.11% WACC 10.22% 401.78 0.00% 7% 801.88 99.58% Input
Figure 52: Final Price based on the three scenarios
Pessimistic Base Case Optimistic
Share Price 190.34 401.78 410.64 Weight on Final
Share Value 20% 60% 20%