Equity Valuation of
Cimpor
Universidade Católica portuguesa
Católica LisbonSchool of Business and Economics
Master’s Thesis in Equity Valuation
Advisor Professor José Carlos Tudela Martins
Prepared by:
2
Abstract
Based on the major theme of Equity Valuation, this thesis has as its main purpose the valuation of Cimpor, the biggest Portuguese cement producer and one of the largest in the World.
In order to achieve the final value of such company, a detailed research work had to be done regarding all the possible valuation methods that could be used, which involved a rigorous study over the entire Equity Valuation theory.
By reviewing all the available valuation methods and afterwards studying the company structure and organization, the methodology was chosen and followed according to the parameters established by the explained theory.
This process led to a final value for the company that was not only discussed by itself, but also compared with the value achieved by a valuation elaborated by the Equity Research team of BES Investimento.
According to the methodology followed, the assumptions made and the comparison with the results from the referred investment bank, the final conclusions were expressed.
3
Acknowledgments
Considering the hard work and dedication needed to complete a thesis work, I believe it is really important to be supported.
For that reason, I would like to thank Professor José Carlos Tudela Martins for the knowledge conveyed and the availability showed throughout the thesis extent to clarify any doubt, the BES Investimento Equity Research team that considerably helped with its points of view and valuable information, the Millennium BCP Investment Banking analyst João Mateus for the accessibility to clarify any question, the Investor Relations department of Cimpor for the answered questions, the Head of Risk & Reporting department of Banif Investment Bank Jaqueline Rodrigues for the disposal of all the department available resources that could help me, some of my colleagues who were really important to debate different points of view and opinions, and, finally, to my parents and all my family who do not only supported me throughout the thesis period, but also during the entire graduation length.
4
Table of Contents
1. Executive Summary 2. Literature Review 2.1. Valuation Introduction 2.2. Valuation Models2.2.1. Asset Based Valuation 2.2.1.1. Replacement Cost 2.2.1.2. Liquidation Cost 2.2.2. Contingent Claim Valuation
2.2.2.1. Option to Delay 2.2.2.2. Option to Expand 2.2.2.3. Option to Liquidate 2.2.3. Discounted Cash Flow Valuation
2.2.3.1. Firm Valuation
2.2.3.1.1. Free Cash Flow to the Firm (FCFF) 2.2.3.1.2. Adjusted Present Value (APV) 2.2.3.1.3. Excess Return Model (EVA) 2.2.3.2. Equity Valuation
2.2.3.2.1. Free Cash Flow to the Equity (FCFE) 2.2.3.2.2. Dividend Discount Model (DDM) 2.2.3.3. Valuation Variables
2.2.3.3.1. Capital Asset Pricing Model (CAPM) 2.2.3.3.2. Risk Free Rate
2.2.3.3.3. Beta (ß)
2.2.3.3.4. Equity Risk Premium 2.2.3.3.5. Exchange Rate 2.2.3.3.6. Tax Rate 2.2.3.3.7. Terminal Value 2.2.3.3.8. Cyclical Companies 2.2.3.3.9. Emerging Markets 2.2.4. Relative Valuation
5 2.2.4.1. Multiples Categories 2.2.4.2. Peer Group 3. Company Overview 3.1. Company Description 3.2. Shareholder Structure 3.3. Historical Performance 3.4. Company Future Strategy 4. Industry Overview
4.1. Industry Description
4.2. Cement Production and Consumption 4.3. Cement Prices
4.4. Industry Dynamics Analysis 4.5. Main Industry Players 5. Valuation
5.1. Assumptions
5.1.1. Valuation Approach
5.1.2. Weighted Average Cost of Capital (WACC) 5.1.3. Cement Consumption 5.1.4. Total Sales 5.1.5. Total Costs 5.1.6. Depreciation 5.1.7. Working Capital 5.1.8. Capital Expenditures 5.1.9. Debt 5.2. Countries’ Valuation 5.2.1. Portugal 5.2.2. Spain 5.2.3. Brazil 5.2.4. Egypt 5.2.5. Turkey 5.2.6. South Africa 5.2.7. Morocco
6 5.2.8. Mozambique 5.2.9. Tunisia 5.2.10. China 5.2.11. India 5.2.12. Cape Verde 5.3. Sum of the Parts 5.4. Relative Valuation 6. Sensitivity Analysis 7. Valuations Comparison 8. Conclusion 9. References 9.1. Academic Articles 9.2. Reports 10. Appendices
10.1. Income Statement, Balance Sheet and Cash Flow Statement – Total Values
10.2. Income Statements and Market Data Assumptions by Country 10.2.1. Portugal 10.2.2. Spain 10.2.3. Brazil 10.2.4. Egypt 10.2.5. Turkey 10.2.6. South Africa 10.2.7. Morocco 10.2.8. Mozambique 10.2.9. Tunisia 10.2.10. China 10.2.11. India 10.2.12. Cape Verde 10.2.13. Other Activities
10.3. Working Capital (As % of the Sales) 10.4. Analyst Stock Ratings
7
1. Executive Summary
Cimpor, as the largest cement producer in Portugal, is also one of the top cement producers around the World. The company initiated firstly its operations in Portugal and then, in Spain, but it was predictable that the markets of both of these countries would not allow Cimpor to keep growing as it wanted to. So, the company strategy started to be more focused in the internationalization of its operations and, specially, in the emerging markets. The truth is that this strategy allowed Cimpor to keep growing and, with the diversification of risks and emergence of new opportunities, do not be so injured by the actual economic situation.
Considering the goal of this thesis is to value Cimpor at the date of the end of the year 2011, an analysis of all the existent valuation methods was executed and it was concluded that Discounted Cash Flow (DCF) method, accompanied by a Relative Valuation that could provide guaranties of the consistency of the value estimated for the company in the core method (DCF), was the most suitable methodology that should be followed for a company like Cimpor.
And, by saying a company like Cimpor, it means it is a cyclical company, which is a company that is more subject to variations in profitability according to the economic situation each country where it operates live. It is also present in 12 countries around the World, being 10 of them emerging economies.
In order to be succeeded in the valuation of Cimpor through the referred valuation methodology, it is important to have the assumptions of the model well defined. One of the most important assumptions is the fact that cement consumption evolution goes along with the evolution of the Gross Domestic Product (GDP) per capita. So, a country with low GDP per capita would normally have a low level of cement consumption. Having one of the most important steps defined that is the cement consumption for each country, it would be possible to forecast the sales, the costs and all the remaining segments that would lead to the Free Cash Flow to the Firm (FCFF). Bearing in mind that each country would have its own FCFF, a specific Weighted Average Cost of Capital (WACC) was estimated for each country too. These country’s WACCs would be used to discount the FCFF throughout the entire explicit period, which in the case of
8 cyclical companies would have to have a longer period than normal in DCF valuations, in order to annul the effects of up and downturns of the economies.
From the DCF valuation, the fair value estimated for a share of Cimpor was 5,87 euros, which was 10% higher than the actual current price verified at the time (30 December, 2011), 5,32 euros.
Afterwards, to confirm the consistency of the value calculated, Relative Valuation took place. But, in order to have it done, the most important part had to be made, the choice of the peer group. The factors considered were the similarity between Cimpor and its peers in terms of Return On Invested Capital (ROIC) and the sales growth. Having the peer group chosen, the Price to Earnings multiple and the Enterprise Value / EBITDA multiple were used and, with both multiples, the values found for the base case were quite similar to the one estimated through DCF method, confirming this away its consistency.
Apart from the valuation methods, it was then made a sensitivity analysis where relevant variables were tested to see how the fair value of Cimpor would change with the use of DCF method. Thus, the variables tested were the cement consumption, the market share and, linked with the WACC calculation, the reference market premium and the spread added in the cost of debt constitution. For all of the variables, the ranges of prices verified did not differ that much, however, a little bigger range was verified in the analysis done with the reference market premium, showing that, probably, amongst these 4 variables, this should be the one that could affect more the estimation of the final fair value.
In the end, a comparison between my own valuation and an investment bank valuation about Cimpor was made and some differences were observed, mainly for the assumptions taken regarding the WACC structure, since the method used was the same. The difference of prices was 0,13 euros, being the estimation of the investment bank of 6 exact euros.
Still, I concluded that, in this case, my own assumptions seemed reasonable and, then, the fair price considered was the 5,87 euros with an upside potential of 10% over 5,32 euros verified at that time, which made me consider the Cimpor stock as having a NEUTRAL rating.
9
2. Literature Review
Firm Valuation is nowadays an important area in finance with a sum of different purposes and goals, but according to Luehrman (1997), “how a company estimates value is a critical determinant of how it allocates its resources” since “the allocation, in turn, is a key driver of a company’s overall success”.
However, valuation is not a completely objective science, which means assumptions have to be made and methodologies have to be followed. This will depend on the analyst analysis and sensitivity to the valued company characteristics and environment/industry and also the economic situation that is leading the World flows and tendencies.
Even though, the methodologies followed to value a company may be source of a series of matched characteristics between the method main focuses and the company, meaning that the valuation method chosen for the company valuation may be not as subjective as some other parts of the entire process.
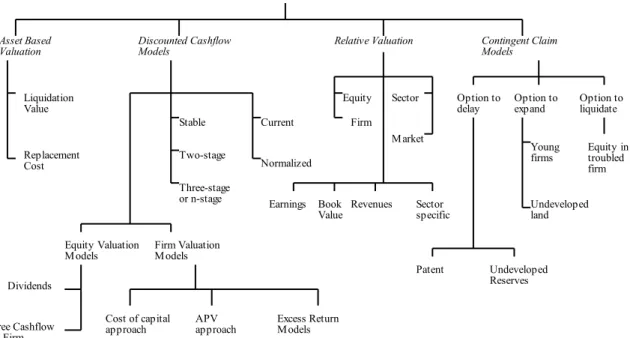
So, considering that and, as regards to Damodaran (2002) point of view, there is a wide group of valuation methods available to be used in the valuation of companies. The following image shows precisely this range of methods.
Figure 1: Valuation Methods. Damodaran Data Valuation Models
Asset Based
Valuation Discounted CashflowModels Relative Valuation Contingent Claim Models
Liquidation Value
Replacement Cost
Equity Valuation
Models Firm ValuationModels
Cost of capital
approach APVapproach Excess ReturnModels
Stable Two-stage Three-stage or n-stage Current Normalized Equity Firm Earnings Book
Value Revenues Sectorspecific Sector
Market
Option to
delay Option toexpand Option toliquidate
Patent Undeveloped Reserves Young firms Undeveloped land Equity in troubled firm Dividends Free Cashflow to Firm
10 Even if each valuation method may be considered to be “a different way of expressing the same underlying model” (Young, Sullivan, Nokhasteh and Holt, 1999), some of those showed above may be more relevant for the valuation of Cimpor and, hence, not all will be used.
Nevertheless, an explanation of these four main groups of methods will be presented gradually detailed according to their importance for the valuation of the chosen company.
2.1. Asset Based Valuation
Asset Based Valuation is the method where the assets owned by the firm are used as the reference for the valuation of the final value estimate (Damodaran, 2002).
For that reason, assets value has to be estimated and, according to this method, there are two different types to estimate it, the Replacement Cost and the Liquidation Value.
2.1.1. Replacement Cost
In the case of the Replacement Cost, it is the method where the company value is obtained through the evaluation of the cost the company would have to substitute all the assets it currently has (Damodaran, 2002).
2.1.2. Liquidation Value
Concerning the Liquidation Value approach, the company valuation is made “by aggregating the estimated sale proceeds of the assets owned by the firm” (Damodaran, 2002).
Even if these Asset Based Valuation Methods may be used by some analysts, I will not use any of them, since they are solely based on the current assets of a company and do not take into account their future growth potential (Damodaran, 2002). Besides this point, also the fact that both of these approaches are partially expressed through the usage of other methods such as Discounted Cash Flow, Relative Valuation or
11 Contingent Claim methods, turn them, according to Damodaran (2002), into weak alternatives, which reinforces my idea.
2.2. Contingent Claim Valuation
As regards to Brennan (1979) point of view, “Contingent Claim is an asset whose payoff depends upon the value of another underlying asset” and so, according to Damodaran (2002), Contingent Claim valuation is a variant of valuation techniques used to recognize the value of assets whose cash flows are contingent on possible future events occurrence, which is linked to the option pricing models.
Regarding this method, there may be three main types of options in this type of valuation, Option to Delay, Option to Expand and Option to Liquidate.
2.2.1. Option to Delay
The option to delay is related with exclusive rights a company has over a project or product for a determined period, allowing the company to delay the takeover of the project or product to a later date (Damodaran, 2002). And, according to Trigeorgis (1996), “the combination of uncertainty, irreversibility and investment timing flexibility provides the building blocks” of this kind of option.
2.2.2. Option to Expand
The option to expand is seen as a strategic option due to the particularity of taking a project today with the perspective of taking a more valuable one in the future (Damodaran, 2002).
2.2.3. Option to Liquidate
The option to liquidate is the method to value the equity of a distressed company as an option, in a way that the higher the value of the firm is in relation to the face value of the debt, the higher the net payoff on equity will be (Damodaran, 2002).
12 Considering none of the Contingent Claim Methods are ideal for the valuation of a company like Cimpor, they will not be used. Therefore, no further details about each methodology will be extended.
2.3. Discounted Cash Flow Methods
Discounted Cash Flow Valuation is the “foundation on which all other valuation approaches are built” (Damodaran, 2002), which means those who understand the fundamentals of this valuation method will be able to explore and use the other approaches.
The foundation of this valuation is based in the present value of the expected future cash flows that the assets are and will be generating (Damodaran, 2002).
Where, n represents de life of the asset or, as also known, the explicit period, CFt represents the cash flow in a specific period t and r represents the discount rate corresponding to the risk associated to each estimated cash flow.
Besides these variables, another one with a huge importance is the terminal value, which is value from the perpetuity after the explicit period and considering that, from there on, the company evolution will be stable. Normally and depending on the explicit period used, this value is the most significant part of the valuation, therefore the way it is calculated must be as precise as possible.
However, before going into detail through these variables, it is also important to mention the two different approaches used within the Discounted Cash Flow Valuation, which are the Firm Valuation and the Equity Valuation (Fernandez, 2007).
13 2.3.1. Firm Valuation
Considering then the Firm Approach, which is based on the value of all the structure of a company, meaning assets, there may be considered three different methods, the Free Cash Flow to the Firm (FCFF), the Adjusted Present Value (APV) and the Excess Return Models (EVA).
2.3.1.1. Free Cash Flow to the Firm (FCFF)
The Free Cash Flow to the Firm, as a Discounted Cash Flow Model, has a similar formula to the one presented before. However, in this case, a specific Cash Flow is going to be estimated and used to obtain the value of the company, which is the Free Cash Flow to the Firm (FCFF). This represents the cash of a firm in a determined period after deducting expenses, taxes and investment needs.
2.3.1.2. Adjusted Present Value (APV)
According to Damodaran (2002), Adjusted Present Value is the method “to value the firm in pieces, beginning with its operations and adding the effects on value of debt and other non-equity claims”.
Value = Unlevered Firm Value + PV of Tax benefits of Debt
– Expected Bankruptcy Cost
Its main advantage is the possibility to see how much an asset worth individually and from where the value is coming, since all different pieces are well disaggregated, which gives the chance to have more relevant information about the company (Luehrman, 1997).
2.3.1.3. Excess Return Model (EVA)
If in conventional Discounted Cash Flow models the valuation is made by calculating the present values of all cash flows created by the assets at a specific discount rate, in
14 the Excess Return Model the valuation is based on the excessive cash flows, which means only the cash flows earned by excess of the required rate of return can be added to the amount invested in the asset to estimate its value.
EVA = ( ROIC – WACC ) * Capital Employed
Following what Cheremushkin (2008) mentioned, a company is creating value if the return obtained from the capital employed is higher than the cost of using this capital, giving the managers an important tool to measure the success of the company.
2.3.2. Equity Valuation
Regarding the Equity Approach, which is only based on the value of the equity of the company, there may be considered two different methods, the Free Cash Flow to the Equity (FCFE) and the Dividend Discount Model (DDM).
2.3.2.1. Free Cash Flow to the Equity (FCFE)
Much like the Free Cash Flow to the Firm (FCFF), the Free Cash Flow to the Equity (FCFE) works the same way, the difference is that cash flows used came directly from the equity value, meaning that “the cash flows left over after debt payments and reinvestment needs are the Free Cash Flows to the Equity (FCFE)” (Damodaran, 2002).
Where, the cash flow for the equity is discounted at the cost of the equity (ke). 2.3.2.2. Dividend Discount Model (DDM)
The Dividend Discount Model (DDM) is a type of valuation where the value of the company’s equity is based on the valuation of the stock through the sum of all the future dividends discounted at a specific rate.
t=n 1 = t t e t ) k + (1 Equity to CF = Equity of Value15 Where, the DPS is the dividend per share of a specific period discounted, once again, at the cost of equity (ke).
Even if it is a method that is easily applied and logic, some researchers argue that it is somehow limited due to the fact that, as Shiller (1981) affirmed, the stock price volatility may vary more frequently than the dividends volatility.
So, following what Damodaran (2002) stated, it is a method more suited to companies that have stable growth rates and in a mature stage, which allows us to better estimate the future dividends and express the final value of the stock at more realistic values, since the mature companies have the capacity to pay the dividends more in accordance with their real dimension and value.
2.3.3. Valuation Variables
2.3.3.1. Capital Asset Pricing Model (CAPM)
CAPM is the model used in pricing securities that explains the correlation between risk and expected return, which means it is the model used to evaluate the required rate of return of an asset. Considering investors are well diversified, the cost of equity is not the only parameter that matters, but the impact of an asset in the global view. That is why this model only considers the systematic risk, which will make it focus on three important variables: the risk free rate, the beta and the equity risk premium.
Ke = Rf + ß . (Rm – Rf)
Where, the cost of equity (Ke) is equal to the risk free rate (Rf) plus the multiplication of the beta (ß) with the equity risk premium (Rm – Rf).
2.3.3.2. Risk Free Rate
Considering the Risk Free Rate is the return rate of an investment with no risk of losing the money invested, which means, it is the interest rate an investor would ask for a risk free investment, the government securities are the investments that present the proper rates for that effect.
16 And, as Copeland (2000) states, the rates of the 10-year Treasury bonds are the most suitable to be applied as a risk free rate when compared with other Treasury bonds with different durations. It means, the 10-year Treasury bonds are better linked with cash flows duration of valued companies than shorter term Treasury bonds and are also more accurate about inflation matters than longer term Treasury bonds.
2.3.3.3. Beta (ß)
Regarding the Levinson (2006) appreciation, the Beta describes the relation between the returns of a stock or portfolio and the returns of the financial market or a market index as a whole.
In order to obtain the Beta value, one can do a regression between the returns mentioned previously, which can somehow be misleading, since, according to what Damodaran (2002) said, sometimes the standard error ends up being considerable high, meaning that the Beta obtained is not reliable.
However, to surpass this difficulty, Copeland (2000) proposed to be used the public estimated betas for a specific company with a comparison with the betas of the industry that are typically steadier than the individual betas of the company.
Moreover, a comparison with the betas of a range of companies from the same business area of the one being valued can also be relevant if the chosen companies are admissible to be considered similar companies and if the comparables used are the most suitable for the companies and industry that are being evaluated.
2.3.3.4. Equity Risk Premium
As regards to the Equity Risk Premium, it is defined to be the excess return that a stock has to pay when compared to a risk free one, in a logic that, the higher the risk of the stock, the higher the premium that has to be paid to the investors. In the case of Cimpor, the higher the risk of a country where the company operates, the higher the premium that is going to be asked.
Regarding this matter, there are two possible scenarios that can be applied when valuing a company. The first one is to allocate the premium related to risk in the expected cash flows, in a way that the cash flows already express the risk of the country (James and
17 Koller, 2000). While in Damodaran (2002) perspective, the possibility that must be used is the one that adds the premium related to the risk of each country to the respective discount rate, which may reflect the risk of a country in a more reasonable way.
2.3.3.5. Exchange Rate
Considering Bartov and Bodnar (1994) approach, “it is a widely held view that exchange rate movement should affect the value of a firm” and, in the case of valuations where companies or subsidiaries have different currencies, which is exactly what happens with Cimpor, exchange rates must be deeply considered.
For that purpose, there are two possible scenarios to be applied and, according to Kester (1997), they are related with the conversion of the cash flows. If the cash flows were converted primarily to the home currency, then the discount rate used will be the same as if it was a home currency company or subsidiary. If the cash flows were not converted primarily, then the forecasted exchange rate will have to be added posteriorly to the discount rate.
2.3.3.6. Tax Rate
Also considering a situation of cross border valuation, tax rates are also an important matter to be considered and, in this case, two possible patterns may be followed.
One is related with the usage of a singular tax rate, where the tax rates from each country are verified and, then, the highest tax rate from the verified countries where the company operates will end up being the one to be paid. The second is linked with a scenario where there is a different tax rate for each case, which means that for each different country, a different tax rate will be paid.
2.3.3.7. Terminal Value
Considering Damodaran (2002) point of view, there are three different ways to estimate the Terminal Value, which are the Liquidation Value, the Multiples Approach and the Stable Growth Model.
The Liquidation Value may be used when the company assets can be marketable, which allows to calculate the total value of the company through the price of all its assets.
18 The Multiples Approach may be considered the simpler approach, however it would not be consistent with the discounted cash flow valuation anymore, since this terminal value calculation method would be based on relative valuation.
The Stable Growth Model is the referred to be the most appropriate method. Since cash flows cannot be estimated for an infinite period of time, when the company reaches the point where its growth is at a stable pace, cash flows can stop being estimated, in order to calculate the value of the company at that particular moment, the Terminal Value. Nevertheless, this may be hard to do, considering that judgments about the growth rate turning point and the excess returns that will be earned from then on.
However, if using the Stable Growth model, the formula to calculate the Terminal Value may be as simple as follows (Damodaran, 2002):
Where, r is the cost of capital and the g is the expected growth rate.
If we also bear in mind the conclusions of Young (1999) where he states that the shorter the explicit period, the bigger the importance of Terminal Value, we may observe how important this value in a valuation of a company is. Nonetheless, in the case of Cimpor valuation, terminal value ends up to do not have a so important role due to the fact that Cimpor is a cyclical company, which requires a much longer explicit period and, consequently, a decrease of the Terminal Value importance.
2.3.3.8. Cyclical Companies
Regarding the Heer and Koller (2000) approach to the theme, cyclical companies are “in industries prone to significant swings in profitability” and, as referred previously, Cimpor is one of them. Present in the cement industry, Cimpor is clearly exposed to the economic situation of the countries where it is established, meaning that the stronger the economic condition of a country, the higher the probability of a bigger cement consumption in there.
Considering that, cyclical companies go through different cycles and, as Damodaran (2002) defends, “the earnings and cash flows of cyclical firms tend to follow the
19 economy”, which means they will be “rising during the economic booms and falling during the recessions”.
So, in order to avoid an overvaluation or an undervaluation according to the specific cycle where the company is, a longer explicit period of forecasted cash flows will be considered, as a way soften the importance of the recent economic cycle and to cover all the possible ups and downs.
2.3.3.9. Emerging Markets
Cimpor, as a multinational company, has a great part of its operations in emerging markets. Therefore, it is important to know what are the particularities these markets have in relation to the developed ones.
Some, like James and Koller (2000), believe that the risks of investing in developing markets are much bigger than in the developed ones and that a lot of investors are not considering it correctly. In their opinion, the usual country risk premiums that are added to reference market premium are not enough for the accountability of the real risks of such markets. So, what they purpose to overcome this and make investors really understand the real risks is, as partially mentioned before in the equity risk premium section, the method of “accounting for these risks in the cash flows through probably-weighted scenarios” that will provide “both a more solid analytical foundation and a more robust understanding of how value might be created”.
However, in the Goedhart and Haden (2003) opinion, emerging markets may not be riskier than developed ones if a portfolio perspective was taken on corporate investments, which means “the cost of capital for emerging markets may well reveal that it is lower if the diversification of portfolios and true exposure to country risk premium are taken into account”. And for that, Goedhart and Haden (2003) do not take a so conservative approach and believe that “either cash flow scenario approach or a country risk premium can produce accurate valuations”, which looking to Cimpor current situation seems to be a correct perspective.
20 2.4. Relative Valuation
Relative valuation has as its main goal the comparison between the value of a company with the value of similar companies. In other words, it may be considered to be a method where the value of a company is calculated based on the value of specific factors or multiples from a group of similar companies (Lie, 2002).
Considering so, Goedhart (2005) affirms that relative valuation may not be seen as a primary valuation method, since its main quality is to compare the company value with the other companies’ values, which may in turn help to make more accurate assumptions for a primary and more solid method.
Relative valuation is considered to be an easier method to be used and understood, however, Liu (2007) pointed out that forward-looking multiples are the most appropriate for a valuation of this type, which can lead to an increase in the complexity and acceptability of the method when compared with the valuation using multiples solely based on historical data.
2.4.1. Multiples Categories
In view of Damodaran (2002), relative valuation can be categorized in two main multiples categories, the equity multiples and the firm value multiples. These categories can, in turn, also be divided according to different scaling variables, which are the earnings, the book value, the revenues and the industry specific variables.
It is hard to say what type of multiple is the best to be used in firm valuation, since different industries and different companies may have particular characteristics that may require different multiples, however, the most commonly used multiples are the ones related with the scaling variable earnings, such as the Price to Earnings Ratio (PER) or the Enterprise Value multiple.
Even though, these two multiples are the most used, the Price to Earnings Ratio (PER) is assumed to be an equity multiple, while the Enterprise Value multiple is considered a firm value one. For that reason, there are consistent differences in their consistency and outcomes, which led Goedhart (2005) to affirm that multiples like Enterprise Value can be more reliable than multiples like Price to Earnings Ratio (PER), since changes in
21 capital structure would not influence so considerably the EBITDA of the Enterprise Value multiple as they would do with the earnings of the Price to Earnings Ratio (PER).
2.4.2. Peer Group
Also with a huge importance for the reliability of a relative valuation, there is the choice of the peer group, which is the group of companies with similar characteristics that can be compared with the company we are valuing.
It is important to comprehend that companies from the peer group may not be equal to the one being valued and, then, they will present different characteristics or comparables. That means we must not look for companies with values exactly equal to those of our company, but look for values within a range we believe that may be in the same pattern of our company.
Normally, the peer group is chosen taking into consideration the companies within the same industry, assuming they may have more similarities to our company than others that are in other type of business. And, according to Goedhart (2005), the comparables that must finally be considered are the Return On Invested Capital (ROIC) and the sales growth.
22
3. Company Overview
3.1. Company Description
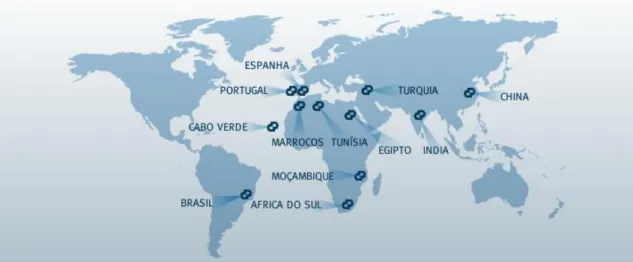
Cimpor is the biggest Portuguese cement company. It was founded in 1976 and, since then, an expansion strategy around the World has been adopted, meaning that, nowadays, Cimpor is present in 12 countries in 4 different Continents.
Figure 2: Cimpor Presence in the World. Cimpor Data
Cimpor is based in Portugal, but its expansion strategy made the company more than just a big player in Portugal, it is nowadays one of the top 10 biggest cement companies in the World.
That strategy have allowed Cimpor to grow considerably, since the markets where the company has been investing are, as it can be seen, mostly emerging ones, being Portugal and Spain the only exceptions.
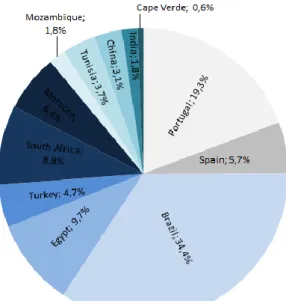
The increasing demand for companies like Cimpor in emerging countries is a fundamental point for the international presence of the company and, even if these emerging markets still provide future growth opportunities, these markets already represent a huge stake of the company activity with 75% of the total EBITDA contribution for the company, being Brazil the most important within the group of 10 emerging countries with 34,4% of EBITDA contribution.
23
Figure 3: EBITDA Contribution. Author’s Calculations
3.2. Shareholder Structure
Regarding the shareholder structure, it faced a significant change in December of 2009 when two Brazilian companies, Camargo Corrêa and Votorantim, acquired more than half of the entire stake of Cimpor. Both companies control now together 54,1% of the company.
24 However, considering Cimpor has a considerable market share in Brazil ciment market, this operation raised questions about the intentions of Camargo Corrêa and Votorantim, meaning that with this control over Cimpor, both companies could reach an agreement about Brazilian cement market, gaining control over that market and, consequently, avoiding competition.
Therefore, if such situation is confirmed, there are two possible scenarios that may happen to maintain a fair competition scenario in Brazil: or, both Brazilian companies are demanded to change their percentage in Cimpor’s share capital by the Economic Defense Board of Brazil; or, Cimpor may be forced to sell all its assets in Brazil.
So, it is a theme that may be considered in the future, since a modification of this type in the company structure could bring different outcomes and, as expected, a different value for the company as well.
3.3. Historical Performance
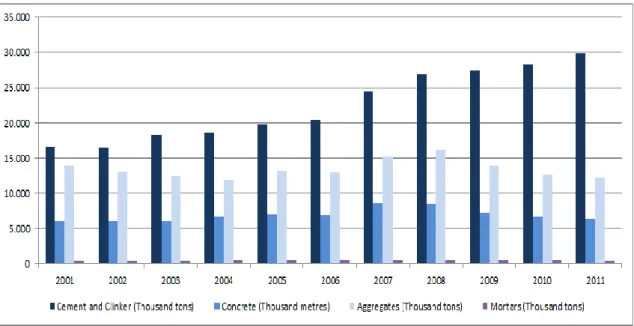
As regards to some historical figures from the company performance, it can be highlighted the evolution of the different types of company sales.
25 The major company sales always came from the cement and clinker, but the evolution through the last decade has shown how important that is when compared with the other types of cement materials. Not only the cement and clinker sales have exponentially grown year to year, but also the other cement materials faced, mainly from 2008 on, considerable decreases.
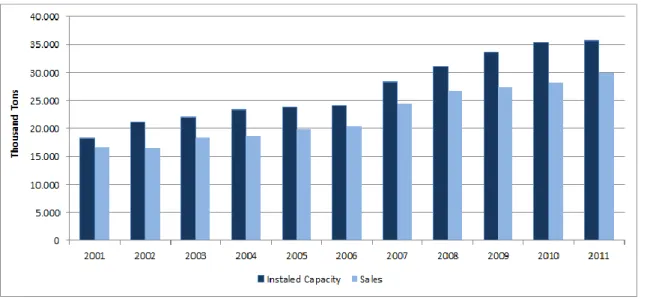
Considering that, the main installed capacity for production of cement units in Cimpor is then related to cement and clinker materials, the following figure precisely shows that the installed capacity of the company has been following the increase in sales verified in the last years.
Figure 6: Cement and Clinker Activity. Cimpor Data / Author’s Calculations
Even though, the increasing trend for both sales and installed capacity has been verified, it is also observable that, since 2008, sales increases have been slower than the installed capacity increases, which was a result of the crisis emerged in that same period.
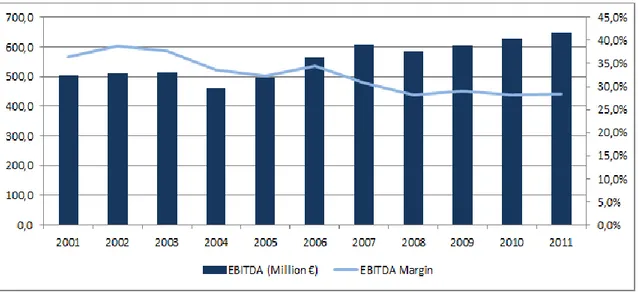
Concerning to the EBITDA, Cimpor showed an average increase in its EBITDA volume on the last few years due to an important factor for the company, that is efficiency. Sales increases may be useless if they are not followed by an efficient usage of the resources and control of costs. In the case of Cimpor, it is part of their strategy and, for that reason, Cimpor has one the best EBITDA Margins of the whole cement industry.
26
Figure 7: EBITDA and EBITDA Margin Evolution. Cimpor Data / Author’s Calculations
Even if the Cimpor EBITDA margin has been reducing all over the years due to the natural increase in materials and resources costs, the control of expenditures made by the company has been efficient enough to keep the EBITDA margin performance above the competitors average.
As regards to the market price of Cimpor shares in a yearly end base, the range of values vary between 4 euros and 6,50 euros since 2003, being 2008 and 2009, two subsequent years, the years where the highest peaks were verified.
27 In 2008, the crisis arrival made the share market price go down to the lowest value seen since then. While in 2009, the price reached its peak since 2003 due to multiple interests and offers from the Brazilian companies to the Portuguese cement company.
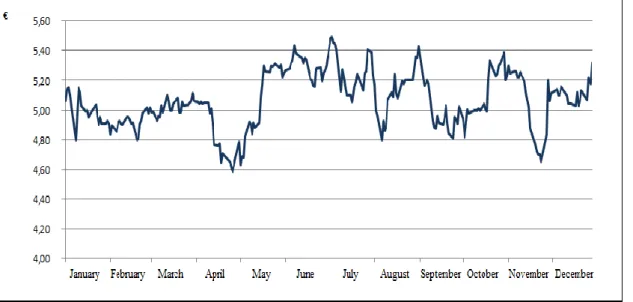
As regards to the 2011 year and the daily share market prices, it was verified a constant change, being the peak price of the year in the 4th of July with a value of 5,49 euros and the bottom price in the 28th of April with a value of 4,59 euros.
Figure 9: 2011 Daily Evolution of Share Market Price. Author’s Calculations
3.4. Company Future Strategy
As future prospects for the company, Cimpor has decided to follow a series of strategies. One of them is related with the solidification of the actual positions of the company around the World, either by reinforcing these positions or by penetrating even further in those markets where the company is already present but that may have more opportunities available to be explored.
A weighted equilibrium between emerging markets and more consolidated markets is also an important factor to be considered, in a way that consolidated markets may be valuable due to the inferior quantity of risks and emerging markets due to a range of new opportunities. In those markets where Cimpor has already a strong presence, organic growth may be the option, while in the markets where Cimpor has not a so
28 relevant position, inorganic growth through acquisitions may be the more obvious target.
And, also the already referred optimization of the operations, through the reduction of the costs and the usage of the company synergies as an advantage, is also a priority.
29
4. Industry Overview
4.1. Industry Description
Cimpor operates in the cement industry, which is considered to be an industry where a lot of capital is required and, thus, a capital intensive industry. This fact means there is an advantage for the players already present in the industry, since it is a high entry barrier, but may also be seen as a disadvantage, as any wrong investment decision can mean huge losses for a company. So, in an industry like the cement one, all the decisions must be meticulously studied and analyzed.
In the cement industry, where huge amounts of cement are produced annually, economies of scale turn out to be an important factor for the companies. Then, companies try to expand to other markets in order to gain the dimension needed to take the best possible advantage over these economies of scale. This expansion is a real driver for the companies in the industry, since there are markets more profitable than others and, by expanding for other regions, companies are not only going to meet new challenges with new opportunities, but they are also going to avoid risks by not being so exposed to just a reduced number of markets.
4.2. Cement Production and Consumption
It is also an industry where the transportation costs are considerably high, which means it is not an easily traded commodity. As so, traded cement takes no big relevance in the industry, meaning that wherever the cement demand is higher, the cement production in that region will be higher as well.
30
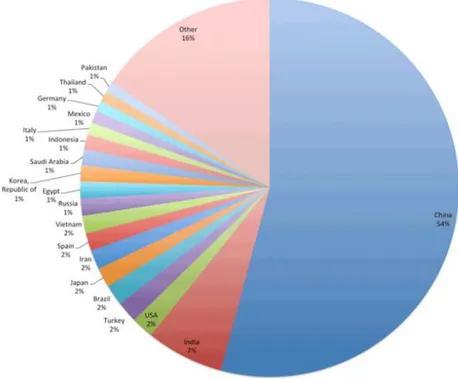
Figure 10: Cement Production. USGS Mineral Program Cement Report
As shown in the chart, China is by far the largest cement producer, which is naturally linked with their high consumption needs that, in turn, are also related with the population size and growth verified in the country. However, population size and growth are not the only drivers for higher rates of cement consumption. Gross Domestic Product (GDP) is also an important one. It means that, in this industry, GDP per capita influences directly the cement consumption units.
31 The graphic above illustrates the way consumption works according to the GDP per capita and it is observable that there is a verified intermediate range of GDP per capita where the consumption rates are higher than in any other stage. And, if for low GDP per capita rates, low cement consumption is expected; for high GDP per capita rates, the opposite does not verify, since the construction of infrastructures in these regions are already in place and there is no need for more constructions, which means the consumption levels are not as high as expected due to the inexistence of growth.
Even though, it may be divided into three different types of markets.
The first is the market based on the mentioned countries with high levels of GDP per capita, where there is no more need to keep building and so, stable and medium levels of cement consumption are observed. Developed countries are good examples of this first type of market.
The second is composed by countries where the levels of GDP per capita are at an intermediate level and growing, which normally means the countries are also developing and building infrastructures. These are the countries where higher levels of cement consumption are observed and where Cimpor and the industry big players have been marking their position. Brazil and China are two of the best examples of these types of countries.
The third type of market is composed by countries with low GDP per capita levels, where not much development has been seen. However, these are the countries that may in the future represent the second type of market and, for that reason, they can be considered good regions to be target in medium/long term. The majority of African and Asian countries are good examples of this market.
4.3. Cement Prices
As regards to cement prices, they may differ according to the place where we are. So, following what was mentioned about the high transportation costs, the cement prices will be defined region by region, where there is a sort of factors that influence it, being
32 one of the most important, the association between demand and supply, which means the bigger the demand in relation to supply, the bigger the price can be and vice-versa. However, other factors may not let this rationale to be that straight. One of them is competition. In this case, whenever there is a high competition market with a lot players, no matter what are the circumstances, the prices may tend to be lower. Countries or regions where the production costs are lower may also be likely to have lower prices. And, in the cases where the market is controlled by few players and there are high entry barriers, the prices tend contrary to be higher.
4.4. Industry Dynamics Analysis
If an analysis is done to the industry through the five competitive forces of Porter, it is generally agreed that cement industry is a good industry for the big players that are already in exercise.
Concerning the bargaining power of customers, it may be considered to be low, since prices are definitely defined locally and cement companies have a considerable control over the distribution channels.
The bargaining power of suppliers is normally low as well, because cement players, due to their naturally big dimension, may normally be the biggest clients of suppliers, which inhibits suppliers to exercise pressure on the prices and conditions in order to do not lose a so important stake of its revenues.
As regards to the threat of new entrants, it has also a low level, since there are high barriers to entry, like the huge investments that have to be done, which may be not a good idea in an industry that is controlled by a group of few big players due to their power, dimension and, consequently, economies of scale advantages.
The threat of substitute products is negligible, since cement may not really be substituted by any other product, which means there is no other product that provides the same characteristics that cement does. Even if wood, steel, or rocks could be seen as possible substitutes, cement characteristics would not be equalized. For that reason, there is no threat of substitute products.
33 To what concerns to competitive rivalry within the industry, it is not considered to be high, since there are a restricted group of companies that control the market. For that reason and as a way to preserve the margins, there is not an intensive rivalry between the common industry players.
4.5. Main Industry Players
As mentioned before, cement industry is an industry controlled by a few number of big players that are present in the most important markets around the World. The scrutiny of the biggest players may be done according to different factors or measures and, besides the sales volume and the international presence around the World, the capacity each company have is also a defining one.
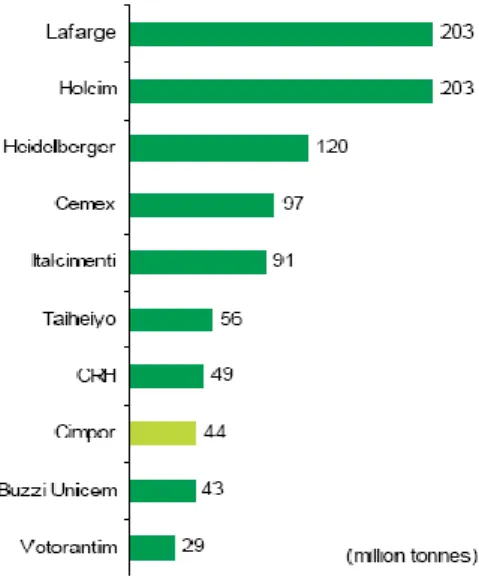
Figure 12: World Ranking of Grinding Capacity. Espírito Santo Equity Research
So, the range of grinding capacities where the top ten companies are included is between the 203 million tones and the 29 million tones, which is a significant difference and is mainly due to the verified high grinding capacity from the top two companies in the ranking, Lafarge and Holcim. Cimpor also assumes itself as a relevant presence in this ranking with a grinding capacity of 44 million tones, representing the eighth place within ranking.
Still, if we wish to consider other measures to reinforce the idea about who really are the main players, EBITDA margins may be a useful one.
34
Figure 13: World Ranking of EBITDA Margins. Espírito Santo Equity Research
In this case, The EBITDA margins range of the top cement companies vary between 29,1% and 10,4%, which is also a considerable difference. But here, Cimpor is by far the best cement company. It shows how efficient the company is and, mainly, proves that even if it has not the same huge dimension of other big players, Cimpor offset this difference with a much higher efficiency and control of operations, which is a signal of success from a company that is in the business since a long time ago.
35
5. Valuation
5.1. Assumptions
5.1.1. Valuation Approach
Equity valuation of Cimpor will consist on the Discounted Cash Flow method, where different Free Cash Flows to the Firm (FCFF) will be determined for each operating segment of Cimpor, which, in this case, are the different countries where the company is present, and then discounted at specific Weighted Average Costs of Capital (WACC) that are according to the corresponding risks of each country. Regarding these parameters, it is important to mention that both will be presented in Euros.
As regards to the type of company that Cimpor is, there is also an important measure that must be considered, the explicit period. Cimpor is a cyclical company and that means there may be different seasons where the sales volume is considerably higher/lower than others. To avoid miscalculations for the company final value, an explicit period of 30 years will be used.
Analysts from the Portuguese investment banks diverge in the explicit periods used, using ranges between 10 and 40 years, but if the previous cycles were analyzed, it is observable that a 30 years explicit period may be the one that better covers all the macro economic variables discrepancies that influence the cycles, such as cement consumption, gross domestic product evolution, inflation and exchange rates.
Therefore, the explicit period will end at 2041 and, from then on, a stable growth will be expected, which means the terminal value will be determined taking into account the rate observed in 2041.
Afterwards, a Relative Valuation will be done in order to realize if the value obtained through the Discounted Cash Flow method is consistent with the use of another valuation method.
For that, the peer group choice was based, as mentioned before in the literature review, in two factors: the similarity between Cimpor and competitors in terms of Return On Invested Capital (ROIC) and sales growth. In the case of ROIC, as a way to be
36 considered, a competitor ROIC should not have a difference for the Cimpor ROIC bigger than 2%, upwards or downwards, while in the case of sales growth, the difference should not be bigger than 1%.
Having the peer group chosen, the multiples selected were the Price to Earnings Ratio (P/E) and the Enterprise Value / EBITDA (EV/EBTIDA) and, to decide the final average value of the peer group for these multiples, backward-looking multiples were used. Even though, forward-looking multiples were a better choice, such as mentioned in the literature review as well, due to lack of data, trailing multiples were the ones chosen.
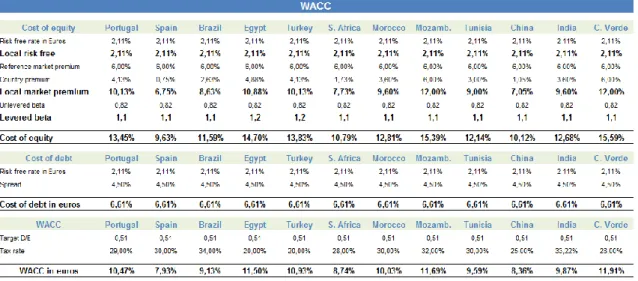
5.1.2. Weighted Average Cost of Capital (WACC)
Regarding the Weighted Average Cost of Capital, it is important to know which values were attributed to the variables that will allow to calculate it through the Capital Asset Pricing Model (CAPM).
So, considering the risk free rate, the value attributed was 2,11%, which corresponds to the 10-years German bonds due to the fact that these are the treasury bonds that better represent a riskless investment.
As regards to the local market premium, it is added to the reference market premium a country risk premium to reflect the real risk of each country. Then, it was attributed a value of 6% to the reference market premium, which is mainly related with two reasons, the first is the fact that Damodaran considers a reference risk premium rate of 5% to be the right value for the developed countries, however, as the second reason, analysts tend to assume increasingly higher rates due to the current uncertain worldwide economic situation, which made me believe 6% is the most suitable value. To the country risk premium, it was obviously attributed different values for each country according to the Damodaran evaluations, which give us a range between 0,75% for Spain and 6% for Cape Verde.
About the levered beta, it was calculated through the unlevered beta, 0,82, that was determined also bearing in mind the Damodaran evaluations, but in this case for the unlevered beta values for building materials.
37 As concerns to the cost of debt, in order to be calculated, a spread must be added to the risk free rate already presented. So, considering that, a spread of 4,50% was attributed. It was based on a fact that, even if historical spreads for Cimpor are around 3%, the current situation demands a higher spread than this one and, for that reason, an increase close to 1,5% was made.
Taking into consideration the target D/E, it was assumed a value of 50%, since this ratio has been verified as closely similar to the company’s historical values.
About the tax rates, these were defined according to the current corporate tax rates of each country.
Figure 14: Weighted Average Costs of Capital for each country. Author’s Calculations
5.1.3. Cement Consumption
Cement consumption is an important factor to know how successful Cimpor can be with its sales in each country where the company is present and, therefore, it is important that it is carefully calculated and forecasted. For that, as it was referred before, the GDP per capita of each country is considered to be a relevant driver for the cement consumption in each country.
Normally, a country with low GDP per capita has a lower rate of cement consumption, which is expected to increase if the GDP per capita increases as well. However, an infinite increase of cement consumption is not reasonable, because since a country reaches a more developed level, it does not need any more to build so many
38 infrastructures, reducing the cement consumption level to a stable rate that should be maintained from then on.
The cement consumption used in this thesis as a way to value Cimpor is based on a study done by BES Investimento, where an analysis of the future evolution of GDP per capita was executed for each country where Cimpor is present and then linked with the cement consumption per capita that is possibly going to occur. From these cement consumption per capita is then obtained the total cement consumption in each country through the population growth analysis, multiplying the total forecasted population in each year and country for the corresponding cement consumption per capita.
The following figures show, not only the correlation between the GDP per capita and cement consumption per capita verified in 2011, but also the forecasted correlation between both factors in 2041, the final year of the explicit period.
Figure 15: 2011 Cement Consumption per Capita. Espírito Santo Equity Research
39 5.1.4. Total Sales
Regarding the sales that are a base for the whole valuation, its calculation was based on the cement consumption that occurs in each country and the respective market share of Cimpor in those countries.
It may seem a too much straight method due to possible unrealistic market shares, but the truth is that cement industry is quite steady when regards to market shares, which means there are no big changes in this aspect as the time passes. The control exercised in the industry by a minority of big players allows their market shares to remain almost unchanged.
The fact that Cimpor market shares have been quite stable in the past few years seems a good indicator that they may not change too much in the following ones.
Figure 17: Revenues Aggregated by Country. Author’s Calculations
Obviously, as mentioned before, all the values are computed in euros, which means the exchange rates for each single year, had to be calculated. In order to apply the correct prices in each country, inflation rates were considered to be the most important factor affecting them and to calculate them according to that, every single year the prices in euros were recalculated in their local currency and then were added with the inflation rate of each specific country, concluding with the reconversion of the prices for the euro currency.
40 Therefore, the inflation rates used in the first five years in analysis were obtained from data of International Monetary Fund, while for the remaining years until 2041, the rates used were attributed according with an approximation to the Eurozone inflation of 1,5%.
As concerns to exchange rates itself, the rates used in the first five years in analysis were obtained from spot and forward rates, while for the remaining years until 2041, the rates used were attributed according with the differences in inflation between the Eurozone and each specific country.
Figure 18: Inflation Rates. International Monetary Fund and Author’s Calculations
41 5.1.5. Total Costs
Considering the costs may be divided into fixed and variable costs, it has been observable that historically, the balance between these two types of costs tends to put more weight on the variable costs side with values that round the 70% of the total costs, attributing the others 30% to the fixed ones.
On the side of fixed costs, they will be calculated taking into account the total capacity available for each year in each country and the cost per ton of each unit of that quantity. This cost per ton of each unit is obtained through the division of the total value of fixed costs by the total capacity to which is then added lately a crucial variable that is not only important for the prices of cement, but also here, the local inflation rate.
For the case of variable costs, the only difference is that the total capacity here is no longer important, but the cement sold is, which means the cement sold multiplied by the cost of each ton of cement sold with the also added yearly local inflation will provide the total variable costs.
5.1.6. Depreciation
As regards to depreciation, it was assumed that the depreciation period was 20 years and the acceleration rate of maintenance expenses was 12%.
And, for the depreciation calculation, in a first stage, it is calculated the difference the previous year depreciation and the current year maintenance expenses, which is followed by the multiplication of that result by the 12% rate of acceleration of maintenance expenses and, then, to this result is subtracted again the depreciation value of the previous year.
5.1.7. Working Capital
In the last few years, working capital has been noticing higher values, that are around 15,5% to 16% of the sales, than it was used to some more years ago when they were around 12% to 13% of the sales. So, as a way to follow this pattern and to be in accordance to capital needs linked with the asset and liability accounts verified in the year 2011, the working capital will be assumed to have a value a little bit higher than in
42 the previous years, but that is expected to stand steady from then on. This value will be 16,8% of the sales.
5.1.8. Capital Expenditures
According to company data, it is described to have three different types of relevant expenses that must be considered, which are the maintenance expenses, the investment expenses and the dispose expenses. The maintenance expenses, as the name itself says, are related with the money Cimpor spends with the maintenance with its entire capacity in each different country. The investment expenses are basically the money spent with required extra units. While, the dispose expenses work much like a save that is obtained due to the dispose of the current capacity.
Therefore, the total capacity Cimpor has in each country is fundamental to calculate these expenses referred above, in a way that the capacity variances will be used to estimate the dispose and investment expenses, while the total current capacity will be used to estimate the actual maintenance expenses.
In the end, the total value of capital expenditures will be achieved through the sum of maintenance expenses with investment expenses, followed by the subtraction of the dispose expenses.
5.1.9. Debt
Regarding debt levels, Cimpor has almost always been able to keep them steady, in a way that practically there has been no need to ask for higher amounts of debt to pay its yearly investments. It is also expectable that Cimpor does not need to ask for higher amounts of debt in the next few years.
Therefore, since the company recurrent D/E ratio is around 50%, this was the amount assumed as the D/E ratio for the coming years.
Also, as a consequence of a stable debt level for the coming years, which implies regular investment needs as well, the dividends paid will start to increase. It is due to the fact that net income will be increasing constantly throughout the explicit period, while the investment needs will not, meaning that excess cash would be increasing
43 infinitely. In order to avoid this situation, the excess cash will then be reverted to an increase in the dividends payments.
As concerns to the net debt for each year, to the sum of loans and leases from current and non-current liabilities it will be subtracted the existent cash from current assets and then, the value will be estimated.
5.2. Countries’ Valuation
5.2.1. Portugal
Portugal may be seen as one of the major markets where Cimpor operates, not only because it is the home country of the company and where the company has one of its biggest structures with 3 plants, but also because it is the market where Cimpor is a leader. In the Portuguese cement market there are two cement players, apart from Cimpor, there is Secil, which accounts for a market share rounding the 45%, while Cimpor takes the other 55%.
Portuguese cement market may be considered one of those already mentioned developed markets, where the infrastructures were almost all built, which means its attractiveness is no longer as good as it was before. It represents a decrease in the cement consumption per capita, which was also intensified by the current economic difficulties that have been faced
Cimpor tried to solve the decrease of cement consumption in Portugal with the exportation of cement to Spain and Egypt. However, Spain, such as Portugal, has a quite similar situation in terms of infrastructure developments and, if before capacity utilization of Portuguese plants was around 90%, now it is around 60%, which was something that exports to Egypt did not make up as well.
As the time tends to pass, the situation may not improve much more than it is now. Obviously, after the current economic downturn, the cement consumption may recover a little bit, but in fact, there will be no huge growth rates and developments, since Portugal has already almost everything that is needed in terms of infrastructures.
44 Therefore, I estimated an enterprise value for Cimpor operations in Portugal by the end of 2011 of 836,4 million euros. As regards to EBITDA, I believe 2012 will still be a poor year as it was in 2011, but in 2013 there may be a small turnaround that may lead its value to increase, due to what I think that is going to be the future of the country, that may no longer ask only for increases in austerity, but also increases in economy dynamic.
Figure 20: Valuation Table of Cimpor in Portugal. Author’s Calculations
5.2.2. Spain
Spain, the other Iberian market where Cimpor is also present, is also an important market for Portugal, not only for its strategic link between Portugal and all the other markets that are plated by the Mediterranean Sea where Cimpor is present, but also by all the structures Cimpor has in the country. With 4 cement plants there, Cimpor accounts for a market share rounding the 10%.
Such as Portugal, Spain was used to have high levels of cement consumption, but economic crisis also played here an important role, leading the consumption to decrease significantly in the last few years. If before Cimpor cement plants in Spain had close to full utilization rates, now they decreased to 75%
Spain is also a developed country that no longer needs infrastructures as emerging countries do and, thus, it is not expected that cement consumption recovers to much higher rates than it is being verified actually. Even though, it is expected to start recovering somehow in middle term and reach stable consumption levels that will prevail in the near future.
45 Considering that, the enterprise value estimated for Cimpor operations in Spain by the end of 2011 was around 466,5 million euros.
Figure 21: Valuation Table of Cimpor in Spain. Author’s Calculations
5.2.3. Brazil
Brazil, also one of the most important markets for Cimpor, is one of the markets where Cimpor is present that has higher possibilities to keep growing and expanding its market dynamic in terms of cement consumption. Even if it has a huge potential to grow, the market dimension is already considerable, meaning that Cimpor has currently in the country 6 cement plants working.
Cimpor has currently a capacity utilization of around 85%, which is expected to keep steady for the coming years, and besides being a considerably high capacity utilization for 6 cement plants, its market share is no more than 10% in the entire Brazilian market. Considering Brazilian market is expanding and, by that, cement consumption growing as well, it is expected that Cimpor keeps increasing its capacity, in order to be able to fulfill the also predictable increase in the demand.
Brazil relevance in the total Cimpor operations is already huge and, in terms of enterprise value, it already accounts for around 35% of the total value of the company. It not only is already important, as it is expected to be even more, and, based on this scenario, the estimated enterprise value of Cimpor operations in Brazil was 1.932,7 million euros by the end of 2011.
46
Figure 22: Valuation Table of Cimpor in Brazil. Author’s Calculations
5.2.4. Egypt
Egypt is one of the African countries that have suffered in the last recent years the biggest increases in cement consumption per capita, which meant great benefits for Cimpor.
The fact that the company only has 1 cement plant in Egypt was a motive to help the capacity of the plants that were placed in Portugal to be better used, since part of the tones produced there were, as mentioned before, exported to Egypt. These exports made the capacity utilization in the Egyptian plant to be around 85%.
Even if Cimpor’s market share in Egypt is no bigger than 7%, for the reasons mentioned above, the Egyptian market is also a relevant market for Cimpor operations.
However, it is believable that cement consumption in Egypt will no longer have so high growth rates as it has been verified recently. Therefore, the estimated enterprise value for Cimpor operations in Egypt was 453,5 million euros by the end of 2011.
47 5.2.5. Turkey
Turkish market is one of the newest markets where Cimpor is present, since the company came to the country in 2007. Cimpor has 4 cement plants installed there and their utilization rate is around the 90%. Its market share is around 6%.
Even if Turkey has a much bigger market in terms of cement consumption than, for instance, the Iberian countries and also a bigger cement consumption per capita than them, since Cimpor came to Turkey, these rates have been decreasing, which means that the output expectations that Cimpor was waiting for are not being completely fulfilled. Anyway, I believe the current cement consumption per capita in the country will remain stable for the coming years and, for that reason, no large changes must be expected in the company and market profile in this region.
Therefore, the estimated enterprise value for Cimpor operations in Turkey was 233,5 million euros by the end of 2011.
Figure 24: Valuation Table of Cimpor in Turkey. Author’s Calculations
5.2.6. South Africa
Cimpor with 1 cement plant installed in South Africa has here good expectations in terms of future growth, since the country, not only has low levels of cement consumption when comparing with other countries with similar GDP per capita, but it also lakes a lot of infrastructures that still need to be built.
Even if EBITDA values are not expected to grow in the coming years, it is predictable that cement consumption per capita in the country starts to match the same levels of