A Work Project presented as part of the requirements for the Award of a Master Degree Management from the NOVA – School of Business and Economics.
THE FUTURE OF VEHICLE FUEL TECHNOLOGY AND HOW IT WILL RESHAPE THE AUTOMOBILE INDUSTRY
ROGÉRIO AFONSO SILVA DOS SANTOS ANTUNES PROENÇA – 31479
A Project carried out on the Master in Management Program, under the supervision of:
António Nogueira Leite
2
Abstract
The automobile industry is on the verge of a major disruptive technology change as electric mobility is threatening the dominance of internal combustion engines. Although the majority of automobile executives would rather invest in hydrogen fuel cell powered vehicles, due to their similarities with traditional infrastructures and recharging methods, the market is moving towards battery powered vehicles, with Tesla’s Model 3 representing its most successful vehicle to date. China and the USA are two of the main countries that have the potential to dominance in the electric segment due to their market acceptance and industry dynamics.
3
Table of Contents
Abstract ...2
Introduction ...4
Methodology ...5
I. Overview of the Automobile Industry ...6
A. Auto Industry Major Players ...6
B. PEST Analysis ...7
C. Moving from ICEs to the Future ...9
D. Strategic Group Mapping of Electric Vehicles ...12
E. Plug-in Electric Vehicles vs Hydrogen Fuel Cell Powered Vehicles...13
II. Driving Forces Behind an Impending Fuel Technology Change ...15
A. Political Bans and Incentives at the Country level ...15
B. Political Bans and Incentives at the City level ...17
C. Strategic Alliances and Technology Sharing Collaborations...17
III. The Next Auto Giants ...19
A. China in the Lead ...19
B. The Potential of the United States ...20
C. McKenzie´s Electric Vehicle Index...22
Conclusion ...24
Limitations ...25
Bibliography ...26
Appendix ...32
Appendix 1 – Global Passenger Vehicle Production in 2017, by Country or Region ...32
Appendix 2 – Number of vehicles manufactured in Europe in 2017, by vehicle type ...32
Appendix 3 - Global Automobile Market Share in 2017 by brand ...33
Appendix 4 – Countries Banning or Considering a Ban on ICE Vehicles ...34
Appendix 5 – Status of ICE Vehicle Phase-Out by Country ...35
Appendix 6 – China´s Five Electric Vehicle Pilot Programs ...36
Appendix 7 – European Vehicle Segmentation ...37
4
Introduction
Over the last years, environmental concerns have gain traction as the world is moving towards a greener future. The automobile industry is no different as it is often accused of being one of the principal contributors for pollution (Unger et al 2010). A combination of governmental influence, public opinion and strategic vision has led the industry to look into its fuel technology.
Fast forward to today, the number one key trend in the automobile industry is electric mobility (KPMG 2017) as an alternative to traditional internal combustion engine vehicles (ICEVs). Currently, there are several different types of electric vehicles that range from fully electric, with battery powered electric vehicles (BEVs) or plug-in electric vehicles (PEVs), to hybrid vehicles, either hybrid electric vehicle (HEVs) that works primarily with a gas engine supported by an electric engine or plug-in electric vehicles (HPEVs) that work in the reverse way. The second most interesting alternative is hydrogen fuel cell powered vehicles (HFCVs) that uses pressurized hydrogen gas as fuel in a process to generate electricity and therefore power to an electric motor (Garland, Papageorgopoulos and Stanford 2012).
This work project will analyse the current fuel technology trend that is moving away from ICEs, considering the two main fuel technologies available, battery powered vehicles and hydrogen fuel cell powered vehicles, and provide a strategic overview of the automobile industry assuming the dominance of electric technology in the future.
5
Methodology
The research approach of this work project can be classified as both inductive and deductive (Saunders, Lewis and Thornhill 2012) as it tries to comprehend the underlying forces of the automobile industry, regarding the evolution of its fuel technology in the first part of the research question, but also tries to deduce its likely future disruptive impact with the use of strategic tools.
The first part of the research question, related to which technology will be dominant in the future, examines the current state of the global automobile industry and its major trends moving into the future. Using a PEST analysis as a strategic tool, will enable to identify the political, economic, social and technological factors that may affect the direction to which the automobile industry is moving in terms of its fuel technology and will enable to examine its implications for the future of the industry. A strategic group mapping will also be used to present a clear representation of the models of electric cars available for consumers at the current moment.
For the second part of the research question, McKenzie´s Electric Vehicle Index rankings will serve as a quantitative method to predict how an impending fuel technology change will affect automobile markets and industries around the world, with an analysis of current positioning and with further predictions on repositioning along the industry market electric vehicle index score (x-axis) and the market electric vehicle index score (y-(x-axis).
6
I.
Overview of the Automobile Industry
A. Auto Industry Major Players
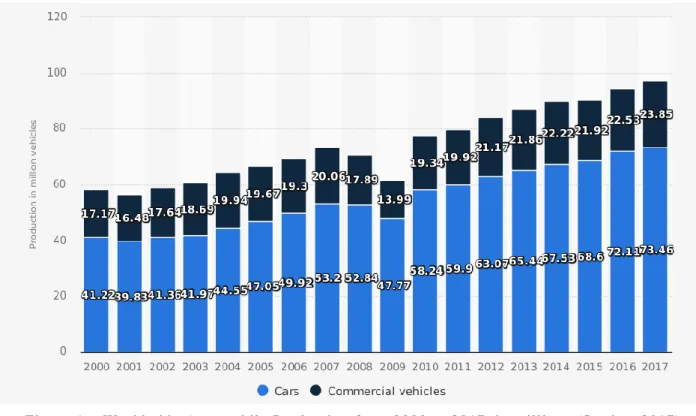
Worldwide production from 2001 to 2017 has being steadily increasing, apart during the 2008-2009 economic crisis. Last year, around 73.5 million vehicles were produced worldwide, led by China, with 24.8 million vehicles in 2017, around 34% of the world´s production, USA and Japan (Appendix 1), followed by Germany, the biggest European vehicle manufacturer (Appendix 2).
In terms of car companies, Toyota is leading the race with global sales in 2018 of 7.23 million, in terms of market share they have 9.2%, They are followed by Volkswagen with 7.2% market share, with total sales of 5.65 million. Ford comes third with 6.5% of market share and 4.68 million sales. Honda, Nissan and Hyundai, all Japanese brands, are close behind, to make it four Japanese brands in the first six (see Appendix 3) (Focus2move 2018).
7
B. PEST Analysis
Political - Environmental concerns have greatly shaped the political influence on the auto industry, which was the largest net contributor of climate change pollution, according to a NASA stud y (Unger et al 2010). Highlighted by the Paris Agreement, governments have committed to reduce harmful emissions and are pushing towards a greener future with the support of the majority of the automobile executives and consumers. Governments have been announcing bans on new ICEVs for the near future, limitations on circulation and parking in some city areas. Incentives are also being put in place to introduce a cultural change and entice consumers to make the change to EVs.
The only opposing view from a government happened recently with the USA withdrawing from the Paris Agreement, which was not well received by American executives who remain committed. GM and Ford issued statements reiterating their “commitment to sustainability” and their intention to “invest heavily in electrification”. Moreover, Elon Musk, CEO of Tesla, resigned from his presidential council position to protest against the government´s decision (Tomolon 2017). Nonetheless, governments in most of the states are deeply committed with several plans in action to continue to push with incentives and bans, most noticeable in California where Governor Jerry Brown has set a goal of 5 million electric vehicles by the end of 2030 (Sisson 2018).
Economical - Fuel prices have always been the major economical factor, as studies show a negative correlation between fuel prices and sales (Unrau 2018). In May 2018, oil price surpassed the 70 dollars per barrel mark, registering a four-year high, mostly due to US pulling out of the Iran nuclear deal, Venezuela´s economic and political unrest, and OPEC cuts (The week 2018).
8 Additionally, the abovementioned political influence in the form of incentives has contributed to a decrease in the price of electric vehicles, decreasing them to a point where a share of consumers believes it is worth it to change from traditional ICE vehicles, especially in China. Furthermore, the price of electric vehicles is expected to continue to decrease as battery packs´ costs decrease (McKenzie 2017).
Social – There are two major social trends that can influence the auto industry in the near future. Firstly, the rise of the middle class in China and India, countries with a combined population over 2 billion people, can see around 300 million consumers looking for middle class mobility solutions in cities experiencing a rapid growth rate, like New Delhi and Beijing. Cities plagued with pollution concerns. Secondly, highly urbanised cities are experiencing a decrease in the willingness for consumers to own vehicles, replacing individual ownership in favour of shared mobility solution, with the rise of alternative solutions such as Uber, Lyft, Drive Now and Ecooltra.
Technological – The automobile industry is currently on the verge of a disruptive technological shift as new powertrains are being develop, threatening to substitute traditional internal combustions engines, namely battery powered electric and hydrogen fuel cell powered vehicles. Moreover, car companies are committed and investing in R&D, which has already considerably decreased the price of battery packs and will continue to make electric powertrains more efficient and affordable. As a response, more efficient ICEs have been developed.
9
C. Moving from ICEs to the Future
There is a consensus around the industry that electric technology will become a major trend in the future. However, a survey conducted by KPMG to automobile executives in 2017, shows how 78% of them see internal combustion engine (ICE) to continue being the most import powertrain in the future, while the possibly disruptive technologies need time for implementation and to create the necessary infrastructures. With the regulations, pledges and targets already created by government bodies (countries and cities), KPMG predicts a regulatory driven market that could see the share of electric vehicles increase to 30% by 2023 (KPMG 2017).
The move to fully electric vehicles, either PEV or HFCV, is not yet viable as companies still can´t assure their customers a better product than they have now with ICEs. This is due to four main concerns: range, infrastructure, battery life and cost. Consumers aren’t sure if an electric vehicle can take them to their destination (range), if there are enough and accessible recharge points when and where they are needed (infrastructure), how long their battery will last (battery life) and the overall cost compared to their current vehicle (Citi GPS 2018).
10 However, car companies developing EVs are working on developing certain advantages in terms of maintenance cost saving, that can also have implications in range, battery life and overall cost, tackling three of the four main aforementioned consumers’ concerns.
Firstly, the regenerative braking technology utilizes the kinetic energy of the breaking process to transfer energy to the battery, instead of wasting it as heat like the traditional braking system, which also increases the range (Gibson 2018). Additionally, in an electric vehicle, this breaking technology allows for the accelerator to be used for acceleration and a quicker deacceleration process as the car starts to break, not coast as a traditional vehicle. Consequently, it decreases the need of a constant use of the breaking pedal, lasting longer. Nissan has developed this technology and has created an “e-Pedal” option that not only slows the car with the regeneration technology but also allows for a full stop, even in steep conditions, making the braking pedal redundant, but will still be there for emergency breaks. Other companies are also developing similar driving conditions, with a Tesla there is the option to choose the exact amount of deacceleration force with the touchpad, whereas in a Chevrolet’s Bolt, this option can be found behind the steering wheel, controlling the extra regeneration and further deacceleration force (Stewart 2017).
Secondly, an electric engine has fewer parts when compared to traditional ICEVs and the overall maintenance cost is three times less. This is mainly due to the aforementioned smaller list of components that reduces the risk of malfunction and consequent replacement, inducing in lesser downtime and costs, another reason is the eliminating of the necessity for oil changes and maintenance associated with internal combustion engines (Gibson 2018).
Thirdly, one of the major concerns consumers have is the life expectancy of batteries and its high replacement costs, as this technology is still being developed. Although it is expensive to replace
11 an EV battery, its rate of degradation is slow. In fact, car companies are fairly confident of their technology, as for example Chevrolet has issued an 8 year or 160.000 km warranty on their battery for the Bolt model. Likewise, Tesla has stated that their Model S only loses 8% battery retention capabilities after 160.000 km, with further tests indicating the model will still have 80% of its retention capabilities after 800.000 km (Gibson 2018).
As the development of the industry is expected to move from ICE to hybrids (HEV), plug-in hybrids (PHEV) in the mid-term will act as a bridge for consumers to get familiarize with the technology, this also allows for companies more time to fully develop the technology while government regulations are being met. Thus, PEVs are slightly ahead, as consumers are more acquainted with the type of vehicles than HFCV (van de Kaa et al 2017)
Many companies have not yet decided on which technology to commit, choosing instead to develop both PEVs and HFCVs. Even companies that support a given technology have developed partnerships to address a submit change in consumer preference, such as Daimler-Ford-Nissan-Renault fuel-cell partnership, GM and Honda, and Toyota and BMW. Furthermore, the technologies are not mutually exclusive, they can in fact by complementary as PEVs can use hydrogen fuel cells as range extenders.
Supporting PEVs, the major companies are Tesla, GM and BMW. Advocating for HFCVs, the major companies are Toyota, Honda and Hyundai (van de Kaa et al 2017).
12
D. Strategic Group Mapping of Electric Vehicles
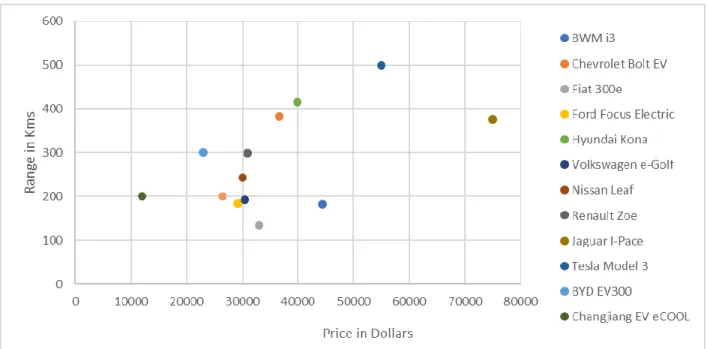
As previously mentioned, two of the key factors influencing consumers adoption of electric vehicles are their reliability in terms of range and its price. Figure 3, displayed below, plots the relationship between the range and price of the most sold electric vehicles in the market, comprised of Chinese, European, Japanese and American car companies.
The advantage Chinese OEMs have over its Western competitors its evident, with the cheapest models, which includes decent range capability, with the Changjian EV eCOOL being the cheapest of this sample and the BYD EV3oo that has better range capabilities than models like the Fiat 500e, Ford Focus Electric and the Nissan Leaf, at a lower price. In the mid-size luxury segment, Tesla’s Model 3 has shown much better sales number than its competition, including non-electric vehicles. Looking at the strategic map, it does not seem to have much competition inside the electric segment, as Jaguar I-Pace has lower range capabilities while being a significantly more expensive.
13
E. Plug-in Electric Vehicles vs Hydrogen Fuel Cell Powered Vehicles
The battle between these two technologies has reached an interesting point where PEVs are the number one key trend, with several companies releasing different models, but a survey performed by KPMG (2017) stated that 78% executives in the auto industry still believe hydrogen to be the superior technology, with 62% absolutely or partly agreeing PEVs will fail due to infrastructure and recharging concerns. John Leech, an automotive executive leader in the UK stated that the reason executives may be so keen on the fuel cell technology is due to “their attachment to the existing infrastructures and traditional vehicle applications” (KPMG 2017)
Despite the opinion of the automobile executives that hydrogen is a better option than batteries, consumers are clearly showing a preference and market trends suggested a more eminent commitment to pursue PEVs. An example of this is the number of different models of vehicles that companies have, looking at BMW, they have one fuel-cell vehicle envisioned against ten battery electric vehicles by 2022. Justin Benson, KPMG’s U.K. head of automotive, even said that “it almost feels like a Betamax versus VHS moment”, recognizing that the best technology not always dominates (Sachgau and Behrmann 2018)
Much of dismiss of hydrogen technology comes from the rise of Tesla and its charismatic leader, Elon Musk, who has rejected the idea of pursuing hydrogen fuel cell technology in favor of electric batteries, even calling it “mind-bogglingly stupid”, stating his concerns about the safety of hydrogen fuel cells, the lack of infrastructures for recharging and its nonrenewable nature. His assertive public opinion on the matter has been met with some criticism as it can be viewed as a tactic to push Tesla’s technology to dominate the electric segment (Samuelsen 2016).
14 Furthermore, Tesla is fully committed to make battery packs affordable, as they are currently the most expensive component, with their CEO suggesting the possibility of achieving $100/kWh by 2020, contradicting a report by McKenzie (2017) that projects battery pack prices to decrease below $100/kWh only by 2030, reaching true price parity with ICEVs without incentives. With the decrease in production costs, prices are expected to decrease, which in term would increase the consumers’ willingness to purchase PEVs.
Figure 4 – Predict io n o f New Vehic le Sale s per t ype, in percent ages (Sachgau and Behr mann, 2018)
2015 2020 2025 2030 2035 2040 2045 2050
HFCV 0 0 1 2 10 19 22 26
Plug-in Hybrid 0 2 3 8 17 27 15 3
PEVs 0 1 6 15 33 54 63 71
Hybrid 1 2 13 25 20 0 0 0
Projected Sales of new ICEVs 99 95 77 50 20 0 0 0 0% 10% 20% 30% 40% 50% 60% 70% 80% 90% 100%
15
II.
Driving Forces Behind an Impending Fuel Technology
Change
A. Political Bans and Incentives at the Country level
As mentioned in the PEST analysis, political influence has been playing a major part in the restructuring of the automobile industry. World governments, both at the country and city level, are arguably one of the major forces pushing away from internal combustion engines (ICE vehicles) towards electric vehicles (EV), phasing out fossil fuel-powered vehicles (Burch and Gilchrist 2018). At the country level, governments have increasingly adopted new technology and innovation into their public policy agendas to address pollution reduction and sustainable developments (Da Zhu 2016). Out of the major vehicle production countries (see Appendix 1), China, Germany and India and other countries have already committed to phase out ICE vehicle by establishing ambitious targets for the next decades that will limit and even ban production and sales of ICE vehicles. Its effectiveness has been noticeable, as experienced in Germany after a court ruling on the infamous DUH case saw sales plummeting by 19.5% and diesel vehicles registrations fell 25% from 2017 to 2018 (Hockenos 2018). Meanwhile, incentives have been also implemented to encourage new technology adoption by consumers (see Appendix 4 and 5).
As an example, China has set an official target of ending production and sales of ICE vehicles by 2040, announced in September 2017 (Zhang 2017). Moreover, China, as part of their economic development formula of utilizing localized pilot programs to put systematic reforms into action, have developed five electric vehicle pilot programs (Marquis et al 2013) that further strengthens their commitment to phase out ICE vehicles (see Appendix 6).
16 In spite of most countries announcing targets, pledges, setting deadlines and creating incentive programs, their actions are non-binding, limiting their own successfulness to achieve the established targets. This can be mainly due to the political costs of forcing a culture change towards the adoption of a new technology instead of allowing for individual preference of the consumers, even if that technology is superior to the existing one. Furthermore, when governments call for change, they are usually met with some resistance from the private sector, thus some flexibility allows time for the industry to fully cooperate with the demands. The majority of the responses from car companies, with European companies like Mercedes Benz, Jaguar Land Rover and Volvo, have been positive with pledges to go electric in the near future. Likewise, Toyota, a Japanese car company, has also responded positively by abandoning its diesel fueled vehicles, choosing to focus the available resources on the development of its electric vehicles (Burch and Gilchrist 2018).
However, not all countries are on the same page. The USA are arguably, out of the main automobile markets, the market with less incentives to forgo ICEs in favor of electric technology. From a political standpoint, President Trump decided to pull out of the Paris Climate Accord, signaling to the market his unwillingness to commit on reducing carbon-dioxide emission. Moreover, in April, his administration recommended a reduction of the standards for fuel-efficiency, which was met with resistance from several states including California and the District of Columbia, threating to impose their own ruling in case this ruling goes through. From a standpoint of incentives to electric cars, the government policies have failed to fully commit as the federal tax rebate for electric vehicles is limited to the first 200,000 plug-in electric vehicles sold per manufacturer. From a resource standpoint, the US market benefits from cheap gasoline which is minimally taxed, thus lowering the incentive consumers and companies to change from ICEs to greener solutions (Buss 2018).
17
B. Political Bans and Incentives at the City level
Cities are also committed to reduce the number of ICE vehicles that circulate, often with quicker results as city governments have jurisdiction over land use and may use local police to enforce bans and regulations. Cities often focus on offering greener transportation solutions and limiting the access and parking of ICE vehicles in certain areas, often in city centers. Their commitment is highlighted by the signing of the C40 Fossil-Fuel-Free Streets Declaration in October 2017 by mayors of major cities such as Paris, London, Los Angeles, Rome and more, setting a target of having only electric buses by 2025 and reducing carbon emissions to zero in certain areas by 2030 (Burch and Gilchrist 2018). Banning diesel seems to be a priority for some cities, Tokyo has developed a plan that intends to completely eliminate the number of diesel vehicles that circulate in the city. This ambition is share by Paris´ mayor Anne Hidalgo that intends to do the same: "Our ambition is clear, and we have started to roll it out: we want to ban diesel from our city, following the model of Tokyo, which has already done the same.” (McGrath 2016). In the US, at a state level, there are political influences in favor of electric vehicles. The first proposal was in California at January 2018 by Phil Ting named Clean Cars 2040 Act, that intended to prohibit the registration of new ICE vehicles after 2040 (Burch and Gilchrist 2018).
C. Strategic Alliances and Technology Sharing Collaborations
Organic growth in the automobile industry is extremely difficult and slow, companies looking for significant growth tend to pursue solutions such as mergers and acquisitions to acquire capabilities or market share (Gomes et al 2010). Sometimes this acquisition of knowledge or capabilities comes in the form of joint ventures and strategic alliances, even more so when dealing with the developing of technologies that wouldn’t be financially viable to pursue and to minimize risk. Thus, in the auto
18 industry there have been several strategic alliances that intend to develop fuel technologies and share their knowledge, resources and capabilities (KPMG 2010).
Different types of strategic alliances can be found, either between established car companies such as Toyota and Tesla, two different companies that mutually benefit from this venture as Tesla acquires knowledge on Toyota’s lean production techniques in order to solve their production setbacks, while Toyota benefits from Tesla´s knowledge on electric vehicles. The partnership eventually reached the end due to culture clashes and the companies moved from allies to rivals (Harding 2017)
An alternative alliance, but common, is the joint venture between car companies and highly specialized suppliers, like the joint venture between Toyota and battery manufacturer Panasonic that resulted in the development of solid-state batteries and prismatic cells, this alliance has been very successful and has been in place for over 20 years (Buckland and Sagiike 2017). Another example is the joint venture between Honda and Hitachi that established a new company in order to develop electric car engines (Yvkoff 2017).
19
III. The Next Auto Giants
As seen in previous chapters, the auto industry is moving towards a greener future with PEVs gaining dominance over ICEVs and HFCVs. There are two major markets that can provide the perfect conditions for car companies to develop their electric segment.
A. China in the Lead
The race for dominance in the electric segment has already began. As seen before, many European and Japanese companies are being influenced by political power, through regulations, bans and incentives, to commit to a greener future. China has understood the importance of being leaders in the developing of electric cars and through the Made in China 2025 government program, has produced several reasonably priced EVs. This was mainly achieved due to substantial subsidies and access to cheap resources to keep production costs low, with the clear intent on developing Chinese car manufactures into global leaders in the electric segment (Buss 2018).
China is already the largest market for electric vehicles, with half of the worldwide sales of EVs in 2017, of those 90% were fabricated by Chinese manufacturers. Their model of affordable electric cars can compete with other vehicles around the world, especially in the US where the most successful electric vehicle, the Tesla Model 3, is mainly competing with ICEs in the mid-size luxury segment, or E-segment (see Appendix 7), providing opportunities to capture market share in the B and C segments. China´s performance in the electric mobility has been represented by McKenzie, in their latest overall EV index rankings (2018, as “remarkable” (Buss 2018).
20 B.
The Potential of the United States
It was previously mentioned the reluctance of the United States to pursue electric fuel technology, mostly due to low political involvement in promoting EVs, low incentives and the low cost of gasoline due to low taxes. However, the US still represent the perfect market that can overcome most of the constraints arising with electric technology easily when compared to the European and Asian market.
Firstly, in terms of infrastructures there is a higher number of single-family houses, in contrast to more urban cities in Europe and Asia, that can be used as charging stations together with the ones already provided. Secondly, with the development of the technology, range would cease to be an issue, as American car companies are highly rated around the world, an example of this is Tesla being China´s next biggest supplier of EVs. Thirdly, the current administration´s views of fuel technology contrasts with the rest of the major countries in the world, as the already mentioned exit from the Paris Agreement, is it not expected that future administrations will have the same strict view and some regulations are expected to be put in place that will limit the ICEs vehicles while placing incentives that will promote a cultural change towards fuel technology while encouraging companies to pursue the electric segment (Buss 2018), matching the political influence that European markets are already beneficiating from.
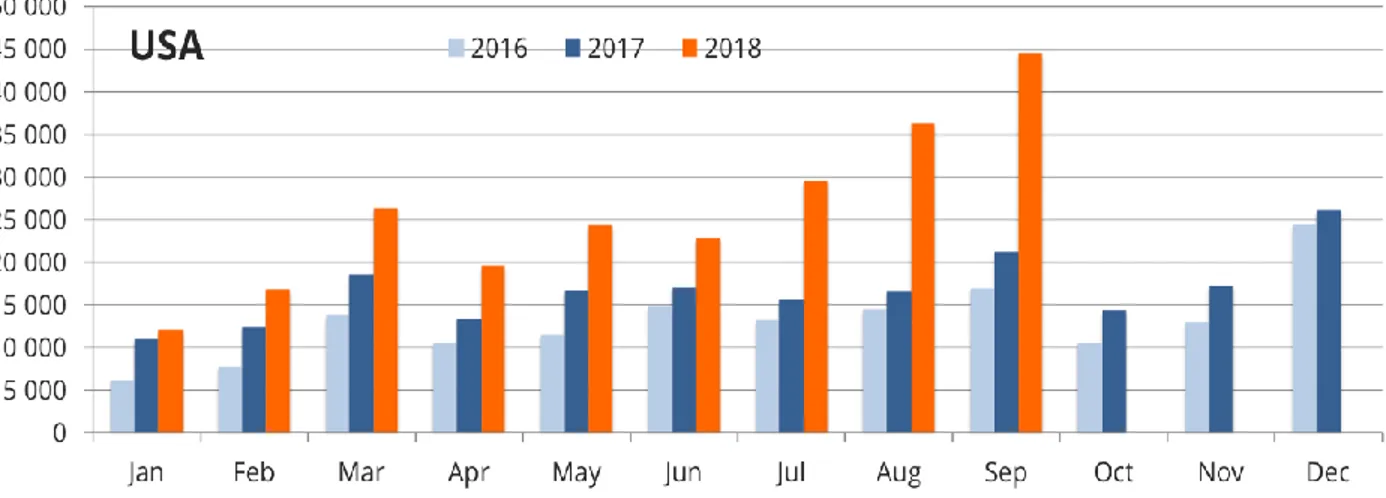
Nonetheless, the US market has been growing (see Figure 5). Data collected until Q3 of 2018 shows that more than 232.000 plug-in vehicles were sold, with 63% if them being PEVs and the remaining 37% plug-in hybrids.
21 Spearheading the growth of electric vehicles in the US is Tesla Model 3, which had some production issues in the beginning of the year, but as soon they were solved production range was between 4000 and 5000, with 54.300 vehicles being sold in the third quarter alone, representing 49% of this value, resulting in an increase of 107% from the second quarter (Irle and Pontes, 2018).
This achievement is even more impressive when considering that Tesla is not only the leader in the electric segment but is also competing against vehicles with ICEs in the E-segment, standing for half of September´s sales, selling more than BMW 3&4 Series, Mercedes C-Class, Audi A4/A5, Acura TSX combined. (see Appendix 8) (Irle and Pontes 2018). Tesla Model 3 is starting to change consumer´s perception on the value of EVs and it is reflected in the growth rate that Tesla has in comparison with ICEs competitors. As consumers’ perception continues to improve, Tesla has an opportunity to completely dominate the E-segment (Irle and Pontes 2018). Tesla’s competitors are already planning on releasing more EVs that can compete in this segment in the near future like Mercedes with its EQC model in 2020, but it is expected that Tesla will maintain its leadership position, also due to its made in America argument, also coming from a political influence with the current administration’s protectionism ideals, and by the fact that they were to first to penetrate the market and establishing the standards for electric vehicles.
22 C.
McKenzie´s Electric Vehicle Index
China is a clear leader and with an impressive performance in the last four years, in the last year alone its market expanded by 72%, surpassing the USA and Germany in combined index scores (Figure 6), enjoying the success of big manufacturers such as BYD, and the emergence of a range of start-ups like Shanghai-based NIO, backed by TenCent and Baidu (Shih 2018). China has distanced itself from countries like Japan and Germany in the industry analysis with a score of 4.25, the only country above 4, by investing heavily on infrastructures and providing several benefits and incentives, developing a great variety of electric vehicles. On the Industry scoring, only behind Norway, with a 2.5 score, restrictions and regulations for local suppliers have proved determinant to retain China´s electric vehicle profit within its borders. Thus, leading to an
23 impressive increase in its electric vehicle´s production and development of technology. Overall, China is clearly ahead of the competition with a score of 6.75 out of 10 (Patrick Hertzke et al 2018).
In the future, China is expected to improve its market score as adoption rates increase, similar to its last four years with an EV penetration increase from 0.3% to 2.2%, to go along with the impressive sales numbers, increasing the overall score over 7. Industry index is expected to be maintained, although it comes at the expense of high levels of subsidies, supported by taxpayers.
Despite lacking political benefits of incentives and bans on ICEs that can further develop the industry, allowing a decrease in production costs and providing the development of a reliable infrastructure, USA is still at a good position for the Industry Electric Vehicle Index, currently sitting behind China, Japan and Germany with a score of slightly above 3. Regarding its Market Electric Vehicle Index, the US is better ranked than Japan and Germany, mostly due to the success of Tesla and its Model 3 in 2018, that has sharply increased sales of EVs, scoring almost 2 to make it a total score of approximately 5, very similar to Japan and Germany. (Patrick Hertzke et al 2018).
For the future, although the market side score is lower compared to other countries, US has the biggest potential to improve as soon as the infrastructure issue is addressed, and electric vehicles become a reliable solution to current ICEVs, which is expected to raise the market index score above 2. For the industry scoring, the government’ view on electric technology is bound to change, either with this administration due to international pressures or with future administrations, leading to a commitment to reduce emissions with bans and limitations for ICEVs and incentives to reduce either production costs or the final cost for the consumers, thus raising the sales of electric vehicles. Overall, with its potential, the US is expected to increase its total score above 6 in the future, getting closer to China, the number one ranked in McKenzie´s EVI.
24
Conclusion
The automobile industry is facing an impending technological shift towards a different powertrain supported by electric technology, which can lead to the dominance of battery powered or hydrogen fuel cell powered vehicles. As it stands, executives in the automobile industry would prefer a move towards hydrogen, perhaps due to its similarities with traditional infrastructures and recharging methods, but the market its clearly headed towards BEVs, highlighted by the success of Tesla’s latest Model 3. Electric mobility has been benefiting from a positive political influence that has encourage consumers to make the change by creating incentives for EVs and bans for ICEVs. Car companies are also deeply committed to making the change and several alliances have been put in place that have greatly improve R&D to a point where battery pack costs decrease substantially and are expected to continue to decrease, lowering its production costs and consequent final price.
Considering the move towards electric powertrains, more specifically battery powered electric vehicles, the most promising countries are China and the USA. China due to its leadership position, being the biggest electric vehicle market and its industry benefits from great incentives to the further development of the technology and Chinese OEMs. The US has seen the success of Tesla’s Model 3 that was able to compete with ICEVs in the E segment, greatly increasing the presence of electric vehicles in the market. In terms of industry dynamics, the US has been constraint due to political influence and has not been benefiting from incentives and limitations to ICEVs, like in other countries. Nonetheless, it still scores highly in McKenzie’s Index, hinting at the potential of its industry once the constraints are removed. Further studies should focus on emerging countries like India, as their market potential is considerable. Both market acceptance and industry dynamics are significantly lower than the countries mentioned in this work project, but with its impending growth in middle class, mobility solutions will be one of the main challenges in the future.
25 Global OEMs intent to increase the supply of electric vehicles, strengthening their commitment towards a greener automobile future. Together with the continuous effort of governments and the increased consumer awareness and willingness to adopt electric technology, electric powertrains and its battery powered vehicles have the ability to be one of the most impactful and disruptive technology in the automobile industry.
Limitations
The topic of the work project and subsequent research question can be challenging to address within the established restrictions. Thus, the scope of this research was confined to passenger vehicle and light commercial vehicles, any reference to OEMs are within the established segments. Within these segments, it was intended to pursue a general understanding of the industry, considering only major markets as representative of the world’s industry. To gauge preferences and tendencies for these given segments, secondary data was used to provide evidence based on statistics, reports and surveys conducted by renowned third-parties such as consulting firms like McKenzie and KPMG.
Also due to page restrictions, the research only focused on the two main alternatives, plug-in electric vehicles (PEV) and hydrogen fuel cell powered vehicles (HFCV), to the current fuel technology of conventional fossil fuel, disregarding other less likely alternatives or improvements of the current technology. All the information collected on the automobile industry, fuel technology and consequent analysis was based on research conducted between June and November of 2018, as such, for yearly comparisons, figures from 2018 may be incomplete and figures from 2017 may be used to provide the latest overview of the industry.
26
Bibliography
Buckland, Kevin and Hideki Sagiike. 2017. “Toyota Deepens Panasonic Battery Ties in Electric-Car Rush.” Bloomberg. Accessed November 30. https://www.bloomberg.com/news/articles/2017-12-13/toyota-panasonic-consider-joint-electric-car-battery-business
Burch, Isabella and Jock Gilchrist. 2018. “Survey of Global Activity to Phase Out Internal Combustion Engine Vehicles”. Center for Climate Protection. Accessed November 21. https://climateprotection.org/wp-content/uploads/2018/10/Survey-on-Global-Activities-to-Phase-Out-ICE-Vehicles-FINAL-Oct-3-2018.pdf
Buss, Joern. 2018. “Automakers Need A Global Timetable for Phasing Out Internal-Combustion
Engines”. Oliver Wyman in Forbes. Accessed November 21.
https://www.forbes.com/sites/oliverwyman/2018/03/27/automakers-need-a-global-timetable-for-phasing-out-internal-combustion-engines/#2fb153a23c34
Citi GPS. 2018. “Electric Vehicles: Readying for Adoption”. Accessed November 30. https://ir.citi.com/Q4reVdhocGy9VN0VSdcgYojkpCcCQqV1txeA5Wm2Vp4Dl4FoFL0HWPX %2F9LYKf9nbFNH4iLG5nS0%3D
Da Zhu et al. 2016. “The Bhutan Electric Vehicle Initiative”, World Bank Group. Accessed November 29. openknowledge.worldbank.org/bitstream/handle/10986/23735/9781464807411.pdf
27 De Feijter, Tycho. 2018. “10 New Electric Cars From China”. Forbes. Accessed November 20.
https://www.forbes.com/sites/tychodefeijter/2016/05/18/10-new-electric-cars-from-china/#62b7d34c27ef
De Guzman, Marcus. 2016.” Car Classes Simplified: The Euro-standard Car Segments”. Autoindustriya. Accessed November 30. https://www.autoindustriya.com/features/car-classes-simplified-the-euro-standard-car-segments.html
EV Rater. “The Electric Vehicle List”. Accessed November 20. https://evrater.com/evs#ev-list
Focus2move. 2018. “World Cars Brand Ranking: The top 50 in 2018”. Accessed December 20, 2018. https://focus2move.com/world-cars-brand-ranking/
Garland, Nancy L., Dimitrios C. Papageorgopoulos, and Joseph M. Stanford. 2012. "Hydrogen and Fuel Cell Technology: Progress, Challenges, And Future Directions". Energy Procedia 28: 2-11.
Gomes, Emanuel, et al. 2010. “Mergers and acquisitions as strategic methods of business development in the global automobile industry: An analysis of five cases”. Lewiston, NY.
Harding, Robin. 2017. “Toyota sells stake in Tesla as partnership dies”. Financial Times. Accessed 15 December. https://www.ft.com/content/130a937a-48fd-11e7-919a-1e14ce4af89b
Hertzke, Patrick et al. 2018. “The global electric-vehicle market is amped up and on the rise” McKinsey. Accessed on December 12. https://www.mckinsey.com/industries/automotive-and-assembly/our-insights/the-global-electric-vehicle-market-is-amped-up-and-on-the-rise
28 Hockenos, Paul. 2018. “End of the Road: Are Diesel Cars on the Way Out in Europe?”. Yale Environment 360. Accessed October 27. https://e360.yale.edu/features/end-of-the-road-are-diesel-cars-on-the-way-out-in-europe
Irle, Roland and Jose Pontes. 2018. “USA Plug-in Sales for Q3 and YTD 2018”. EV Volumes. Accessed December 6. http://www.ev-volumes.com/country/usa/.
Irle, Roland. 2018. “Global Plug-in Sales for the 1st Half of 2018”. EV Volumes. Accessed
December 6. http://www.ev-volumes.com/country/total-world-plug-in-vehicle-volumes/
KPMG 2017. “Global Automotive Executive Survey 2017” Accessed December 2. https://assets.kpmg/content/dam/kpmg/xx/pdf/2017/01/global-automotive-executive-survey-2017.pdf
KPMG. 2010. “The Transformation of the Automotive Industry: The Environmental Regulation
Effect”. Accessed October 22.
http://www.kpmg.com/cn/en/issuesandinsights/articlespublications/pages/transformation-automotive-industry-o-201001.aspx
Lambert, Fred. 2017. “Electric vehicle battery cost dropped 80% in 6 years down to $227/kWh – Tesla claims to be below $190/kWh” Electrek. Accessed December 8. https://electrek.co/2017/01/30/electric-vehicle-battery-cost-dropped-80-6-years-227kwh-tesla-190kwh/
Marquis, Christopher, Hongyu Zhang, and Lixuan Zhou. "China's Quest to Adopt Electric Vehicles." Stanford Social Innovation Review 11, no. 2: 52–57.
29 McKinsey & Company. 2017. “Electrifying Insights: How Automakers Can Drive Electrified
Vehicle Sales and Profitability”. Accessed November 30.
https://www.mckinsey.com/industries/automotive-and-assembly/our-insights/electrifying-insights-how-automakers-can-drive-electrified-vehicle-sales-and-profitability
Oliver Wyman. 2018. “Embracing an Electric Future: Automakers Need a Global Timetable for Phasing Out Internal-Combustion Engines”. Accessed November 15. https://www.oliverwyman.com/content/dam/oliver-wyman/v2/publications/2018/july/embracing-an-electric-future.pdf
Sachgau, Oliver and Elisabeth Behmann. 2018. “The Hydrogen-Powered Car´s Big Setback”. Bloomberg. Accessed December 6. https://www.bloomberg.com/news/articles/2018-03-23/the-hydrogen-powered-car-s-big-setback
Samuelsen, Scott. 2017. “Why the Automotive Future Will Be Dominated by Fuel Cells”. IEEE Spectrum: Technology, Engineering, and Science News. Accessed October 20: https://spectrum.ieee.org/green-tech/fuel-cells/why-the-automotive-future-will-be-dominated-by-fuel-cells.
Saunders, Mark, Philip Lewis and Adrian Thornhill. 2012. Research methods for business students. Harlow: Pearson Education Limited.
Shih, Willy. 2018. “Don’t Underestimate Chinese Automakers” Forbes. Access December 5.
30 Sisson, Patrick. 2018. “California continues to lead the way on electric vehicles”. Curbed. Access December 5. https://www.curbed.com/2018/1/30/16950118/electric-vehicles-ev-california-tesla
Statista. 2018. “Global Automobile Market Share in 2017 by brand”. Accessed October 4. https://www.statista.com/statistics/316786/global-market-share-of-the-leading-automakers/
Statista. 2018. “Global passenger vehicle production in 2017, by country or region”. Accessed October 4. https://www.statista.com/statistics/277055/global-market-share-of-regions-on-auto-production/.
Statista. 2018. “Number of vehicles manufactured in Europe in 2017, by vehicle type”. Accessed October 4. https://www.statista.com/statistics/430324/leading-european-automotive-manufacturing-countries-in-2014/
Statista. 2018. “Worldwide automobile production from 2000 to 2017 (in million vehicles)”. Accessed October 4. https://www.statista.com/statistics/262747/worldwide-automobile-production-since-2000/.
Stewart, Jack. 2018. “Look Ma, No Brake! You´ll Drive Electric Cars with One Pedal”. Wired. Accessed December 8. https://www.wired.com/story/look-ma-no-brake-youll-drive-electric-cars-with-one-pedal/
The Week. 2018. “Oil prices hit four-year high”. Access December 5. https://www.theweek.co.uk/93413/oil-prices-hit-four-year-high
31 Thomas, John, Brian West, Teresa Alleman, Margo Melendez, and Matthew Shirk. 2017. Co-Optimization of Fuels & Engines: History of Significant Vehicle and Fuel Introductions in the United States, Oak Ridge National Laboratory.
Thompson, Arthur et al. 2008. Crafting and executing strategy: The quest for competitive advantage: Concepts and cases. New York: McGraw-Hill. 16th edition
Tomolon, Larry. 2017. “How Will Pulling Out of the Paris Accord Affect the Auto Industry?”. Career Pro. Accessed December 5. http://www.careerpro.com/2017/08/will-pulling-paris-accord-affect-auto-industry/
Unrau, Jason. 2018. “The Correlation Between Fuel Prices and Auto sales” Automotive Network. Accessed December 5. https://www.cbtnews.com/the-correlation-between-fuel-prices-and-auto-sales/
van de Kaa, Geerten et al. 2017. "The Battle between Battery and Fuel Cell Powered Electric Vehicles: A BWM Approach." Energies 10, no. 11: 1707.
Yvkoff, Liane 2017. “Honda, Hitachi Teaming Up to Produce Electric Motors for Cars”. The Drive. Accessed October 21. http://www.thedrive.com/tech/7457/honda-hitachi-teaming-up-to-produce-electric-motors-for-cars
Zhang, Yan. 2017. “China fossil fuel deadline shifts focus to electric car race,” Bloomberg. Accessed October 20. http://www.bloomberg.com/news/articles/2017-09-10/china-s-fossil-fuel-deadline-shifts-focus-to-electric-car-race-j7fktx9z
32
Appendix
Appendix 1 – Global Passenger Vehicle Production in 2017, by Country or Region
Appendix 2 – Number of vehicles manufactured in Europe in 2017, by vehicle type
Source: Statista. 2018. “Global passenger vehicle production in 2017, by country or region” . https://www.statista.com/statistics/277055/global -market-share-of-regions-on-auto-production/.
Source: Statista. 2018. “Number of vehicles manufactured in Europe in 2017, by vehicle type”. Accessed October 4. https://www.statista.com/statistics/430324/leading -european-automotive-manufacturing -countries-in-2014/
33
Appendix 3 - Global Automobile Market Share in 2017 by brand
Source:Statista. 2018. “Global Automobile Market Share in 2017 by brand”. Accessed October 4. https://www.statista.com/statistics/316786/global -market-share-of-the-leading-automakers/
34
Appendix 4 – Countries Banning or Considering a Ban on ICE Vehicles
S o u rc e : O li v e r W y m a n . 2 0 1 8 . “E m b ra ci n g a n E le ct ri c F u tu re : A u to m a k e rs N e e d a G lo b a l T im e ta b le f o r P h a si n g O u t In te rn a l-C o m b u st io n E n g in e s” . A cc e ss e d N o v e m b e r 1 5 . h tt p s: // w w w .o li v e rw y m a n .c o m /c o n te n t/ d a m /o li v e
r-35
Appendix 5 – Status of ICE Vehicle Phase-Out by Country
Country Status of ICE Vehicle Phase-Out Date of Action
Austria Official target: No new ICE vehicles sold after 2020 April 2016
Britain Official target: No new ICE vehicles sold after 2040 (will not include hybrids) July 2017
China Official target: End production and sales of ICE vehicles by 2040 September 2017
Costa Rica Initiate complete phase-out of ICE vehicles by 2021 April 2018
Denmark Official target: 5,000 EVs on the road by 2019, tax incentive in place Since 2008
France Official target: No new ICE vehicles sold after 2040 July 2017
Germany No registration of ICE vehicles by 2030 (passed by Legislature); cities can ban
diesel cars; Federal court ruling supports law October 2016
India Official target: No new ICE vehicles sold after 2030 (will likely hit 30% by
2030) April 2017
Ireland Official target: No new ICE vehicles sold after 2030, incentive program in
place for EV sales July 2017
Israel Official target: No new ICE vehicle imports after 2030 February 2018
Japan Incentive program in place for EV sales Since 1996
Netherlands Official target: No new ICE vehicles sold after 2030, phase-out begins 2025 October 2017
Norway Incentive program in place for EV sales; Official target: only sell EVs by 2025 Since 1990
Portugal Official target and incentive in place for EV sales Since 2010
Scotland Official target: No new ICE vehicles sold after 2032 September 2017
South Korea Official target: EVs account for 30% of auto sales by 2020 June 2016
Spain Official government program: the Movea 2017 Plan, an incentive package to
promote sales of alternative energy vehicles June 2017
Taiwan
Official target: Phase out fossil fuel-powered motorcycles by 2035 and fossil fuel-powered vehicles by 2040. Additionally, the replacement of all
government vehicles and public buses with electric versions by 2030
December 2017
Source:Burch, Isabella and Jock Gilchrist. 2018. “Survey of Global Activity to Phase Out Internal Combustion Engine Vehicles”. Center for Climate Protection.
36
Appendix 6 – China´s Five Electric Vehicle Pilot Programs
Source: Marquis, Christopher, Hongyu Zhang, and Lixuan Zhou. "China's Quest to Adopt Electric Vehicles." Stanford Social Innovation Review 11, no. 2 (Spring 2013)
37
Appendix 7 – European Vehicle Segmentation
Segmentation
Letter Description Examples
A Mini Vehicles Citroën C1, Fiat 500, Hyundai Eon, Renault Twingo
B Small Vehicles Ford Fiesta, Kia Rio, Opel Corsa, Volkswagen Polo
C Medium Vehicles Honda Civic, Ford Focus, Renault Mégane, Toyota Corolla
D Large Vehicles Ford Mondeo, Opel Insignia, Audi A4, Mercedes C-Class
E Executive Vehicles Audi A6, Cadillac CTS, Mercedes-Benz E-Class, Tesla Model S
F Luxury Vehicles Jaguar XJ, Mercedes S-Class, Porsche Panamera, Audi A8
S Sports Coupe Vehicles Mercedes SLK, Bugatti Veyron, Aston Martin DB9, Jaguar XK M Multi-purpose Vehicles Ford C-Max, Renault Espace, Mercedes Viano, Ford Transit
J Sport Utility Vehicles Jeep Cherokee, Ford Edge, Volvo XC90, Range Rover
Appendix 8 – US E-Segment Sales in 2018
JAN FEB MAR APR MAY JUN JUL AUG SEP
Tesla Model 3 1.9 2.5 3.8 3.8 6.1 5.8 14.3 17.8 22.3 BMW 3 & 4 Series 6.1 6.4 8.1 6 6.4 7 5.8 5.7 6.8 Audi A4 & A5 3.6 4.2 5.9 5.3 6.1 6.6 5.8 6.5 5.7 Mercedes C-Class 4.4 3.9 5 5.1 5.4 5.7 3.8 4.1 4.7 Acura TLX 2.2 2.8 4 2.9 2.7 2.3 2 1.9 2.1 0 5 10 15 20 25
Source: Irle, Roland and Jose Pontes. 2018. “USA Plug -in Sales for Q3 and YTD 2018”. EV Volumes. Accessed December 6. http://www.ev -volumes.com/country/usa/.
Source: De Guzman, Marcus. 2016.” Car Classes Simplified: The Euro -standard Car Segments”. Autoindustriya. Accessed November 30. https://www.autoindustriya.com/features/car -classes-simplified-the-euro-standard-car-segments.html