Local spatiotemporal dynamics of a simple aridity index in a region
susceptible to desertification
A. C. Costa
a, A. Soares
ba
ISEGI, Universidade Nova de Lisboa, 1070-312 Lisboa, Portugal. E-mail:
[email protected]
b
CERENA – Centro de Recursos Naturais e Ambiente, Instituto Superior
Técnico, Avenida Rovisco Pais, 1049-001 Lisboa, Portugal. E-mail:
[email protected]
Corresponding author: ANA CRISTINA COSTA
Address: ISEGI, Universidade Nova de Lisboa, 1070-312 Lisboa, Portugal
Phone: (+351) 213828610
Fax: (+351) 213828611
E-mail: [email protected]
This is the peer reviewed version of the following article:
Costa, A. C., & Soares, A. (2012). Local spatiotemporal dynamics of a simple
aridity index in a region susceptible to desertification. Journal Of Arid
Environments, 87, 8-18. https://doi.org/10.1016/j.jaridenv.2012.05.005,
which
has
been
published
in
final
form
at
https://doi.org/10.1016/j.jaridenv.2012.05.005
This work is licensed under a
Creative Commons
Attribution-NonCommercial-NoDerivatives 4.0 International License.
Local spatiotemporal dynamics of a simple aridity index in a region susceptible to
desertification
A. C. Costa
a, A. Soares
ba
ISEGI, Universidade Nova de Lisboa, 1070-312 Lisboa, Portugal. E-mail: [email protected]
b
CERENA – Centro de Recursos Naturais e Ambiente, Instituto Superior Técnico, Avenida
Rovisco Pais, 1049-001 Lisboa, Portugal. E-mail: [email protected]
Corresponding author: ANA CRISTINA COSTA
Address: ISEGI, Universidade Nova de Lisboa, 1070-312 Lisboa, Portugal Phone: (+351) 213828610
Fax: (+351) 213828611 E-mail: [email protected]
ABSTRACT
Increased aridity is a robust proximate cause of desertification, both indirectly through greater rainfall variability and directly through prolonged droughts. The south of continental Portugal has large areas with high susceptibility to desertification. This study evaluates local dynamics in dryness in the south of Portugal based on the Aridity Intensity Index (AII), which is a numerical indicator of the degree of dryness of the climate and an indirect indicator of soil moisture availability. The AII was computed using daily precipitation data from stations with records within the 1940–1999 period in the south of Portugal. Annual scenarios of the AII were generated from 1940 to 1999 using direct sequential simulation (DSS). Those scenarios were then used to produce an additional set of maps that summarize their underlying space-time patterns. Two desertification indicators accounting for local dryness dynamics are proposed, namely the Dryness Susceptibility Indicator and the Dryness Trend Indicator. The results show that the southeast region is the most threatened by droughts and extreme dryness. Moreover, there is a tendency towards drier climatic conditions in coastal areas and in the centre of the study region. These findings are likely to have profound implications in agricultural planning and water supply management.
KEY-WORDS: climate variability; desertification indicator; dryness; direct sequential simulation; geostatistics; Portugal.
1. INTRODUCTION
Desertification, the process of land degradation in dry areas, is one of the most complex
environmental and socio-economical threatening events. Desertification is caused by multiple interacting factors of climatic, ecological, and socio-economic origin (e.g., Verstraete, 1986). Desertification processes include accelerated soil erosion by wind and water, increasing salinization of soils and near-surface groundwater supplies, a reduction in soil moisture retention, an increase in near-surface runoff and stream flow variability, the reduction of organic elements in the soil, plant cover degradation, and a reduction in the overall productivity in dryland ecosystems (Gringof and Mersha, 2006; Schreiber et al., 2008).
Climate has an important role on desertification processes through its impacts on dryland soils and vegetation, on dryland hydrology and, ultimately, on human land use (Geist and Lambin, 2004; Gringof and Mersha, 2006; Schreiber et al., 2008). Climate change resulting from global warming may exacerbate the problem of desertification. Global climate models consistently predict increases in drought and drier future soil condition in many regions of the world, particularly in the Mediterranean (Heinrich and Gobiet, 2011; Sheffield and Wood, 2008; Wang, 2005).
In Mediterranean climate regions, such as the south of Portugal, prolonged periods of unusually dry conditions reduce the availability of water resources and affect vegetation cover. Drought periods amplify the soil erosion, damage the vegetation cover, reduce the water resources, increase the vulnerability to salinization, exhaust and degrade the agricultural lands, among other phenomena that cause land degradation (Correia, 2004). Increased aridity is a robust proximate cause of desertification, both indirectly through greater rainfall variability and directly through prolonged droughts (Geist and Lambin, 2004). The effects of increased aridity on land cover include increased fire frequencies and greater soil erosion triggered by more frequent oscillations between warmer, drier conditions and cooler, more humid conditions.
The precipitation regime of Portugal is highly irregular throughout the year, and over the country, and large areas are highly susceptible to droughts (e.g. Santos et al. 2007, 2009a) and to desertification (Correia, 2004; Rosário, 2004). The occurrence of strong and persistent mid-latitude anticyclonic ridges over the Eastern North Atlantic is a major contributor to the occurrence of severe winter droughts over Portugal (Santos et al., 2009b). The precipitation regime in central and northern Portugal is mainly frontal and orographic. In contrast, most of the southern part is characterized by vast flat to rolling country, and the precipitation regime tends to be more associated with cyclogenetic activity (Trigo and DaCamara, 2000). In the south of Portugal, the precipitation distribution is also characterized by high inter-annual variability (Mourato et al., 2010), which was especially noticeable during the last three decades of the twentieth century (García-Barrón et al., 2011). The severity of drought conditions during summer is more intense in the interior, especially in the Alentejo region (Fragoso and Gomes, 2008), and some areas are becoming drier (Mourato et al., 2010; Costa, 2011). On the other hand, the Algarve region, in the far
south, is frequently affected by heavy precipitation events (Costa et al., 2008, Fragoso and Gomes, 2008), which may accelerate soil erosion and desertification processes. In fact, the main environmental problems of the Algarve region are soil erosion and forest fires (Panagopoulos and Antunes, 2008).
The impacts of climate change and variability on natural systems and human activities are usually experienced at the regional or local scale. Recent studies on the climate variability of the Iberian Peninsula focus on linear trends in precipitation indices, aiming to determine whether there has been a significant shift in such time series (e.g., Costa and Soares, 2009a; de Lima et al., 2010; Gallego et al., 2011). In the south of Portugal, a significant decrease in light rainfall days has been reported by Gallego et al. (2011). Moreover, many meteorological stations of this area show an increase in dry spells and a tendency towards drier climatic conditions (Costa and Soares, 2009a). Nevertheless, most of the studies based on precipitation indices only focus on temporal trends rather than space–time patterns (Durão et al., 2010).
According to Pereira et al. (2006), the climate quality component ('Aridity index' map) of the susceptibility map of desertification, developed by the Portuguese National Action Programme to Combat Desertification (Rosário, 2004), is not fully appropriate to map the areas susceptible to desertification because it is based on average computations. Consequently, the development of indicators accounting for the dynamics of desertification processes and drought, particularly the trends and variability hidden behind "the means", should be further addressed (Pereira et al., 2006; Rosário, 2004). Moreover, indicators of the uncertainty of the produced maps should also be developed (Rosário, 2004).
The main objective of this research work is to characterize the spatiotemporal dynamics of the AII – Aridity Intensity Index, proposed by Costa and Soares (2009a), in the south of Portugal from 1940 to 1999. Additionally, this study aims at developing desertification indicators characterizing the local state and trends of dryness taking into account the climate dynamics of the study region. Annual scenarios of the AII were generated through direct sequential simulation (Soares, 2001), which is a geostatistical simulation procedure that allows reproducing the spatial uncertainty of the attribute under study.
The AII corresponds to the average amount of precipitation per dry day. Among the many drought and aridity indices described in the literature, the AII was selected for several reasons. First, it only requires precipitation data, which was available for a considerable number of stations (more than 100) and long periods; while, for example, temperature data was only available for a few stations (less than 10). The applicability of spatial interpolation techniques, such as the one considered here, and the accuracy of the resulting maps strongly depend on the station-network distribution and spatial density. Therefore, complex indices making use of other attributes were discarded. An alternative could be the well known Standard Precipitation Index (SPI), proposed by McKee et al. (1993), which requires fitting a probability density function to the frequency distribution of each precipitation series. However, a
nonparametric approach was preferred for this study because it can be more generally applied than precipitation probabilistic approaches, which are dependent on assumptions about the precipitation
distribution. Second, the AII definition has the same rationale of some of the indices (e.g., SDII – simple daily intensity index) recommended by the joint project CCI/CLIVAR/JCOMM Expert Team on Climate
Change Detection and Indices (http://cccma.seos.uvic.ca/ETCCDI/indices.shtml). Moreover, such indices
using fixed thresholds to define a wet (or dry) day are beneficial for impact studies (Klein Tank and Können, 2003), thus the AII was considered appropriate for the purposes of this study. Finally, the AII has been proposed to assess changes in the degree of dryness (Costa and Soares, 2009a), which is an important issue in a region susceptible to desertification such as the south of Portugal, but the local space–time patterns of the AII have never been evaluated.
The material and methods are described in Sect. 2, which includes a description of the data and study region (Sect 2.1), and details the proposed desertification indicators (Sect. 2.2). The geostatistical
procedures used to derive the space-time scenarios of the AII in 1940–1999, and the computations used to produce the maps that summarize the AII dynamics, are also described in Sect. 2.2. The main results are presented in Sect. 3, which includes a summary of the space-time dynamics and trends of the AII in the last decades of the 20th century, an uncertainty evaluation of the produced maps, and the desertification indicators produced for the study region. Finally, Sect. 4 discusses the results, and Sect. 5 states the major conclusions.
2. DATA AND METHODS
2.1 Study region and precipitation data
The desertification processes that affect the south and the inland regions of Portugal correspond to large areas where water resources are scarce, soil resources are often poor and non-agricultural vegetation is suboptimal (Pereira et al., 2006). In southern Portugal, a combination of population growth and a cereal self-sufficiency policy increased the desertification phenomenon since the beginning of the twentieth century (Puigdefábregas and Mendizabal, 1998; Roxo et al., 1999). In recent years, population
reallocation (mainly to major cities and coastal zones) caused agriculture and land abandonment, and the soils left behind were exhausted and degraded (Geist and Lambin, 2004; Puigdefábregas and Mendizabal, 1998).
The Algarve and Alentejo regions, in the south of the country (Fig. 1), have large areas with high susceptibility to desertification (Correia, 2004; Rosário, 2004). The southern part of the territory, especially the Alentejo region, is a drought prone area that is characterized by scarce precipitation, little runoff and water availability (Paulo et al., 2003; Santo et al., 2005).
The study domain is defined by the southern river basins of continental Portugal covering an area of 24864 Km2, thus it includes the Algarve region, in the far south, and most of the Alentejo region (Fig. 1).
irregularly over the study region (Fig. 1). Three of them (Lisboa Geofisica, Beja and Tavira) were compiled from the European Climate Assessment & Dataset project (ECA&D; http://eca.knmi.nl), and the remaining series were extracted from the National System of Water Resources Information (SNIRH – Sistema Nacional de Informação de Recursos Hídricos) database (http://snirh.inag.pt). Data quality checking of the three ECA&D stations was undertaken within this project (e.g., Klein Tank et al. 2002; Wijngaard et al. 2003). Nevertheless, each station's precipitation series considered in this study was subject to several basic quality-control procedures and six statistical homogeneity tests (Costa and Soares, 2009a). Some stations’ series were also relatively tested with reference to their neighbouring stations’ series using the Standard normal homogeneity test, the Pettit test, the Buishand range test and an extension of the Ellipse test (Costa and Soares, 2009a), as well as a geostatistical stochastic simulation approach (Costa and Soares, 2009b). Only the longest homogeneous period was used to compute the AII for the series classified as ‘suspect’ by Costa and Soares (2009a). Similar to Haylock and Goodess (2004), the selected stations have less than 16% of the days missing in each year and most stations’ data do not have any missing records. Consequently, the length of the 105 precipitation series ranges from 8 to 69 years within the 1940–1999 period, and the average length of the series is 30 years.
2.2 Methods
2.2.1 The AII – Aridity Intensity Index
The Aridity Intensity Index (AII) is defined as the ratio between the total amount of rain on dry days and the number of dry days per year. For the south of Portugal, a dry day is defined as a day with an accumulated precipitation of less than 10 mm (Costa and Soares, 2009a). Hence, the AII can be
interpreted as the average amount of precipitation per dry day, and its values may range from 0 to 10 mm.
The AII is a numerical indicator of the degree of dryness of the climate at a given location (Costa and Soares, 2009a). The rainfall has a small effect on the soil water-content below the 10 mm threshold, thus water evaporation and vegetation transpiration easily take place (Ceballos et al., 2004). Hence, decreasing (increasing) trends of AII are indicators of change in the normal moisture availability, which is a relevant factor in desertification processes. Nevertheless, it can be used a different threshold to typify a dry day in other regions of the world.
2.2.2 Geostatistical simulation of the AII
Sequential simulation is a widely used geostatistical tool for obtaining a set of equiprobable simulated realizations (maps) of variables from natural phenomena, conditional to observed data,
for simulating directly in the original data space without relying on multi-Gaussian assumptions (Journel, 1994). The DSS algorithm proposed by Soares (2001) reproduces both the spatial covariance structure and the histogram of the original variable. This algorithm was applied in order to obtain a set of 100 simulated maps for each year from 1940 to 1999 (each map has 74683 grid cells of 800 m × 800 m) using the geoMS© – Geostatistical Modelling Software developed by CMRP – Centre for Modelling Petroleum
Reservoirs, Instituto Superior Técnico, Portugal.
Let {z(u, ti): =1,…,n; i=1,…,T} be the set of climate data measured at n locations u and in ti time instants (years). The n monitoring stations do not have to be all informed at the same T time instants (i.e., a number of z-values can be missing). The set of climate observations correspond to outcome values (realizations) of a spatiotemporal random variable Z(u, t) that can take a series of values at any location in space u and instant in time t according to a probability distribution.
The DSS algorithm (Soares, 2001) was used to generate a set of m=100 equally probable realizations of Z(u, t) at all grid cells of each instant in time ti (T=60): {zs(uα, ti): s=1,…,m; =1,…,N; i=1,…,T};
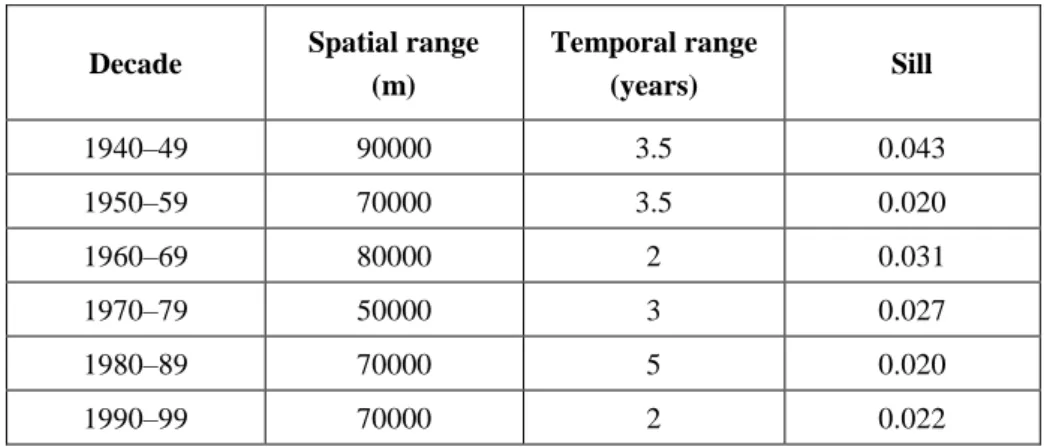
where N=74683 is the total number of grid cells to be simulated for each year from 1940 to 1999. The DSS algorithm used a different exponential space-time variogram model for each decade, as suggested by Costa et al. (2008) and Durão et al. (2009). The spatial variability is assumed identical in all directions (i.e. isotropic) within each decade. The parameters for each exponential variogram are listed in Table 1.
2.2.3 Assessment of local dynamics
This section details the methods used: (i) to obtain the space-time scenarios; (ii) to evaluate the uncertainty of the time scenarios; (iii) to calculate probability maps that summarize the local space-time dynamics and uncertainty; (iv) to compute the linear trend map through the Sen’s estimator; and, (v) to obtain the trend significance map through the Mann-Kendall test. The data analysis was generated through specific programs developed using SAS software macros and SAS/STAT software of the SAS System (registered trademarks of SAS Institute Inc.) for Windows, Version 9.2.
The space-time scenario of a specific year (from 1940 to 1999) corresponds to the average of the 100 simulated maps for that year. For a given instant in time t0, the set of m simulated values {zs(u0, t0):
s=1,…,m} defines the local histogram at the location (grid cell) u0 for that instant. The space-time inference was performed by means of computing the mean of those distributions for all grid cells uα, hereafter referred to as (space-time) scenarios:
N ,..., 1 , ) t , u ( z m 1 ) t , u ( z m 1 s 0 s 0 M = =
= Similarly, the uncertainty of the space-time scenario for a given year t0 was evaluated by both the standard deviation (STD) and the coefficient of variation (CV) of the 100 simulated maps of the year t0 (local histograms).
The computation of the probability maps summarizing the local space-time dynamics [scenarios' uncertainty] is based on the proportion of times the AII [coefficient of variation (CV)] values of the 1940−1999 gridded datasets are less [greater] than a fixed threshold. The thresholds considered for the AII values correspond to the first and second quartiles of the scenarios corresponding to the climate normal 1961–1990. The threshold considered for the CV values was equal to 25% to allow comparing the spatial uncertainty of the AII scenarios with the uncertainty found in other precipitation indices (e.g., Costa et al., 2008).
Let {zM(u, t
i): =1,…,N; i=1,…,T} be the set of T=60 annual scenarios of the Aridity Intensity
Index (denoted by Iz).Since lower values of the AII indicate greater dryness, the probability maps
correspond to the estimated probability of AII to be less than a fixed threshold zk.At each grid cell u, the probability of AII to be smaller than a given value zk was evaluated as the proportion of the T estimated values zM(u, t
i) that are smaller than that threshold, with ti=1,…,T. In other words, the probability of Iz to
be less than a fixed threshold zk was approximated by the corresponding relative frequency computed with the yearly values that were estimated at each grid cell:
w(u ,t ) , 1,..., N T 1 z ) u ( I P T 1 i i k z
= = where w(uα, ti) are indicator data defined as
T ,..., 1 i ; N ,..., 1 , otherwise 0 z ) t , (u z if 1 ) t , w(u i k M i = = = Let {zCV(u, t
i): =1,…,N; i=1,…,T} be the set of T=60 annual gridded datasets of the uncertainty
evaluation measured by the coefficient of variation (1940−1999 maps). The probability map of the uncertainty of the scenarios to be greater than or equal to a fixed threshold was computed by evaluating the proportion of the T estimated values zCV(u
α, ti) that are greater than that threshold.
The linear trend map was obtained by computing the nonparametric estimator of the slope (Sen, 1968), at each grid cell uα of the AII scenarios (from 1940 to 1999):
N ,..., 1 , t t ) t t ( ) t , u ( z ) t , u ( z Median ) u ( b i j i j i M j M = − − =
where zM(uα, t
j) and zM(uα, ti) are data points measured at years tj and ti, respectively. This estimator is widely used to compute linear trends in hydrometeorological series (e.g., de Lima et al., 2010; Modarres and Silva, 2007).
The trend significance map was obtained by computing the well known Mann-Kendall trend test (Kendall, 1975; Mann, 1945) at each grid cell of the AII scenarios (from 1940 to 1999).
2.2.4 Desertification indicators
Two desertification indicators are proposed here. The first one is named Dryness Susceptibility
Indicator, and aims at identifying desertification prone areas particularly affected by soil degradation and
water resources deficiency caused by dry climatic conditions. The second one, named Dryness Trend
Indicator, aims at providing a dryness rate and its geographical distribution. Areas experiencing a drying
trend should be considered a priority for mitigation actions such as irrigation and water management planning. These desertification indicators are comprehensively explained and characterized in Tables 2 and 3, respectively, using the framework considered by Enne and Zucca (2000).
The Dryness Susceptibility Indicator is defined as the probability of the AII values to be less than a fixed threshold in recent decades. It provides a probability of the severity of dryness at local and regional levels. Higher values of the indicator correspond to greater water resources variability and scarcity in time, thus such areas are more vulnerable to drought and desertification. In this study, the Dryness
Susceptibility Indicator corresponds to the probability map computed as the proportion of times the AII
values, from each grid cell of the 1940−1999 scenarios, are less than the value of the median of the scenarios corresponding to the climate normal 1961–1990 (0.56 mm).
The Dryness Trend Indicator is defined by the estimates of the trend slope of the AII in recent decades. Long term trends of increase in dryness and changes in its geographical distribution are important indicators for regional scale early warning and response systems for water resources management and agricultural planning. In this study, this indicator corresponds to the linear trend map obtained through the application of the Sen’s trend estimator to each grid cell of the 1940−1999 scenarios.
3. RESULTS
3.1 Space-time scenarios
The regional histograms of the AII and their basic statistics were calculated using the values from the scenarios corresponding to the climate normal 1961–1990 (Table 4). For illustration purposes, six scenarios of the AII were randomly selected to be shown in Fig. 2, as well as their uncertainty evaluation
measured by the standard deviation (Fig. 3). Lower values of the AII indicate higher dryness, and lower values of the standard deviation correspond to less spatial uncertainty. The 60 scenarios (not shown) computed for the 1940–1999 period indicate that the inland areas and the southeast region are frequently affected by dryness conditions (AII values smaller than 0.56 mm in more than 30 years) as shown below. The scenarios also point out drought events in some years, such as the extreme episodes of 1948/49 and 1980/81 that affected Portugal's territory (Trigo and DaCamara, 2000). For instance, the AII is less than or equal to 0.56 mm over 50% of the region within 1961–1990 (Table 4), while those AII values correspond to 99% of the study region in 1949.
Spatial uncertainty is absent where original stations are located (DSS is an exact spatial interpolator) and increases in areas without nearby stations. In general, the AII scenarios of the last two decades of the twentieth century (not shown) have less uncertainty than earlier years because of the higher availability of data in recent times. In fact, the average number of stations used to produce the 1940/79 scenarios was equal to 34, while it was equal to 82 in 1980/99. The probability map summarizing the spatial uncertainty (Fig. 4) corresponds to the estimated local probabilities of the scenarios' coefficient of variation to be greater than or equal to 25%. This probability is less than 0.5 for 95% of the study region. Therefore, most of the scenarios of the AII have little spatial uncertainty over the study region. Moreover, the AII scenarios have less spatial variability than the scenarios of the R5D index (highest consecutive 5-day precipitation total), which can be considered a flood indicator (Costa et al., 2008). The probability of the R5D index scenarios' coefficient of variation to be greater than or equal to 25% is less than 0.5 for 50% of the study region. This is not a surprising result given that dry events are much more continuous in space over this region than extreme precipitation events.
3.2 Local spatiotemporal dynamics
3.2.1 Dryness susceptibility patterns
The probability maps computed for the whole study period, from 1940 to 1999 (Fig. 5), show that the south coast and the inland regions of southern Portugal are highly prone to dry conditions, and that the southeast area is the most susceptible to drought. Accordingly, those areas are more frequently affected by severe dryness, which has adverse impacts in water resources and vegetation cover. More specifically, the results from Fig. 5b indicate that 5% of the study region (1243 Km2 located in the southeast area)
correspond to AII values below 0.481 mm in more than 36 years (probability greater than 0.6).
The Dryness Susceptibility Indicator (detailed in Sect. 2.2.4) corresponds to the probability map of the threshold equal to the median (Fig. 5a). Higher values of this indicator correspond to areas with higher rainfall scarcity in time, thus such locations are more vulnerable to desertification caused by erosion and salinization risk.
3.2.2 Dryness trends
The extent of dry conditions and drought has increased in the last thirty years of the twentieth century (Fig. 6). Most of the inland regions and the coastal areas of the south have been more affected by dryness in 1970–1999 than in 1940–1969 (Fig. 6A, Fig. 6C). Moreover, the extension of drought prone areas has increased, mainly in the southeast and in a few spots located inland (Fig. 6B, Fig. 6D).
These findings are also supported by the nonparametric estimates of the AII trend slope, which were computed at each grid cell of the 1940–1999 space-time scenarios (Fig. 7). The Dryness Trend Indicator (detailed in Sect. 2.2.4) corresponds to this local trend map (Fig. 7). There is a pattern of negative trend signals in the AII over most of the study region, which indicates an increasing trend in dry conditions through time. The local trend map (Fig. 7) also shows that the coastal areas of the south and the Castro-Verde, Aljustrel and Mértola municipalities have the highest tendency towards an increase in extreme dryness and drought. Most of the Odemira municipality has also experienced increased dryness conditions in the last sixty years of the twentieth century.
The statistical significance of the observed local trends has been evaluated through the Mann-Kendall trend test at each grid cell of the 1940–1999 space-time scenarios (Fig. 8). As expected, the increasing trend in dry conditions is statistically significant at the 1% level in the centre of the study region (most of the Castro-Verde, Aljustrel and Mértola municipalities) and along the southern coast.
The São Mamede mountain ridge, the highest in the Alentejo region with an altitude of 1000 m, lies in the extreme northeast. Just south of these mountains, there is an area with a significant increase in the AII values from 1940 to 1999 (Fig. 8), indicating decreasing dryness.
4. DISCUSSION
The spatial-temporal patterns of the AII reveal that large inland and coastal areas of the south of mainland Portugal are frequently subject to dry conditions. The Dryness Susceptibility Indicator (Fig. 5a) summarizes those dynamics by providing a probability for the severity of dryness over the study region. Hence, this indicator can contribute to the identification of desertification prone areas, with particular reference to degradation of soil and water resources.
The susceptibility map of desertification of the National Action Programme (NAP) to Combat Desertification is based on four composite indices (Rosário, 2004). One of them is the 'Aridity index' map, which is an indicator of climate quality. The 'Aridity index' map corresponds to the ratio of two maps: the annual average precipitation for the period 1959/60–1990/91 mapped through kriging using elevation as external drift, and the annual average potential evapotranspiration for the period 1961/90
mapped through ordinary kriging. The data used to create the 'Aridity index' map of the NAP (Rosário, 2004) was not available to us, thus only a visual comparison between this map and the Dryness
Susceptibility Indicator map (Fig. 5a) could be made. The spatial patterns of both maps are, in general,
similar, but Fig. 5a depicts a larger arid area in the southeast than the NAP's 'Aridity index'.
The development of indicators accounting for the dynamics of desertification processes and drought, particularly the trends and variability hidden behind "the means", should be further addressed (Pereira et al., 2006; Rosário, 2004). The Dryness Susceptibility Indicator has several advantages over the NAP's 'Aridity index' in this context. One of the most important is that it accounts for local climate dynamics, whereas the 'Aridity index' map is not fully appropriate to map the areas susceptible to desertification because it is based on average computations (Pereira et al., 2006). Additionally, the Dryness
Susceptibility Indicator only requires daily rainfall data from stations located in the study region, whereas
the 'Aridity index' map also requires an evaluation of the potential evapotranspiration. Moreover, the proposed indicator is easy to interpret and understand by stakeholders and policy makers, because it evaluates the local dryness susceptibility through probability values ranging from 0 to 1.
The Dryness Susceptibility Indicator aims at characterizing the typical climatic conditions of the region. On the other hand, the Dryness Trend Indicator (Fig. 7) characterizes changes in climatic conditions over time, thus it can help identify where desertification is becoming a problem from the climatic perspective. This indicator shows an increasing trend in dry conditions over large areas in the south of Portugal, particularly along the southern coast and in the Castro-Verde, Aljustrel and Mértola municipalities. Hence, these areas require more urgent mitigation measures to prevent water shortages and soil degradation.
Many studies addressed the influence of the North Atlantic Oscillation (NAO) index on
precipitation, particularly over the Iberian Peninsula (e.g., Puebla and Nieto, 2010; Rodríguez-Puebla et al., 2001; Trigo et al., 2002). The drier atmospheric conditions found in this study are likely related with the occurrence of more frequent positive phases of the NAO index and a displacement of the Azores high-pressure system during the last decades of the twentieth century (Trigo et al., 2002; Vicente-Serrano and López-Moreno, 2008; Visbeck et al., 2001). For instance, Rodríguez-Puebla and Nieto (2010) found a trend to more positive phases of the NAO index associated with a trend to less precipitation over the Iberian Peninsula in recent-past observations.
The observed spatial and temporal patterns of the AII are also consistent with the conclusions of Costa (2011) and Costa and Soares (2009a). The AII shows statistically significant trends towards drier climatic conditions in many stations located in the south of Portugal during the 1955–1999 period (Costa and Soares, 2009a). Additionally, Costa (2011) found severe drought frequency patterns in some areas of southern Portugal, as well as significant trends towards drying in the centre of the study region.
Moreover, Gallego et al. (2011) evaluated precipitation trends in the Iberian Peninsula and found a significant decrease in light rainfall days for 1903–2003 over southern Portugal. Other studies also
verified the occurrence of a decreasing trend in March precipitation over the twentieth century for continental Portugal (Corte-Real et al, 1998; de Lima et al., 2010; Trigo and DaCamara, 2000).
The increasing extent of dry conditions observed in this study is likely to be aggravated by the mid of the twenty-first century as pronounced increases in dry events frequency, magnitude, length, and area are expected for the Iberian Peninsula (Heinrich and Gobiet, 2011). Moreover, the length of dry spells is expected to increase over most of the mainland Portugal by the end of the twenty-first century causing a widening of the summertime dry season (Costa et al., 2011).
5. CONCLUSION
In the assessment of the spatiotemporal dynamics of the Aridity Intensity Index (AII) in the south of Portugal, we explored the application of direct sequential simulation to produce annual space-time scenarios of the AII from 1940 to 1999. Uncertainty evaluations of the proposed scenarios were also computed for each year. The spatial resolution of the gridded datasets, 800 m × 800 m grid cells, allowed for a detailed assessment of the spatiotemporal patterns of the AII.
The space-time analysis of the AII indicates the southeast region as the most threatened by droughts and extreme dryness. These climatic factors amplify the risks of soil erosion and land degradation in the mountainous areas of this region, which are also prone to extreme rainfall events (Costa et al., 2008; Durão et al., 2009). Coastal areas of the south and many inland areas are also subject to frequent periods of extreme dryness. Moreover, the local trend estimates of the AII reveal a tendency towards drier climatic conditions in the coastal areas and in some municipalities located at the centre of the study region. The occurrence of drought spells and scarce precipitation highly influence the productivity of rain fed agriculture in this region, where most of the country’s cereals are produced. Hence, urgent mitigation measures are advisable for those areas regarding water availability and soil suitability for irrigation.
Water deficits are of great ecological and agronomic importance, especially during the dry season, and an irregular precipitation regime highly influences the productivity of rain fed agriculture. Therefore, the results from this study have significant implications for evaluating the impact of climate variability on river basins and water resources management, agriculture planning, and sustainable development. The proposed desertification indicators are important instruments to support these management and planning decisions. The Dryness Susceptibility Indicator, which is based on the AII spatiotemporal dynamics, is expected to be a valuable alternative to the 'Aridity index map' of the Portuguese susceptibility map of desertification. Additionally, the Dryness Trend Indicator is expected to help stakeholders and policy makers to identify areas requiring more urgent attention to prevent the degradation of soil and water resources.
ACKNOWLEDGEMENTS
The authors acknowledge the valuable suggestions of the reviewers, which helped them to greatly improve the quality of the manuscript.
REFERENCES
Ceballos, A., Martínez-Fernández, J., Luengo-Ugidos, J.A., 2004. Analysis of rainfall trends and dry periods on a pluviometric gradient representative of Mediterranean climate in the Duero Basin, Spain. Journal of Arid Environments 58(2), 215–233.
Correia, F.N., 2004. Desertificação em Portugal: incidência no ordenamento do território e no desenvolvimento urbano, Vol. I, DGOTDU – Direcção Geral do Ordenamento do território e Desenvolvimento Urbano, Maio de 2004, 185 pp.
Corte-Real J, Qian B, Xu H. (1998). Regional climate change in Portugal: precipitation variability associated with large-scale atmospheric circulation. International Journal of Climatology 18, 619–635.
Costa, A.C. (2011). Local patterns and trends of the Standard Precipitation Index in southern Portugal (1940-1999). Advances in Geosciences 30, 11–16.
Costa, A.C., Soares, A., 2009a. Trends in extreme precipitation indices derived from a daily rainfall database for the South of Portugal. International Journal of Climatology 9(13), 1956–1975.
Costa, A.C., Soares, A., 2009b. Homogenization of climate data: review and new perspectives using geostatistics. Mathematical Geosciences 3(41), 291–305.
Costa, A.C., Durão, R., Pereira, M.J., Soares, A., 2008. Using stochastic space-time models to map extreme precipitation in southern Portugal. Natural Hazards and Earth System Sciences 4(8), 763–773.
Costa, A.C., Santos, J.A., Pinto, J.G., 2011. Climate change scenarios for precipitation extremes in Portugal. Theoretical and Applied Climatology, doi: 10.1007/s00704-011-0528-3.
de Lima, M.I.P., Carvalho, S.C.P., de Lima, J.L.M.P., 2010. Investigating annual and monthly trends in precipitation structure: an overview across Portugal. Natural Hazards and Earth System Sciences 10, 2429–2440.
Durão, R., Pereira, M.J., Costa, A.C., Côrte-Real, J.M., Soares, A., 2009. Indices of precipitation extremes in southern Portugal – a geostatistical approach. Natural Hazards and Earth System Sciences 1(9), 241–250.
Durão, R., Pereira, M.J., Costa, A.C., Delgado, J., del Barrio, G., Soares, A., 2010. Spatial-temporal dynamics of precipitation extremes in southern Portugal: a geostatistical assessment study. International Journal of Climatology 30(10), 1526–1537.
Enne, G., Zucca, C., 2000. Desertification indicators for the European Mediterranean region: state of the art and possible methodological approaches. ANPA – Agenzia Nazionale per la Protezione dell' Ambiente, NRD – Nucleo di Ricerca sulla Desertificazione, Università degli Studi di Sassari, Roma, Italy, 261 pp.
Fragoso, M., Gomes, P.T., 2008. Classification of daily abundant rainfall patterns and associated large-scale atmospheric circulation types in Southern Portugal. International Journal of Climatology 28(4), 537–544.
Gallego, M.C., Trigo, R.M., Vaquero, J.M., Brunet, M., Garcia, J.A., Sigro, J., Valente, M.A., 2011. Trends in frequency indices of daily precipitation over the Iberian Peninsula during the last century. Journal of Geophysical Research-Atmospheres 116, D02109, doi: 10.1029/2010JD014255.
García-Barrón, L., Aguilar, M., Sousa, A., 2011. Evolution of annual rainfall irregularity in the southwest of the Iberian Peninsula. Theoretical and Applied Climatology 103(1), 13–26.
Geist, H.J., Lambin, E.F., 2004. Dynamic causal patterns of desertification. Bioscience 54(9), 817– 829.
Gringof, I.G., Mersha, E., 2006. Assessment of desertification, drought and other extreme
meteorological events, in: Gathara, S.T., Gringof, L.G., Mersha, E., Sinha Ray, K.C., Spasov, P. (Eds.), Impacts of desertification and drought and other extreme meteorological events. World Meteorological Organization, WMO-TD No. 1343, CAgM Report No. 101, Geneva, Switzerland, pp. 12–29.
Haylock, M.R., Goodess, C.M., 2004. Interannual variability of European extreme winter rainfall and links with mean large-scale circulation. International Journal of Climatology 24, 759–776.
Heinrich, G., Gobiet, A., 2011. The future of dry and wet spells in Europe: A comprehensive study based on the ENSEMBLES regional climate models. International Journal of Climatology, doi: 10.1002/joc.2421.
Journel, A.G., 1994. Modelling uncertainty: some conceptual thoughts, in: Dimitrakopoulos, R. (Ed.), Geostatistics for the Next Century. Kluwer Academic Pub., Dordrecht, Netherlands, pp. 30–43.
Kendall, M.G., 1975. Rank Correlation Methods. Charles Griffin, London.
Klein Tank, A.M.G., Können, G.P., 2003. Trends in indices of daily temperature and precipitation extremes in Europe, 1946–99. Journal of Climate 16, 3665–3680.
Klein Tank, A.M.G., et al., 2002. Daily dataset of 20th-century surface air temperature and precipitation series for the European climate assessment. International Journal of Climatology 22, 1441– 1453.
Mann, H.B., 1945. Non-parametric test against trend. Econometrika 13, 245–259.
McKee, T.B., Doesken, N.J., Kleist, J., 1993. The relationship of drought frequency and duration to time scales, in: Amer. Meteor. Soc. (Eds.), 8th Conference on Applied Climatology, Preprints, 17–22 January, Anaheim, California, pp. 179–184.
Modarres, R., Silva, V.P.R., 2007. Rainfall trends in arid and semi-arid regions of Iran. Journal of Arid Environments 70(2), 344–355.
Mourato, S., Moreira, M., Corte-Real, J., 2010. Interannual variability of precipitation distribution patterns in Southern Portugal. International Journal of Climatology 30(12), 1784–1794.
Panagopoulos, T., Antunes, M.D.C., 2008. Integrating geostatistics and GIS for assessment of erosion risk on low density Quercus suber woodlands of south Portugal. Arid Land Research and Management 22(2), 159–177.
Paulo, A.A., Pereira, L.S., Matias, P.G., 2003. Analysis of local and regional droughts in southern Portugal using the theory of runs and the Standardised Precipitation Index, in: Rossi, G., Cancelliere, A., Pereira, L.S., Oweis, T., Shatanawi, M., Zairi, A. (Eds.), Tools for Drought Mitigation in Mediterranean Regions. Kluwer, Dordrecht, pp. 55–78.
Pereira, L.S., Louro, V., Rosário, L., Almeida, A., 2006. Desertification, territory and people, a holistic approach in the Portuguese context, in: Kepner, W.G., Rubio, J.L., Mouat, D.A., Pedrazzini, F. (Eds.), Desertification in the Mediterranean Region: a Security Issue. NATO Sc.Com., AK/Nato Publishing Unit, Springer-Verlag, Dordrecht, pp. 269–289.
Puigdefábregas, J., Mendizabal, T., 1998. Perspectives on desertification: western Mediterranean. Journal of Arid Environments 39, 209–224.
Rodríguez-Puebla, C., Nieto, S., 2010. Trends of precipitation over the Iberian Peninsula and the North Atlantic Oscillation under climate change conditions. International Journal of Climatology 30(12), 1807–1815.
Rodríguez-Puebla, C., Encinas, A.H., Saenz, J., 2001. Winter precipitation over the Iberian peninsula and its relationship to circulation indices. Hydrology and Earth System Sciences 5, 233–244.
Rosário, L., 2004. Indicadores de desertificação para Portugal Continental, Direcção-Geral dos Recursos Florestais, Lisboa, Maio 2004, 56 pp.
Roxo, M.J., Mourão, J.M., Rodrigues, L., Casimiro, P.C., 1999. The Alentejo region (Mértola municipality, Portugal), in: Kosmas, C., Kirkby, M.J., Geeson, N. (Eds.), Manual on key indicators of desertification and mapping environmentally sensitive areas to desertification. Medalus project –
Mediterranean desertification and land use, European Commission Publication EUR 18882, Luxembourg, pp. 80–87.
Santo, F.E., Guerreiro, R., Pires, V.C., Pessanha. L.E.V., Gomes, I.M., 2005. Monitoring agricultural drought in mainland Portugal, in: Boken, V.K., Cracknell, A.P., Heathcote, R.L. (Eds.), Monitoring and Predicting Agricultural Drought: A Global Study. Oxford University Press, New York, pp. 181–195.
Santos, J.A., Corte-Real, J., Leite, S.M., 2007. Atmospheric large-scale dynamics during the 2004/2005 winter drought in Portugal. International Journal of Climatology 27, 571–586.
Santos, J.A., Andrade, C., Corte-Real, J., Leite, S.M., 2009a. The role of large-scale eddies in the occurrence of precipitation deficits in Portugal. International Journal of Climatology 29, 1493–1507.
Santos, J.A., Pinto, J.G., Ulbrich, U., 2009b. On the development of strong ridge episodes over the eastern North Atlantic. Geophysical Research Letters 36, L17804. doi: 10.1029/2009GL039086.
Schreiber, K., Harrison, J., Sterk, G., 2008. Agrometeorological aspects of desertification, in: Guide to Agricultural Meteorological Practices (GAMP). Draft 3rd Edition, WMO-No.134, Geneva,
Switzerland, Ch. 10.
Sen, P.K., 1968. Estimates of the regression coefficient based on Kendall’s tau. Journal of the American Statistical Association 63, 1379–1389.
Sheffield, J., Wood, E.F., 2008. Projected changes in drought occurrence under future global warming from multi-model, multi-scenario, IPCC AR4 simulations. Climate Dynamics 31(1), 79–105.
Soares, A., 2001. Direct sequential simulation and cosimulation. Mathematical Geology 33(8), 911– 926.
Trigo, R.M., DaCamara, C., 2000. Circulation Weather Types and their impact on the precipitation regime in Portugal. International Journal of Climatology 20(13), 1559–1581.
Trigo, R.M., Osborn, T.J., Corte-Real, J.M., 2002. The North Atlantic Oscillation influence on Europe climate impacts and associated physical mechanisms. Climate Research 20, 9–17.
Vicente-Serrano, S.M., López-Moreno, J.I., 2008. Nonstationary influence of the North Atlantic Oscillation on European precipitation. Journal of Geophysical Research 113, D20120,
doi:10.1029/2008JD010382.
Visbeck, M.H., Hurrel, J.W., Polvani, L., Cullen, H.M., 2001. The North Atlantic Oscillation: Past, present and future. Proceedings of the National Academy of Sciences 98(23), 12876–12877.
doi:10.1073/pnas.231391598.
Wang, G., 2005. Agricultural drought in a future climate: results from 15 global climate models participating in the IPCC 4th assessment. Climate Dynamics 25, 739–753.
Wijngaard, J., Klein Tank, A.M.G., Können, G.P., 2003. Homogeneity of 20th century European daily temperature and precipitation series. International Journal of Climatology 23, 679–692.
FIGURES LEGENDS
Figure 1: Study region in the south of Portugal and stations' locations
Figure 2: AII scenarios for randomly selected years: a) 1945, b) 1949, c) 1955, d) 1963, e) 1985, f) 1997
Figure 3: Uncertainty of the AII scenarios shown in Fig. 2 measured by the standard-deviation
Figure 4: Probability of the local uncertainty of the AII scenarios, measured by the coefficient of variation, to be greater than or equal to 25% from 1940 to 1999
Figure 5: Probability of the local AII values to be less than fixed thresholds from 1940 to 1999: a) threshold equal to 0.557 mm; b) threshold equal to 0.481 mm
Figure 6: Probability of the local AII values to be less than fixed thresholds (in the A and C maps the threshold is equal to 0.557 mm; in the B and D maps it is equal to 0.481 mm) from 1940 to 1969 (A and B maps), and 1970 to 1999 (C and D maps)
Figure 7: Local linear trends in AII from 1940 to 1999 (Sen’s trend estimator)
Figure 8: Statistical significance of the AII local trends from 1940 to 1999 (Mann-Kendall trend test)
FIGURES PRINTING
TABLES
Table 1: Parameters of the space-time exponential variograms for the AII index, by decade
Decade Spatial range
(m) Temporal range (years) Sill 1940–49 90000 3.5 0.043 1950–59 70000 3.5 0.020 1960–69 80000 2 0.031 1970–79 50000 3 0.027 1980–89 70000 5 0.020 1990–99 70000 2 0.022
Table 2: Description of the Dryness Susceptibility Indicator
1. Definition
Brief definition This indicator provides a probability, at local and regional levels, of the severity of dryness. High values of the indicator correspond to drought prone areas. It is a critical environmental factor affecting the water resources and vegetation cover. It is defined as the probability of the Aridity Intensity Index (AII) to be less than a fixed threshold in recent decades. The AII is a numerical indicator of the degree of dryness of the climate and an indirect indicator of soil moisture availability.
Unit of measure Numeric value between 0 and 1
2. Position within the logical framework
Type of Indicator State. Represents the typical climatic conditions of the area under study.
3. Target and political pertinence
Objective The primary objective is the identification of desertification prone areas, with particular reference to degradation of soil and water resources caused by dry climatic conditions.
Importance with respect to desertification
The higher the Dryness Susceptibility Indicator of a region the greater the water resources variability and scarcity in time, the more vulnerable the area to drought and desertification. Extreme dryness damages the vegetation cover and is one of the main causes of soil vulnerability to erosion, salinization risk, and fire risk.
Secondary objectives of the indicator
Research on the local dynamics of individual processes linked to land degradation and desertification.
4. Methodological description and basic definitions
Definitions and basic concepts
The Dryness Susceptibility Indicator is defined as the probability the AII values to be less than a fixed threshold in recent decades. The AII is defined as the ratio between the total rain on dry days and the number of dry days per year. In the south of Portugal, a dry day is defined as a day with less than 10 mm of precipitation. A different threshold can be used to typify a dry day in other regions of the world. Benchmarks
Indication of the values/range of values
Threshold values distinguishing the increasing susceptibility to dryness: 0.5, 0.7 and 0.8.
Methods of measurement
The AII can be easily calculated using daily precipitation data. A set of monitoring stations with long-term precipitation series is desirable, but stations with shorter and non-complete records can and should be included.
A spatial interpolation method is used to produce spatiotemporal scenarios (maps) of the AII for each year. Geostatistical simulation algorithms such as Direct Sequential Simulation (Soares, 2001) are recommended, but other kriging techniques or Inverse Distance Weighting interpolation can also be applied to obtain the AII yearly surfaces. The Dryness Susceptibility Indicator is then evaluated as the proportion of the estimated values at each grid cell of all yearly scenarios that are smaller than a fixed threshold (e.g., the regional median of the AII for the 1960/91 climate normal).
Limits of the indicator
The quality of the indicator depends on the number and distribution of meteorological monitoring stations over an area through time. For each year, the stations have to be evenly distributed across an area covering the whole range of climatic conditions.
Other limitations are linked to the geostatistical method adopted to interpolate the yearly AII values. Interpolation usually leads to a smoothing of the distribution inferred by the observations and thus to a loss of variance. Geostatistical simulation algorithms, such as the Direct Sequential Simulation (Soares, 2001), can be used to overcome this limitation. However, the trade-off is that they are computationally more demanding.
5. Evaluation of data needs and availability
Data required to calculate the indicator
Data required are daily rainfall totals available from the various stations located in the area under study.
Data sources Necessary data are usually available and accessible and the cost/benefit ratio is reasonable. Availability of data from national and international sources
Data can be obtained from various regional, national or international institutions involved in the collection and elaboration of such data.
Table 3: Description of the Dryness Trend Indicator
1. Definition
Brief definition This indicator provides a measure of the trends of change in dryness, at local and regional levels. Negative values of the indicator correspond to increasing dryness. It is a critical environmental factor linked to water availability and soil suitability for irrigation.
It is defined by the estimates of the trend slope of the Aridity Intensity Index (AII) in recent decades. The AII is a numerical indicator of the degree of dryness of the climate and an indirect indicator of soil moisture availability.
Unit of measure Numeric value
2. Position within the logical framework
Type of Indicator State/Impact. This indicator provides a diagnosis, integrated in space and time, of the region’s climatic trends.
3. Target and political pertinence
Objective The primary objective is to provide the dryness rate and its geographical distribution, as a starting point for prioritising mitigation actions to prevent the degradation of soil and water resources.
Importance with respect to desertification
Long-term trends of increasing dryness and changes in dryness geographical distribution are important indicators for regional scale early warning and response systems regarding water resources management and agricultural planning.
4. Methodological description and basic definitions
Definitions and basic concepts
The Dryness Trend Indicator corresponds to the estimates of the AII trend slope in recent decades. The AII is defined as the ratio between the total rain on dry days and the number of dry days per year. In the south of Portugal, a dry day is defined as a day with less than 10 mm of precipitation. A different threshold can be used to typify a dry day in other regions of the world.
Benchmarks Indication of the values/range of values
Negative trend slope over the longest possible time series of yearly AII values.
Methods of measurement
The AII can be easily calculated using daily precipitation data. A set of monitoring stations with long-term precipitation series is desirable, but stations with shorter and non-complete records can and should be selected.
A spatial interpolation method is used to produce spatiotemporal scenarios (maps) of the AII for each year. Geostatistical simulation algorithms such as Direct Sequential Simulation (Soares, 2001) are recommended, but other kriging techniques or Inverse Distance Weighting interpolation can also be applied to obtain the AII yearly surfaces. The Dryness Trend Indicator is then evaluated through the nonparametric estimates of the trend slope magnitude (Sen, 1968), computed at each grid cell of all scenarios.
Limits of the indicator
The quality of the indicator depends on the number and distribution of meteorological monitoring stations over an area through time. For each year, the stations have to be evenly distributed across an area covering the whole range of climatic conditions.
Other limitations are linked to the geostatistical method adopted to interpolate the yearly AII values. Interpolation usually leads to a smoothing of the distribution inferred by the observations and thus to a loss of variance. Geostatistical simulation algorithms, such as the Direct Sequential Simulation (Soares, 2001), can be used to overcome this limitation. However, the trade-off is that they are computationally more demanding.
5. Evaluation of data needs and availability
Data required to calculate the indicator
Data required are daily rainfall totals available from the various stations located in the area under study.
Data sources Necessary data are usually available and accessible and the cost/benefit ratio is reasonable. Availability of data from national and international sources
Data can be obtained from various regional, national or international institutions involved in the collection and elaboration of such data.
Table 4: Summary statistics of the AII computed from the scenarios (maps) of the climate normal 1961–1990
Regional statistics Climate normal
1961/90 Mean 0.56 Standard-deviation 0.12 Skewness 0.11 Kurtosis 0.22 Quantiles 100% Max 1.02 99% 0.85 95% 0.75 90% 0.71 75% Q3 0.64 50% Median 0.56 25% Q1 0.48 10% 0.41 5% 0.37 1% 0.29 0% Min 0.09