Developing a site-conditions map for seismic hazard
Assessment in Portugal
J. Narciso, S. Vilanova, I. Lopes & C. S. Oliveira
ICIST, Instituto Superior Técnico, Lisboa, Portugal
J. Carvalho & C. Pinto
Laboratório Nacional de Energia e Geologia, Lisboa, Portugal
J. Borges
Universidade de Évora, Portugal
E. Nemser
URS Corporation, USA SUMMARY:
The evaluation of site effects on a broad scale is a critical issue for seismic hazard and risk assessment, land use planning and emergency planning. As characterization of site conditions based on the shear-wave velocity has become increasingly important, several methods have been proposed in the literature to estimate its average over the first thirty meters (Vs30) from more extensively available data. These methods include correlations with geologic-geographic defined units and topographic slope. In this paper we present the first steps towards the development of a site–conditions map for Portugal, based on a regional database of shear-wave velocity data, together with geological, geographic, and lithological information. We computed Vs30 for each database site and classified it according to the corresponding geological-lithological information using maps at the smallest scale available (usually 1:50000). We evaluated the consistency of Vs30 values within generalized-geological classes, and assessed the performance of expedient methodologies proposed in the literature.
Keywords: Seismic hazard, site conditions, shear wave velocity, Vs30.
1. INTRODUCTION
Seismic hazard maps, as spatial representations of ground motions for fixed probability levels, are essential tools to address land-use planning, engineering design, and ultimately seismic risk mitigation. However, due to the important role played by site-conditions, a seismic hazard map produced for uniform site conditions may be misleading in identifying areas with higher degrees of susceptibility due to earthquake effects. The inclusion of site-specific conditions in a regional sense is therefore important to adequately represent the seismic hazard.
Shear-wave velocity data has become increasingly important in evaluating site conditions for ground motion amplification. In particular, its average over the first thirty meters (Vs30), is currently the standard parameterisation for addressing site-conditions in recent building codes (e.g., BSSC, 2004, Eurocode 8), in the development of ground-motion prediction equations (e.g., Boore and Atkinson, 2008), and in addressing the applicability of the predictive equations outside the region that provided ground motion data (e.g., Vilanova et al., 2012).
The project SCENE (Site Condition Evaluation for National seismic hazard Estimation), funded by the Portuguese Foundation for Science and Technology (FCT), aims to characterize the site conditions for near-surface material (upper 30m), and to outline a first-order site effects map to be used in seismic hazard assessment at a national level. We developed a database of available shear-wave velocity data, the vast majority of which were acquired in southern Portugal, in the context of ERSTA and CAPSA campaigns (Carvalho et al. 2008, Carvalho et al. 2009). Few sites analyzed with surface wave dispersion methods by Lopes et al. (2005) were also included. In addition, we are currently performing new shear-wave refraction profiles at sites were permanent seismic stations are deployed. Fifteen out of 30 of such profiles have already been interpreted and included in the database. Likewise, we also used new profiles acquired and processed in the context of ongoing FCT project NEFITAG
(REFERENCE TO AN ABSTRACT OR PAPER?).
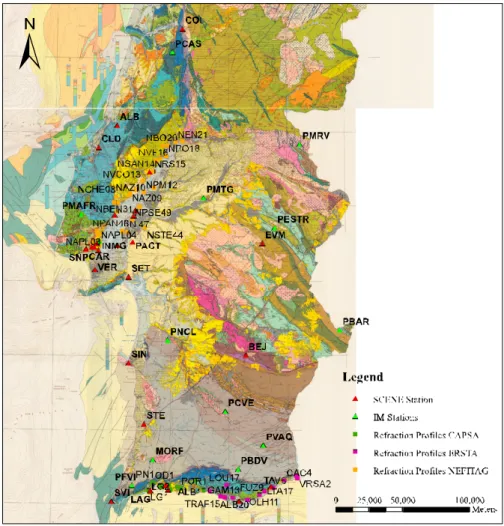
Figure 1. Shear-wave velocity database on top of geological map (adapted from Oliveira et al. 1992).
2. DATA AND METHODS
Usually the methods to measure shear-wave velocity depth profiles are divided in two categories: invasive and non-invasive. The invasive methods for estimating shear-wave velocity profiles are high-cost approaches but they are well known and reliable. The non-invasive methods offer the advantage of providing a more aerially extensive sample of the subsurface with less cost. Due their lower cost and simplicity in acquisition, non-invasive methods are becoming more popular in estimating shear-wave velocity profiles. The general methodology involves the acquisition of surface or body shear-waves at the ground surface (either from active or passive sources) and resolving the subsurface structure by either forward or inverse modeling.
We used seismic refraction as the main tool for evaluating the shear-wave profiles at the chosen sites both in SCENE and NEFITAG projects. This method uses active shear-wave sources and a number of aligned receivers located at the surface. The data interpretation was performed with commercial software relying on the generalized reciprocal method (Palmer, 1980) and slope intercept method, and the method of Haeni et al. (1987). The latter uses delay-times for constraining a first preliminary velocity model, followed by three iterations of ray tracing and minimization of residuals by least squares.
of previous geological and geotechnical depth information in the vicinity (from water supply and engineering purposes), and the existence of adequate conditions for performing surveys. Additionally, project NEFITAG focused on the softer sediments of the Lower Tagus Valley. These data were included in a GIS, together with data available from previous studies, and geological and geotechnical depth information that was collected for each site from engineering reports. The two-dimensional shear-wave profiles were sampled to obtain a set of one-dimensional profiles, which were used to calculate a mean value of Vs30 for each profile.
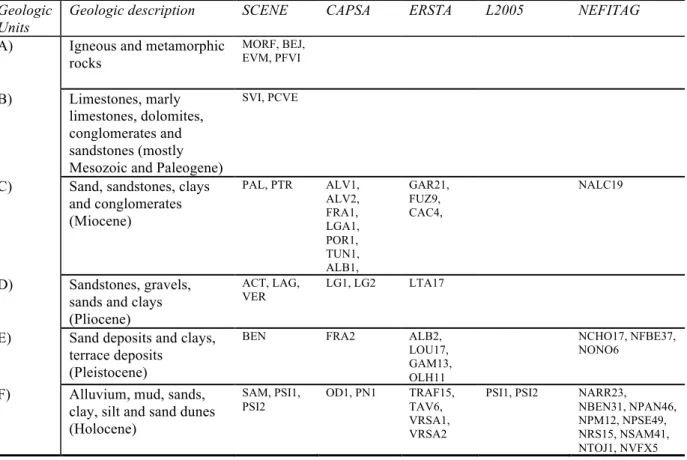
We performed a careful evaluation of the geological conditions at database sites, using the smallest scale available maps (usually 1:50000). The generalized geological units that are portrayed in the dataset are summarized in Table 1.1. Most sites are located in both Tertiary and Quaternary formations, and hard rocks are not currently well represented in the database.
Table 1.1. Geologic Units and corresponding shear wave profiles in the database.
Geologic Units
Geologic description SCENE CAPSA ERSTA L2005 NEFITAG
A) Igneous and metamorphic rocks MORF, BEJ, EVM, PFVI B) Limestones, marly limestones, dolomites, conglomerates and sandstones (mostly Mesozoic and Paleogene)
SVI, PCVE
C) Sand, sandstones, clays and conglomerates (Miocene) PAL, PTR ALV1, ALV2, FRA1, LGA1, POR1, TUN1, ALB1, GAR21, FUZ9, CAC4, NALC19 D) Sandstones, gravels, sands and clays (Pliocene)
ACT, LAG,
VER LG1, LG2 LTA17
E) Sand deposits and clays, terrace deposits
(Pleistocene)
BEN FRA2 ALB2,
LOU17, GAM13, OLH11
NCHO17, NFBE37, NONO6
F) Alluvium, mud, sands, clay, silt and sand dunes (Holocene) SAM, PSI1, PSI2 OD1, PN1 TRAF15, TAV6, VRSA1, VRSA2
PSI1, PSI2 NARR23,
NBEN31, NPAN46, NPM12, NPSE49, NRS15, NSAM41, NTOJ1, NVFX5
3. RESULTS
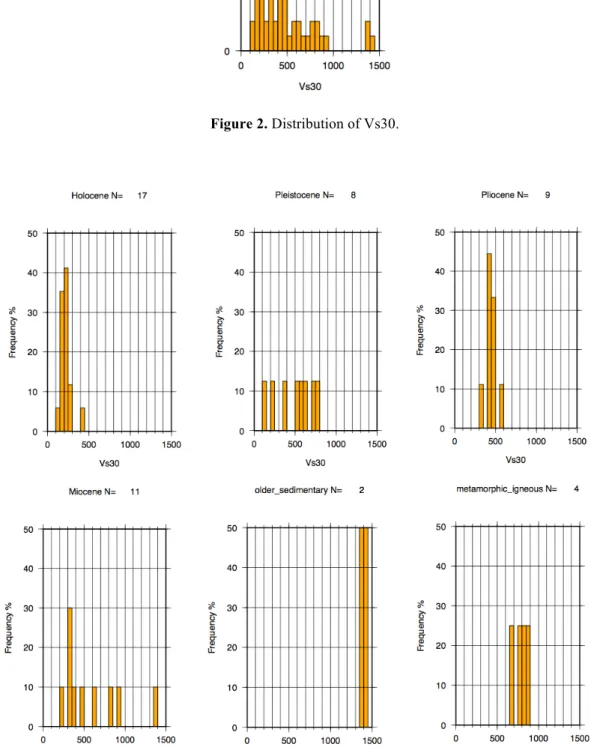
The distribution of all VS30 computed from the database is presented in Figure 1. The database fairly covers Vs30 values in the range 100-1000 m/s, but higher values are poorly represented. The distributions of Vs30 according to the generalized geological units described in Table 1.1 are presented in Figure 2. From the analysis of Figure 2 one can conclude that while for some units there is aremarkable coherence of Vs30 values, for others the values are distributed over a wide range. In particular, sites classified as Miocene display Vs30 values that span from 200 m/sto 1400 m/s. The Miocene-Pliocene distinction was particularly difficult to address because some contiguous geological maps in the Algarve regions depicted the same formation with different age interpretation (Miocene or Plio-Quaternary).
Figure 2. Distribution of Vs30.
4. EVALUATION OF VS30 PROXIES
Wills and Clahan (2006) proposed a methodology to estimate Vs30 values for California based on geologically/geographically-defined units. On the other hand, Wald and Allen (2007) suggested that measurements of topographic slope from medium resolution digital elevation models could be used as a proxy for Vs30. The rational under the latter method is that more competent high-velocity materials can maintain a steep-slope while fine basin soft sediments will be deposit at nearly flat basins. However, the applicability of such expeditious empirical methods may be region-dependent (e.g.,
incluir REFERENCIAS) thus requiring regional validation. To address this issue we evaluated the
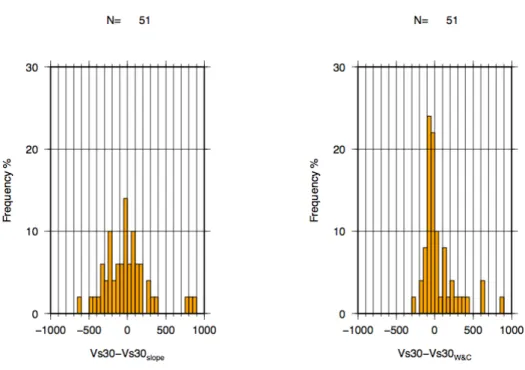
Vs30 from both methodologies at the database sites, and calculated the residuals to the VS30 values computed from the profiles. Figure 4 presents the overall performance of both methods.
Figure 4. Distribution of Vs30 residuals (see text for details).
While both methods produced a fairly unbiased distribution of residuals, the dispersion is slightly lower for the geologically-geographically derived values. To address eventual geological dependences on the performance of the methods we plotted the residual distributions for each generalized geological unit of Table 1.1. The results are presented in Figure 5. The geological/geographical-defined units method shows, in general, a better performance with respect to the topographic slope method. This is particularly true for Holocene deposits. However, for the most problematic Pleistocene and Miocene units both methods display similarly large dispersion of residuals.
4. DISCUSSION
We presented a preliminary study of the characteristics of Vs30 distributions for Portugal. We also addressed the applicability of two Vs30 proxies proposed in the literature. Although the database is still very incomplete since the acquisition/interpretation of a considerable number of shear-wave velocity profiles under projects SCENE and NEFITAG is still in progress, the analysis suggest that while some geological units display very consistent values of Vs30, others are characterized by a broad dispersion. In addition, both the Wills and Clahan (2006) geological/geographical method and the Wald and Allen (2007) topographic slope method provide reasonably good estimates of Vs30 for some geological classes while producing disparate results for others. It seems to be particularly difficult to evaluate and systematize the Vs30 values obtained for Miocene formations.
AKCNOWLEDGEMENTS
This work was supported by the Portuguese Foundation for Science and Technology (FCT), trhough projects SCENE (PTDC/CTE-GIX/103032/2008) and NEFITAG.
REFERENCES
Boore, D.M., Atkinson, G.M. (2008). Ground-motion prediction equations for the average horizontal component of PGA, PGV, and 5%-damped PSA at spectral periods between 0.01s and 10.0s. Earthq. Spectra. 24, 99-138.
Building Seismic Safety Council (BSSC) (2004). NEHRP recommended provisions for seismic regulations for new buildings and the other structures, part 1-provisions, part 2-commentary. Report No. FEMA 450, 2003 edition, prepared by the BSSC for the Federal Emergency Management Agency.
Carvalho, J., Dias, R., Pinto, C., Leote, J., Mendes-Victor, L. (2008). A Soil Classification for Seismic Hazard Assessment and Mitigation of the Algarve. 14Th World Conference on Earthquake Engineering, 12-17 Oct. Beijing, China.
Carvalho, J., Torres, L., Castro, R., Dias, R., Mendes-Victor, L. (2009). Seismic Velocities and Geotechnical data Applied to the Soil Microzoning of Western Algarve, Portugal. Journal of Applied Geophysics.Vol 68, pp. 249-258.
Eurocode 8: design of structures for earthquake resistance part 1: general rules, seismic actions and rules for buildings. Technical report, European Norm. European Committee for Standardization. Central Secretariat, rue de Stassart 36, B-1050 Brussels.
Haeni, F. P., Deborah, G., Ellefsen, K. (1987). Micro-computer based version of SIPT – A program for the interpretation of seismic refraction data. USGS Open-File Reports: 87-103-A.
Lopes I., Santos, J.A., Almeida, I. (2005). Use of surface waves for geotechnical characterization of soft alluvial deposits - the Póvoa de Santa Iria case study. Near Surface Geophysics 3:1, EAGE (European Association of Geoscientists & Engineers), 47-56.
Oliveira, T. (1992). Carta Geológica de Portugal, escala 1:500.000 (coord. T. Oliveira). Serviços Geológicos de Portugal.
Palmer, D. (1980). The generalized reciprocal method of seismic refraction interpretation. K. B. S. Burke (Ed.), Society of Exploration Geophysicists, Tulsa, OK.
Vilanova, S.P., Fonseca, J., and Oliveira, C.S. (2012). Ground-Motion Models for Seismic-Hazard Assessment in Western Iberia: Constraints from Instrumental Data and Intensity Observations. Bulletin of the Seismological Society of America, 112, 1, 169-184.
Wald, D.J., Allen, T.I. (2007). Topographic Slope as a Proxy for Seismic Site Conditions and Amplification. Bull. Seism. Soc. Am. 97, 1379–1395.
Wills, C. J., and K. B. Clahan (2006). Developing a map of geologically defined site-condition categories for California. Bull. Seism. Soc. Am. 96, 1483–1501.