Challenges and Opportunities of Transition to Sustainable
Electricity Generation
Miguel da Costa Rebelo Gomes Rodrigues
Dissertação de Mestrado
Orientador na FEUP: Carlos Pinho Orientador UNESCAP: Sergey Tulinov
Mestrado Integrado em Engenharia Mecânica
Challenges and Opportunities of Transition to Sustainable Electricity Generation
iii
Resumo
O consumo de electricidade tem vindo a aumentar significativamente na região da Ásia-Pacífico devido a um grande crescimento populacional, e uma grande industrialização, entre outros factores. A produção da electricidade necessária para dar resposta à procura dos consumidores nesta região é ainda muito dependente de combustíveis fósseis, principalmente carvão, que emitem uma grande quantidade de gases com efeito de estufa para a atmosfera (GEE), responsáveis pelo aumento da temperatura global da terra e consequente intensificação das alterações climáticas. O uso de carvão para a produção de electricidade é a tecnologia mais poluente neste sector, havendo alternativas maduras e com custos competitivos com impactos comparativamente muito reduzidos. Este combustível é extensivamente utilizado devido à grande disponibilidade deste recurso nesta região, o que minimiza os custos e a dependência geopolítica da mesma.
Desta forma torna-se imperativo explorar alternativas ao consumo de combustíveis fósseis no sector elétrico, dando especial relevo ao carvão. O aquecimento global é um tema que marca a atual sociedade e que, se não for abordado com seriedade, tem a capacidade de comprometer as futuras gerações, daí a sua importância e urgência.
Este relatório tem como objectivo contextualizar a situação do setor elétrico na região da Ásia-Pacifico, com ênfase na China. São apresentadas as tendências deste sector, as tecnologias produtoras de elecricidade com maior nivel de maturidade e os seus impactos, e é feita uma comparação entre as tecnologias, as suas vantagens, desvantagens e competitividade de custos.
Uma vez que o presente relatório foi realizado no contexto de uma equipa dominada por profissionais da área de economia, política e direito, fez-se um esforço por usar linguagem não demasiado técnica e dar especial relevância aos conceitos base associados à produção de energia elétrica de forma a conseguir cativar a audiência em causa, dando-lhes ao mesmo tempo uma informação tecnológica complementar.
Challenges and Opportunities of Transition to Sustainable Electricity Generation
v
Abstract
Electricity consumption has been increasing significantly in the Asia-Pacific region, due to a large growth in population and a broad industrialization, among others. The production of electricity necessary to meet the consumers demand in this region is still very dependent on fossil fuels, mainly coal, which emits a large amount of greenhouse gases into the atmosphere (GHG), contributing for the increase of global temperature and consequent intensification of climate change. The use of coal to produce electricity is the most polluting out of all electric power generation technologies, with mature alternatives at competitive costs and comparatively reduced environmental impacts. Due to the great availability of coal in the Asia-Pacific region, this is used extensively, which minimizes costs and the regions geopolitical dependence.
It is imperative to explore alternatives to the consumption of fossil fuels in the electricity sector, with a highlight on coal. Global warming marks the current society, and if not taken seriously, has the capacity to compromise future generations - hence its importance and urgency.
This report aims to contextualize the situation of the electricity sector in the Asia-Pacific region, with emphasis on China. This work presents the trends of the electricity sector, the most mature electricity generation technologies and their impacts. Afterwards, it is made a comparison between the different technologies, their advantages, disadvantages, and cost competitiveness.
Since this report was developed in a team dominated mainly by professionals of areas related to economy, politics and law, an effort was made to use a language not too technical and give especial relevance to the basic concepts of electric power generation in order to try to captivate the audience. However, these simple concepts might give them a complementary set of technical information.
Challenges and Opportunities of Transition to Sustainable Electricity Generation
vii
Acknowledgments
I would like to express my grattitude for all the support given by Professor Carlos Pinho, in particular for his availability and continuous feedback.
To everyone in the Energy division of the United Nations Economic and Social Commission for the Asia and Pacific, in particular my tutor Mr. Sergey Tulinov, for all the support and for making sure that despite the current situation of the COVID-19 pandemic which made it mandatory to implement a work from home modality, I always felt integrated in the team and in constant contact with everyone.
To everyone that made part of my temporary journey in Bangkok, in particular my host family and friends, of which I grew very fond of, for all the support given throughout this abnormal period, marked by the pandemic situation, which made it especially difficult and morally challenging to be such a long way from home.
To Maria, for so much that are hardly enough words that would do it justice.
To my parents, for their incessant support throughout all my life. For giving me the opportunity to have a great education, both academically and personally. I am and will always be eternally grateful.
Challenges and Opportunities of Transition to Sustainable Electricity Generation ix
Table of contents
1. Introduction ... 1 1.1 Project Context... 1 1.2 UNESCAP ... 1 1.3 Objectives... 1 1.4 Methodology ... 2 1.5 Report structure ... 22. Overview of the global and Asia-Pacific electricity mix ... 5
3. Power generation technologies and sustainability ... 9
3.1 Fossil Fuels ... 9 3.1.1 Coal ... 10 3.1.2 Natural Gas ... 16 3.2 Renewable Energy ... 20 3.2.1 Hydropower ... 20 3.2.2 Wind Energy ... 23 3.2.3 Solar Photovoltaic ... 26
4. Environmental aspects of power generation ... 31
4.1 Global warming ... 31
4.2 Air pollution ... 32
5. Comparing electric power generation technologies ... 35
5.1 Coal and natural gas fired power generation ... 35
5.2 Levelized cost of electricity ... 37
6. Coal phase-out success story ... 39
7. National policies for increasing sustainability of electricity generation in China .... 43
8. Conclusions... 53
References ... 55
Challenges and Opportunities of Transition to Sustainable Electricity Generation
xi
List of Acronyms
AC – Alternate CurrentA-USC - Advanced Ultra-supercritical BP – British Petroleum
CCGT - Combined Cycle Gas Turbine CCS – Carbon Capture and Storage
CNPC - China National Petroleum Corporation CO2eq – Carbon Dioxide Equivalent
CPS – Carbon Price Support DC – Direct Current
EIA – U.S. Energy Information Administration ETS - Emissions Trading Scheme
EU – European Union
FGD - Flue Gas Desulphurization FOLU - Forestry and Other Land Use GDP – Gross Domestic Product GHG – Greenhouse Gas
GWP – Global Warming Potential HRSG - Heat Recovery Steam Generator IEA – International Energy Agency
IPCC - Intergovernmental Panel on Climate Change IRENA – International Renewable Energy Agency LCOE – Levelized Cost of Electricity
LCPD - Large Combustion Plants Directive LNG – Liquified Natural Gas
NEA – China National Energy Administration
NDRC – China National Development and Reform Commission O&M – Operation and Maintenance
PM – Particulate Matter PV – Photovoltaic SC - Supercritical
SDG – Sustainable Development Goal SI - International System of Units UK – United Kingdom
UNESCAP - United Nations Economic and Social Commission for the Asia Pacific UNFCCC - United Nations Framework Convention on Climate Change
USC – Ultra-supercritical YoY – Year on year
Challenges and Opportunities of Transition to Sustainable Electricity Generation
xiii
List of Figures
Figure 2.1 - Electricity generated by region (BP, 2019) ... 6
Figure 2.2 - Installed capacity of electricity generation technologies worldwide (EIA, 2018) ... 7
Figure 3.1 - Electricity generated from coal worldwide (EIA, 2019) ... 10
Figure 3.2 - Installed capacity of coal powered power plants worldwide (EIA, 2019) ... 11
Figure 3.3 - Capacity factor of coal fired power plants worldwide (EIA, 2019) ... 11
Figure 3.4 - Layout of a typical coal fired power plant (Tenesse Valley Authority) ... 12
Figure 3.5 - Characteristics of different types of boilers ... 13
Figure 3.6 - Water tube boiler ... 14
Figure 3.7 - The blades of a steam turbine ... 16
Figure 3.8 - Electricity generation by natural gas fired power plants (EIA, 2019) ... 17
Figure 3.9 - Installed capacity of natural gas fired power plants worldwide (EIA, 2019) ... 17
Figure 3.10 - Capacity factor of natural gas fired power plants ... 18
Figure 3.11 - Layout of a gas turbine ... 19
Figure 3.12 - Diagram of a typical CCGT power plant ... 19
Figure 3.13 - Electricity generated using hydropower worldwide (BP, 2019) ... 21
Figure 3.14 - Installed capacity of hydro generation worldwide (IRENA, 2018) ... 21
Figure 3.15 - Capacity factor of hydro generation worldwide ... 21
Figure 3.16 - Layout of a typical large hydroelectric power plant (EIA, 2019) ... 22
Figure 3.17 - Electricity generated by wind turbines (BP, 2019) ... 23
Figure 3.18 - Installed capacity of wind turbines worldwide (EIA, 2019) ... 24
Figure 3.19 - Capacity factor of wind turbines worldwide ... 24
Figure 3.20 - Representation of a typical wind converter ... 25
Figure 3.21 - Relation between air speed and power output of a typical wind turbine (Dvorak, 2017) ... 26
Figure 3.22 - Electricity generated from solar PV panels worldwide (BP, 2019) ... 27
Figure 3.23 - Installed capacity of solar PV panels (EIA, 2019) ... 27
Figure 3.24 - Capacity factor of PV solar panels ... 28
Figure 3.25 - PV solar panel composed of several PV cells ... 28
Figure 3.26 - Power curve of a typical PV module (Duffie and Beckman 2013) ... 29
Figure 3.27 - Effect of PV cell temperature in I and V (Duffie and Beckman 2013) ... 29
Figure 3.28 - Effect of incident radiation in I and V (Duffie and Beckman, 2013) ... 30
Figure 5.1 - LCOE interval of different electric power generation technologies (Belyakov, 2019; IRENA, 2020) ... 37
Figure 6.1 - Evolution of the UK power mix (IEA, 2019) ... 39
Figure 6.2 - Evolution of the electricity consumption in the UK (IEA, 2019)………40
Figure 7.1 - Share of electricity generated from coal in countries of the Asia-Pacific region with a share larger than 30 % (IEA, 2019) ... 44
Figure 7.2 - Electricity generation mix of China in 2018, values in TWh (IEA, 2019) .... 44
Figure 7.3 – Electric power generation forecast by source under current policies scenario (CNPC, 2019) ... 50
Challenges and Opportunities of Transition to Sustainable Electricity Generation
xv
List of Tables
Table 2.1 - Electricity generated by region and growing trends (BP, 2019) ... 6
Table 3.1 - Types of Coal (EIA, 2019) ... 12
Table 3.2 - Classification of coal-fired power plants using water properties (Breeze, 2015) ... 13
Table 4.1 - GWP and atmospheric lifetime of most common greenhouse gases (IPCC, 2014) ... 32
Table 5.1 - CO2 emissions per MWh of coal and natural gas fired power plants... 35
Table 7.1 - Trends of electricity generation in China (IEA, 2019) ... 45
Table 7.2 - Policies related to the energy sector to promote climate mitigation ... 46
Table 7.3 - Collection of most relevant policies related to coal-fired power plants ... 47
Table 7.4 – Most relevant policy related to natural gas fired power plants ... 47
Table 7.5 - Most relevant policies related to hydroelectric power plants ... 47
Table 7.6 - Most relevant policies related to wind power ... 48
Table 7.7 - Most relevant policies related to solar power ... 48
Table 7.8 - Collection of latest policies related to electricity generation and transmission ... 49
Challenges and Opportunities of Transition to Sustainable Electricity Generation
1
1. Introduction
This chapter focuses on contextualising this report, its methodology and objectives.
1.1 Project context
This work performs an overview of the electric sector, in particular the most used technologies to generate electricity, both using fossil fuels and renewable sources. Moreover, it compares their advantages and disadvantages, explains their impacts on the environment, why these matter and possible pathways to minimize the negative externalities of the electricity sector. Lastly it is made an overview of the Chinese electricity sector and a collection of its latest policies.
The present report was developed as part of an internship in the Energy Division of the United Nations Economic and Social Commission for the Asia Pacific (UNESCAP) and is of relevance to promote the dialogue and share knowledge about increasing the sustainability of the electricity sector. Furthermore, it is of relevance to update the website (asiapacificenergy.org) developed by the energy division with the latest policies related to the electricity sector of China as well as provide the division with capacity building on the technical aspects related to different electricity generation technologies.
The internship was in Bangkok, Thailand, where the UNESCAP is located. Although, due to the COVID-19 pandemic, the work was developed remotely.
1.2 UNESCAP
The United Nations Economic and Social Commission for the Asia Pacific serves as a platform to promote cooperation and share knowledge within its member countries to achieve sustainable development in the region. UNESCAP provides research, analysis, policy advice, capacity building and technical assistance to governments with the aim to increase sustainability and inclusive development. The work of the energy division focuses on providing affordable, reliable, and sustainable energy for all Asia Pacific, as outlined in the sustainable development goal (SDG) number seven.
1.3 Objectives
This report has the following objectives:
2
• Analyse the technical concepts related to different electricity generation technologies;
• Comparing different electricity generation technologies, its environmental impacts, advantages and disadvantages;
• Provide an example of a coal phase out success story; • Overview of the Chinese electricity sector.
1.4 Methodology
The elaboration of this report went through different phases although it was monopolized by research work, identifying literature about the underlying theme and interiorizing its information. Firstly, this consisted on reading different books, articles and websites about coal, natural gas, solar photovoltaic, wind turbines and hydropower, how these are used to generate electricity and their presence and growing trends around the globe. Then a lot of research was done around the Asia Pacific region, its demographics, gross domestic products (GDP), electricity growth trends and fossil fuels trade. Also, a collection of information was made on the topic of climate change, global warming, and climate mitigation. Lastly a search for the latest policies of the Chinese electricity was made, exploring several official documents, and identifying their main goals.
1.5 Report structure
This report consists of eight chapters, starting with the current one that gives an introduction and contextualization of the report itself.
The second chapter makes an overview of the electricity generation worldwide and compares it to the scenario of the Asia Pacific region.
The third chapter makes a state-of-the-art review of some of the most used electricity generating technologies. It focuses on coal and natural gas power plants and on renewables such as solar photovoltaic (PV), wind turbines and hydropower. Moreover, it identifies the growing trends of each technology installed capacity.
Fourth chapter focuses on the environmental impacts related to electric power generation, namely global warming, and air pollution. What causes it and its impacts.
Fifth chapter makes a comparison across the technologies presented in chapter three. It explores the externalities associated with each technology, advantages and disadvantages, and compares the costs of electricity production between them.
The sixth chapter focuses on the success story of the phase out of coal in the electricity sector of the United Kingdom. It explores the effects of the policies implemented and their chronology with the purpose of drawing some conclusions for possible coal phase out pathways to be implemented in other countries.
The seventh chapter provides an overview of the electricity sector of China and a review of the latest policies implemented by the Chinese government related to this sector.
Challenges and Opportunities of Transition to Sustainable Electricity Generation
3
The last chapter makes a deep dive on the future of electric power generation, the challenges it faces, and possible pathways for a sustainable electricity sector exploring new and different technologies that promise to be clean, reliable, and affordable.
Challenges and Opportunities of Transition to Sustainable Electricity Generation
5
2. Overview of the global and Asia-Pacific electricity mix
The electricity sector is a large consumer of energy because a lot of energy is required in its transformation processes. As such, this sector has great economic, social, and environmental impacts across the globe. Moreover, as of 2018, 64.2 % of the electric power generated still came from fossil fuels and only 25.1 % from renewable sources (BP, 2019). The extensive use of fossil fuels in this sector generated roughly 13 Gt of carbon dioxide (CO2)
which represents 38 % of total CO2 emissions from energy related activities (IEA, 2019).
Therefore, this sector alone is responsible for the biggest share of CO2 emissions in the world,
making it a big contributor to global warming.
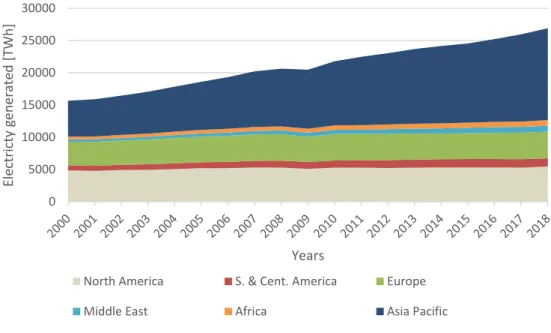
A continuous population growth, fast economic and social development and a growing urbanization in developing countries are responsible for most of the increase in electricity demand worldwide. Figure 2.1 and Table 2.1 show the discrepancy of growing electricity demand in different areas of the globe. The Asia Pacific region saw the biggest increase on electricity demand driven mainly by countries such as China and India that together account for 36 % of the world’s population (World Population Prospects, 2019). Furthermore, electricity consumption per capita in this region as of 2017 was only 2983 kWh which compares to a consumption rate of 6266 kWh in a developed region such as Europe (Asia Pacific Energy Portal, 2020). Moreover, electricity consumption in the Asia Pacific region is dominated by the industry sector, that has grown at a fast pace for the last twenty years, whereas the residential and commercial and public services represent a less significant portion of the electricity consumption. In developed regions such as Europe this consumption is more balanced with these three sectors having a relatively similar portion of the electricity demand. This is also a result of some industry activities being dislocated to countries with lower labour costs, a lot of those located in the Asia Pacific (IEA, 2020b).
6
Figure 2.1 - Electricity generated by region (BP, 2019)
Table 2.1 - Electricity generated by region and growing trends (BP, 2019)
Region Electricity Generation 2000 [TWh] Electricity Generation 2018 [TWh] Absolute Growth [TWh] Relative Growth Average growth per annum North America 4860 5447 588 12.1% 0.7% S. & Cent. America 808 1305 498 61.6% 2.7%
Europe 3646 4116 470 12.9% 0.7%
Middle East 351 930 578 164.6% 5.6%
Africa 440 854 414 94.0% 3.8%
Asia Pacific 5568 14265 8697 156.2% 5.4%
World 15548 26615 11066 71.2% 3.0%
The continuous rise of electricity consumption in developing countries demands more electric power generation capacity to be installed. On the other hand, developed countries have seen their electricity demand remain relatively flat throughout the last twenty years making it easier to reform their electricity generation fleet with a substantial share of modern renewable technologies. Developing countries struggle to reform their existing installed capacity as most of the new capacity is used to meet the growing electricity consumption. In Figure2 is shown the power generation capacity installed worldwide and the evolution of new installed capacity each year. 0 5000 10000 15000 20000 25000 30000 Ele ctricty generat ed [ TWh ] Years
North America S. & Cent. America Europe Middle East Africa Asia Pacific
Challenges and Opportunities of Transition to Sustainable Electricity Generation
7
Figure 2.2 - Installed capacity of electricity generation technologies worldwide (EIA, 2018)
To better understand the relation between installed capacity and electricity generation there is an important metric to consider that is the capacity factor. This factor compares the electricity generated to its potential.
𝑪𝒂𝒑𝒂𝒄𝒊𝒕𝒚 𝑭𝒂𝒄𝒕𝒐𝒓 = 𝑬𝒍𝒆𝒄𝒕𝒓𝒊𝒄𝒊𝒕𝒚 𝒈𝒆𝒏𝒆𝒓𝒂𝒕𝒆𝒅
𝑨𝒗𝒂𝒊𝒍𝒂𝒃𝒊𝒍𝒊𝒕𝒚×𝑰𝒏𝒔𝒕𝒂𝒍𝒍𝒆𝒅 𝒄𝒂𝒑𝒂𝒄𝒊𝒕𝒚 (2.1)
This factor varies a lot between different technologies. In fact, renewables usually have a much lower capacity factor than fossil fuel powered power plants, as they rely on intermittent energy sources, such as wind and solar radiation, there will be frequent periods of time when the electricity generation will be zero. Fossil fuel powered power plants however depend on the fuel supplied, so as long as there is fuel available and the components are ready to operate, the power plant is capable of generating electricity. This situation, however, is not always true, thermal power plants require large amounts of water to cool its components, as well as to carry away its rejected heat, and sometimes, especially during extremely hot summers, the temperature of the water is too high requiring the power plant to be shut down. Thus, for renewables with a lower capacity factor, to achieve the same electricity output as fossil fuel powered power plants, more installed capacity is required. This subject will be discussed further in the next chapter (IRENA, 2020).
The concept behind electrical power generation is similar either if it is from renewable or fossil fuel sources (exception of photovoltaic cells and some other less representative technologies). The baseline is via a working fluid that flows through a thermal engine or a hydraulic turbine, coupled to an electrical generator, convert thermal or potential energy into mechanical energy and subsequently in electrical energy. This part of the process remains the same, the main difference between different technologies is how to use a working fluid that makes the thermal engine or turbine operate for as many hours and as fast as possible in order to achieve a higher output. Here is where renewables and fossil fuel powered power plants part ways.
Challenges and Opportunities of Transition to Sustainable Electricity Generation
9
3. Power generation technologies and sustainability
3.1 Fossil fuels
Fossil fuels are hydrocarbons that can be found under the earth’s crust, formed along millions of years from the decomposition of plant and animal matter. They are especially attractive in sectors that use heat in its processes, such as in industry and thermal electric power generation, because their combustion is exothermic. In fact, the main products of any hydrocarbon combustion are carbon dioxide, water, energy as well as other pollutants.
Generating electric power from these fossil fuels differs from most renewables because a combustion process is used to extract the energy contained in the resource. Unlike biomass, that can too be used to generate electricity via a combustion process, fossil fuels cannot be replaced at the same rate that they are consumed. In this combustion process, energy is transferred to the working fluid, increasing its temperature and pressure, and this will then pass through a turbine, where the energy contained in the fluid is converted into work, making a shaft rotate. This shaft is coupled to the generator where this mechanical energy is converted in electricity. This workflow describes the processes used in a typical large power plant, however, there are other solutions that also use fossil fuels and are mainly used in off-grid applications. These use internal combustion engines such as Diesel or Otto engines where the energy contained in the working fluid, composed by the products of the combustion, is converted to mechanical energy by moving pistons instead of turbine blades (Breeze, 2015a; Belyakov, 2019a).
Independently of the technology used, the second law of thermodynamics limits the efficiency that can be obtained, idealized in the Carnot cycle. This cycle is used to understand the maximum theoretical efficiency that could be obtained by a certain heat cycle if no irreversibility’s were presented (such as friction and turbulence). This efficiency 𝜼𝒄 is independent from the type of working fluid and depends only on the ratio between the temperature of the heat source 𝑻𝒉 and the heat sink 𝑻𝒄 that will be considered, respectively, the inlet and outlet temperatures of the turbine in Kelvin (K), as used in the international system of units (SI).
𝜼𝒄 = 𝟏 − 𝑻𝒄
10
The outlet temperature is rarely lower than the ambient temperature, therefore, to increase efficiency, the inlet temperature should be as high as possible, and the outlet temperature should be as close to the ambient temperature as possible. This cycle represents the theoretical maximum efficiency that could be obtained using these temperatures, although, due to irreversibility’s present in any cycle, the real efficiency is always lower. Consequently, the closer the real efficiency is to this theoretical value, the less margin is left for technological advances.
This concept is important to understand why some technologies have higher efficiencies than others, as well as to access if they can be further improved or if they have reached or are close to reach a technical limit. Furthermore, it makes clear what is and has been the focus of technological developments in fossil fuel powered power plants, that is, achieving ever higher temperatures of the working fluid in the inlet of the turbine and lower as possible in the outlet. The next subchapters will focus on an overview of the most extensively used fossil fuels in electric power generation, namely its general characteristics and economic evolution, as well as analysing in more detail how different power plants work and their main components.
3.1.1 Coal
Coal is characterized by its dark colour and is composed mostly of carbon and other elements such as hydrogen, sulphur, oxygen and nitrogen as well as some moisture content. This resource has been a main driver of industrialization since the 19th century, however,
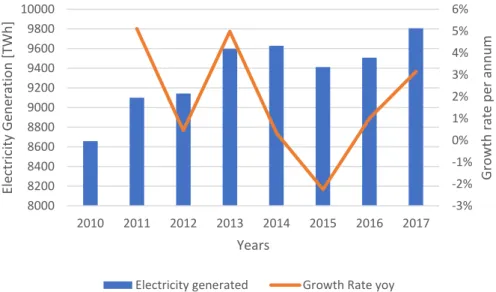
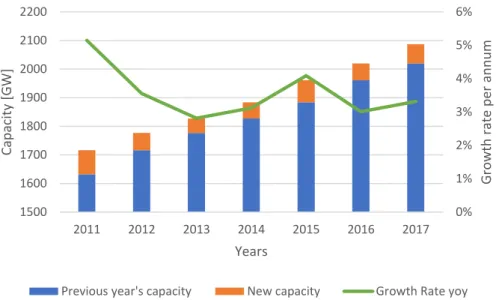
environmental concerns that arose mainly in the second half of the 20th century have put this fuel on the spotlight. This concern started a global discussion on the urgency to phase out coal, although, globally it still is the second most used fossil fuel losing only to oil. Moreover, this fuel is extensively used in the electricity sector, representing the largest share of electricity generation worldwide. In Figure 3.1 and 3.2 are, respectively, the evolution of electricity generated and installed capacity of coal-powered power plants.
Figure 3.1 - Electricity generated from coal worldwide (EIA, 2019) -3% -2% -1% 0% 1% 2% 3% 4% 5% 6% 8000 8200 8400 8600 8800 9000 9200 9400 9600 9800 10000 2010 2011 2012 2013 2014 2015 2016 2017 G ro w th ra te p er an n u m Ele ctricity Ge n era tio n [ TWh ] Years
Challenges and Opportunities of Transition to Sustainable Electricity Generation
11
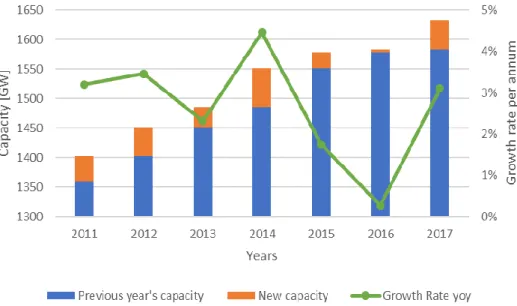
Figure 3.2 - Installed capacity of coal powered power plants worldwide (EIA, 2019)
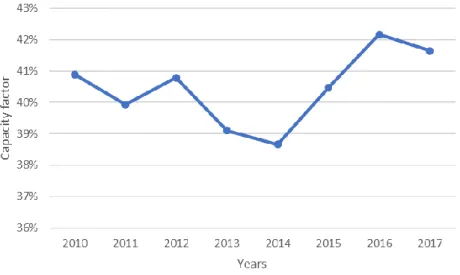
With the values presented in the figures above it is possible to obtain the capacity factor of coal-fired power plants as seen in Figure 3.3.
Figure 3.3 - Capacity factor of coal fired power plants worldwide (EIA, 2019)
This fuel is mined and can be found in different shapes depending on the time and conditions of formation. In Table 3.1 are the different types of coal and their characteristics.
0% 1% 2% 3% 4% 5% 6% 1500 1600 1700 1800 1900 2000 2100 2200 2011 2012 2013 2014 2015 2016 2017 G row th rate p er a n n u m Cap acity [G W] Years
Previous year's capacity New capacity Growth Rate yoy
50% 52% 54% 56% 58% 60% 62% 2010 2011 2012 2013 2014 2015 2016 2017 Cap acity fact o r Years
12
Table 3.1 - Types of Coal (EIA, 2019)
Both lignite and sub-bituminous are lower grade coal that contain more water and ashes, are soft, have a brownish colour, a low heating value and therefore achieve lower temperatures when burned. The harder the coal is, the more difficult it is to mine as it means the mineral was subjected to higher pressures and temperatures that only occur deep under the earth’s crust. Therefore, anthracite is more costly to mine than lignite and all the others. The most used by a significant margin is bituminous coal. All types of coal are used in electrical power generation however it is not common to use anthracite due to its high cost of mining, low reserves (roughly 1 % of total coal reserves) and attractiveness to other ends such as residential use (Breeze, 2015b).
Coal fired electrical power generation represented 38 % of electricity production worldwide as of 2018 (IEA, 2020a). This extensive use is mainly due to the wide availability and low cost, however, the latter is already being challenged by lower prices of renewables and natural gas. Moreover, the technology used in coal fired power plants is mature and successive upgrades have led to higher efficiencies.
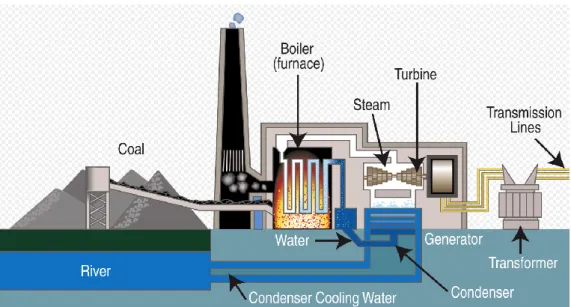
Coal-fired power plants
Coal-fired power plants, although highly complex, have three core components, these are the boiler, where coal is burned and steam is produced, the steam turbine, where energy from the steam is converted into work, and the generator, where mechanical energy is converted in electricity. In Figure 3.4 are the main components of a typical coal fired power plant.
Figure 3.4 - Layout of a typical coal fired power plant (Tenesse Valley Authority)
Formation Years Carbon Content Moisture Hardness Heat value Reserves
Lignite + + ++++ + + ++
Sub-bituminous ++ ++ +++ ++ ++ +++
Bituminous +++ +++ ++ +++ +++ ++++
Challenges and Opportunities of Transition to Sustainable Electricity Generation
13
Independently of the technologies used in any coal-fired power plant, the working fluid is the same, water. This water is heated until it becomes steam and the characteristics of that steam are used to classify different power plants as shown in Table 3.2.
Table 2.2 - Classification of coal-fired power plants using water properties (Breeze, 2015)
Temperature [K] Pressure [MPa] Sub-critical < 647.14 < 22.12
Supercritical 647.14 - 883 22.12 - 31
Ultra-supercritical 883 - 993 31 - 36
This classification uses the critical point of water to distinguish the sub-critical technology from the supercritical. In fact, the boiling temperature of water varies with pressure. At ambient pressure, water has a boiling temperature of 100 ºC, and liquid and gaseous water coexists while boiling. However, when water is heated under pressures above the ambient pressure, the boiling temperature increases as well. Moreover, when pressure and temperature rise, the properties of saturated water and saturated steam start to converge and when the critical point of 22.12 MPa and 647.14 K is reached, these begin to have the same properties and therefore can no longer be distinguished between them. Water with thermodynamic properties above this point is called supercritical steam (Breeze, 2015b). The interest in using supercritical or ultra-supercritical steam lies in the possibility of achieving higher efficiencies by using higher temperatures of the working fluid, as explained in the last subchapter.
Boiler/steam generator
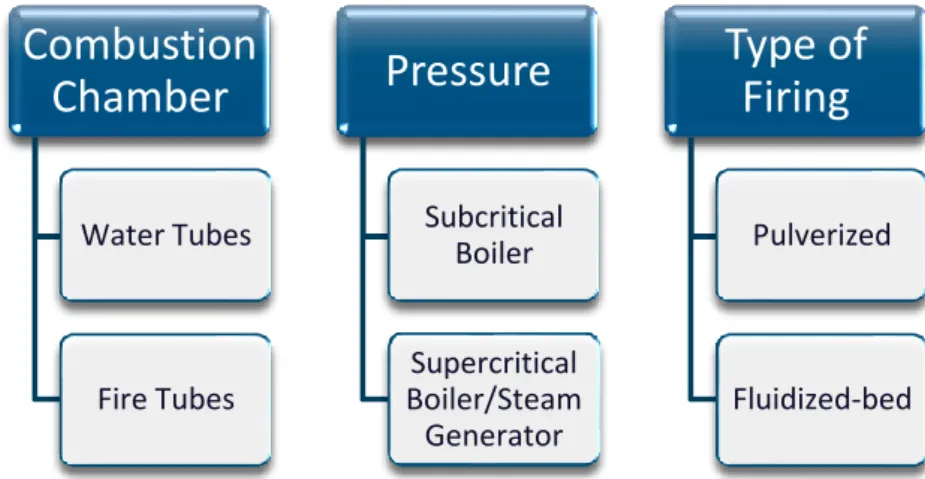
This component is where the first process takes place, that is where fuel is burned producing hot combustion gases that will be used to heat the water. These can be looked at as a heat exchanger with a combustion chamber. There are different types of boilers, and these can be categorized according to certain characteristics. Some of those characteristics are presented in Figure 3.5.
Figure 3.5 - Characteristics of different types of boilers
Combustion
Chamber
Water Tubes Fire TubesPressure
Subcritical Boiler Supercritical Boiler/Steam GeneratorType of
Firing
Pulverized Fluidized-bed14
In coal-fired power plants the combustion chamber is usually of the water tube type because this is better suited to endure higher pressures and operating capacities. In this type of boiler water circulates in tubes whereas the combustion takes place in the furnace and hot gases circulate inside the shell of the boiler as illustrated in Figure 3.6.
Figure 3.6 - Water tube boiler
These boilers use pre-treated coal, normally crushed until it becomes a fine powder. This powder is highly flammable and burns evenly, hence its attractiveness in this process. There are, however, different solutions of firing. Two of the most vastly used firing options are as follows:
• Pulverized coal
Coal is grinded until a flour like aspect and mixed with hot air to extract its moisture content. Only after this process takes place, the mixed stream of fine coal particles and hot air is fed to the furnace to be combusted. Once inside the furnace, the mixture receives another stream of air, just enough to guarantee a complete combustion. The air-fuel ratio is greater than the stoichiometric requirements, making it a lean fuel mixture.
This type of boiler is designed for coal within certain requirements of heating value, ash content among other characteristics and therefore is not a flexible solution (Breeze, 2015b; Pang, 2016)
• Fluidized bed
This process consists of a controlled combustion of solid particles in a bed made of sand and other materials. Pre-treated coal is fed to this bed of particles and air is forced through it allowing for a controlled combustion. This method of firing can burn coal with different heating values, and moisture and ash contents. Due to the presence of substances such as limestone in the fluidized bed, SO2 from the combustion is extracted in this process. NOx
Challenges and Opportunities of Transition to Sustainable Electricity Generation
15
emissions are also lower than in other solutions because of the lower combustion temperatures used in this process. When fuel flexibility is a priority and the coal used is of low quality this solution is attractive, however, additional costs must be taken into account as the circulation of air through the fluidized bed is energy consuming (Breeze, 2015b; Pang, 2016).
Once the coal is burned it produces a hot stream of flue gases that will circulate around the tubes containing water. Heat is transferred through these tubes to produce steam. However, depending on the type of boiler this heat transfer can happen in different ways:
• Subcritical boiler
This type of boilers, as explained before, operates with water under the critical point. Water circulates in tubes that are heated by the hot flue gases until achieving saturated water. This saturated water then goes to the steam drum where steam is separated from the liquid phase. Steam then flows out of the drum either directly to the turbine or to a reheat process in order to get superheated before going to the turbine. The water in the steam drum is then recirculated making another passage in the tubes to receive more heat and returns to the steam drum producing more steam. This is how a conventional boiler operates and these boilers are installed in most of the 20th century coal fired power plants (Breeze, 2019).
• Supercritical boiler/steam generator
This boiler does not have a steam drum, as the water characteristics are above the critical point there is no distinction between phases, which erases the need for this component. This type of boiler, also called steam generator, has a high number of small tubes passing through its shell to increase the heat transfer rate. Water is fed to each tube in the liquid phase and at the outlet, supercritical water is delivered. In order to support the pressures and temperatures involved in the process these tubes are made of special alloys. Steam generators produce steam at higher temperatures, which leads to the possibility of achieving higher power generation efficiency. On the other hand, the special materials required lead to a higher cost than the typical boiler (Breeze, 2019).
Steam turbine
This component converts the energy contained in the steam in mechanical work through its blades. In some coal fuelled power plants there are different turbines especially designed to work with steam at different pressures. This way a higher amount of energy can be extracted from the fluid thus achieving a higher efficiency.
16
Figure 3.7 - The blades of a steam turbine
The properties of the steam generated, presented in Table 3.3, are used to classify coal fired power plants. The most common, however slightly outdated, are subcritical plants that achieve efficiencies of around 38 % at full load (Breeze, 2019). Supercritical plants (SC) were the technology upgrade that followed, achieving efficiencies of 41 % at full load (Breeze, 2019). Further innovations led to the ultra-supercritical (USC) power plants which further increased the thermodynamic properties of the steam achieving a maximum efficiency of 47 % at full load (Breeze, 2019). Although USC technology has been around for a few decades, it only started to be commercially implemented more widely for the last years as the technology is now more mature and economically viable. At the forefront of this implementation are Asia and Europe. Research and some initial projects are underway to develop advanced ultra-supercritical (A-USC) plants that will operate with temperatures above 700 ºC aiming to achieve efficiencies as high as 55 % (Breeze, 2019).
3.1.2 Natural gas
Natural gas is a colourless, odourless, gaseous low-carbon fossil fuel, characterized by its high calorific value. This fuel is composed mainly by methane (96 %) and other hydrocarbons (Faramawy et al., 2016). This fossil fuel is formed in a scale of millions of years by decomposition of organic matter subjected to high amounts of pressure and heat that exist under the earth’s crust.
This fuel was first recognized as an energy source several centuries ago in China, where the first known gas well was built. In the Western civilization this resource was first discovered in Great Britain followed by other countries such as Germany and the US, and it started to be commercialized throughout the 19th century (Speight, 2019). However, it was not until the first half of the 20th century that natural gas began to be used in electricity generation, being used in
combustion boilers like the ones used in coal-fired power plants. Natural gas fired power plants saw their great breakthrough in the beginning of the Second World War with the development of the gas turbine. This component was developed as an aero engine and reached higher
Challenges and Opportunities of Transition to Sustainable Electricity Generation
17
efficiencies than conventional steam boilers. During the second half of the 20th century, this
new technology matured and started to be implemented in large-scale electricity generation. In the 21st century this technology is competing and in some cases displacing coal-fired power plants due to its higher efficiency and less significant environmental impacts (Breeze, 2016).
Figure 3.8 shows the electricity generation in the world using this fuel, Figure 3.9 the evolution of its installed capacity and Figure 3.10 its capacity factor evolution.
Figure 3.8 - Electricity generation by natural gas fired power plants (EIA, 2019)
18
Figure 3.10 - Capacity factor of natural gas fired power plants
The capacity factor of these power plants is lower than coal fired power plants and different reasons can explain such disparity. Among them is the flexibility of natural gas power plants, these have a fast ramp rate which makes them ideal to be used more frequently on scenarios of peak demand and fuel costs. Although, these power plants are perfectly suitable to operate as baseload as well. On the other hand, coal-fired power plants are usually used as baseload power plants because they do not function at low loads, have slower ramp rates and the cost of coal is usually low and stable (Breeze, 2019)
Natural gas power plants
There are different technologies that use natural gas to produce electricity. The simplest one uses the same concept of coal-fired power plants, heat is used to raise steam in a boiler, the only difference is the fuel used in the combustion chamber is natural gas. This type of plant is not commonly used alone, due to its low efficiency when compared to other technologies that were developed throughout the second half of the 20th century.
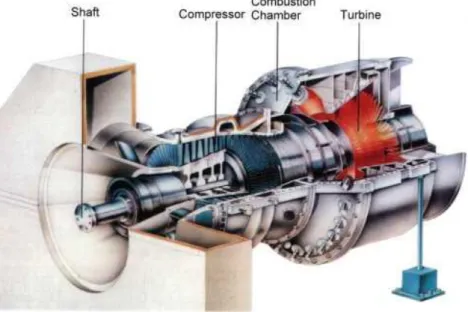
The technology that paved the way to natural gas use in electricity generation was the development of gas turbines, idealized in the Joule-Brayton cycle. Sharing the same concept of jet engines, these turbines use the exhaust gas from the combustion as the working fluid. In fact, the process can be divided in three main stages, in the first one, air flows through a compressor increasing its pressure, after this stage natural gas is injected in the combustion chamber where it is burned with the compressed air producing high heat exhaust gases that will flow through the turbine making the shaft rotate. Figure 3.11 shows the different components of a gas turbine.
Challenges and Opportunities of Transition to Sustainable Electricity Generation
19
Figure 3.11 - Layout of a gas turbine
As said before, gas turbines are especially attractive to meet peak electricity demand due to its rapid start and stop capabilities. Furthermore, this solution is a lot more compact than steam generators, making it much easier to transport and install. However, one of the main disadvantages of this technology is the low thermal efficiency. In fact, the exhaust gases in the outlet of the turbine usually contain a considerable amount of energy, with temperatures in the range of 400 – 500 ºC. Power plants operating only with gas turbines are referred to as open cycle and for inlet temperatures above 1300 ºC efficiencies around 40 % can be achieved at full load (Breeze, 2016).
The thermal waste incurred when using gas turbines promoted the exploration of alternatives to capture the energy contained in the fluid at the outlet of the turbine. The solution implemented was the combined cycle gas turbine (CCGT), where the energy contained in the working fluid at the outlet of the gas turbine is used to create superheated steam in a heat recovery steam generator (HRSG). This steam then flows through a steam turbine that is connected to another generator, producing more electricity (Breeze, 2019). In Figure 3.12 is the typical diagram of a CCGT power plant.
20
After flowing through the turbine, the steam is cooled in a condenser and then pumped back to the HRSG to be reused. Nowadays the most advanced CCGT power plants work with inlet temperatures between 1400 and 1600 ºC, with the ones using the upper limit value slightly surpassing 60 % efficiency at full load. Research is being carried to upgrade this value to 65 % using an inlet temperature of 1700 ºC (Breeze, 2016). The limitation on the inlet temperature is posed by the materials used in the blades of the gas turbine. These are made of special alloys and coatings and must be cooled to endure such extreme conditions.
Overall natural gas fired power plants are characterized by its flexibility. In fact, these have fast ramp rates and can be quickly adjusted to different loads if electricity demand varies. Moreover, CCGT power plants have high efficiencies over a wide range of loads, which also makes them suitable for baseload operation while minimizing emissions as less fuel needs to be burned to achieve a certain output.
3.2 Renewable Energy
Renewable electricity is produced using resources that can be replenished within a human’s lifetime. This type of electricity is characterized by the lower impact in the environment when compared to fossil fuel originated electricity as well as by the abundance of the resources used. The main types of renewable energy are wind, solar, geothermal, biomass and hydro. Although most use a working fluid in its natural state, taking advantage of earth’s characteristics (gravity, meteorology, internal activity) and producing no emissions while operating, others such as biomass use a combustion process and therefore produce CO2. This
resource, made of organic matter from animals or plants, unlike other renewable sources it is not considered a clean fuel per se, as it emits greenhouse gases (GHG). However, using the example of wood as a biomass source, this is considered a renewable fuel as the CO2 emitted
to the atmosphere when burned was CO2 previously absorbed by a tree during its lifetime.
Therefore, CO2 is only returning to where it was stored before being absorbed, resulting in net
zero emissions. Despite this, the combustion of biomass produces other atmospheric pollutants therefore it cannot be considered a clean fuel. The case with fossil fuels is different because new amounts of CO2 are being added to the atmosphere.
The following sub-chapters will explore the concepts behind the fastest growing technologies used to generate electricity from renewable sources. In particular, hydro, wind and solar photovoltaic.
3.2.1 Hydropower
This source of energy is one of the oldest known to humans. In fact, evidence shows that thousands of years ago water was already used to turn wheels that would grind wheat and flour (Breeze, 2018a). This technology, as with most renewables, indirectly depends from solar energy. Solar radiation is used in evaporation processes that will result in large amounts of water vapor to accumulate in the atmosphere. This vapor will eventually be precipitated in the form of rain, completing what is widely known as the water cycle (Belyakov, 2019b). Hydropower in electricity generation started to be vastly implemented in the beginning of the 20th century and since then it became the most mature and widely used renewable energy source. In Figure 3.13 is the evolution of electricity generation from hydropower since 2007, Figure 3.14 the installed capacity evolution and Figure 3.15 its capacity factor.
Challenges and Opportunities of Transition to Sustainable Electricity Generation
21
Figure 3.13 - Electricity generated using hydropower worldwide (BP, 2019)
Figure 3.14 - Installed capacity of hydro generation worldwide (IRENA, 2018)
Figure 3.15 - Capacity factor of hydro generation worldwide
-1% 0% 1% 2% 3% 4% 5% 6% 7% 2500 2700 2900 3100 3300 3500 3700 3900 4100 4300 2007 2008 2009 2010 2011 2012 2013 2014 2015 2016 2017 G ro w th ra te p er an n u m Ele ctricity Ge n era tio n [ TWh ] Years
Electricity generated Growth Rate yoy
41% 41% 42% 42% 43% 43% 44% 44% 45% 45% 2007 2008 2009 2010 2011 2012 2013 2014 2015 2016 2017 Cap acity fact o r Years
22
Hydroelectric power plant
There are different solutions to capture hydric energy to generate electric power, however, all of them extract the energy contained in the water due to the difference in its elevation. To capture this energy, depending on the characteristics of the site and the river, several concepts can be adopted. One of the most common is to build a barrier, a dam, that will block the flow of the river creating a water reservoir in the upper side. Water from this reservoir will be used at will via a duct that leads to the turbine and is then delivered back to the river. In Figure 3.16 is a scheme of this solution. As said before, this technology extracts the potential energy contained in the water, therefore more electricity is produced if larger volumes of water with higher elevations between the top of the reservoir and the inlet of the turbine are used. The power capacity using hydropower technology is ruled by the following equation.
𝑷 = 𝝆 × 𝑸 × 𝒈 × 𝑯 (3.2)
Where the output capacity, P, depends on two intrinsic variables, the water density 𝝆 that varies little, and the gravitational acceleration constant 𝒈. The other two variables are determined by characteristics of the river, the dam’s location and size will determine the height of the water drop H and the operator will control, in part, the volumetric water flow rate through the turbine Q (Breeze, 2018b). Again, the blades of the turbine will extract the energy contained in the water and convert it in mechanical energy making the shaft, connected to a generator, rotate. This generator will then convert this energy in electricity.
Figure 3.16 - Layout of a typical large hydroelectric power plant (EIA, 2019)
Reservoir hydroelectric power plants achieve a relatively constant power output as the water reservoir enables to operate with a relatively constant water flow, do not produce any gases, however, the resources used depend on precipitation and have to be carefully managed
Challenges and Opportunities of Transition to Sustainable Electricity Generation
23
to allow other activities that depend on this resource to satisfy their needs. On the other hand, this solution is capital intensive and drastically influences the habitat where is located, sometimes requiring the displacement of indigenous population.
Other popular solution is the pumped storage hydroelectric power plant. This technology is equipped with hydro turbines that can work as pumps. This way, when electricity demand is low, water is pumped to the upper reservoir to be reused when electricity demand is higher. This technology serves the same purpose as a battery and is of great use in integrating renewables in the electric grid (Belyakov, 2019b).
Lastly, the run-of-river concept is used in small hydroelectric power plants. This solution consists of a small barrier, although it does not block the flow of the river as is the case with the reservoir dam, instead it diverts a portion of the river stream to a powerhouse after which it returns to the river. This technology can be implemented in rivers with relatively low water flows and its impacts on the habitat are considerably lower than the other solutions (Killingtveit, 2014).
3.2.2 Wind energy
Wind is a form of solar energy. The solar radiation unevenly heats the atmosphere, that together with the rotation of the earth creates wind flows. However, wind varies greatly in intensity and direction with time and location (US Department of Energy, n.d.).
The technology to extract energy contained in the wind using turbines was developed in the middle of the 20th century and started to be vastly implemented in the beginning of the 21st century, with Europe in the frontline. Soon after, other countries saw success in this
technology and started to implement it as well. Therefore, since the beginning of the current century, electricity generated and installed capacity started to grow at a considerable pace as seen in Figures 3.17 and 3.18, respectively. Also, in Figure 3.19 it can be seen the low capacity factor of this technology when compared to the ones abovementioned, mainly due to its intermittence associated with the unpredictability of wind flows. The values presented are total values considering onshore and offshore wind turbines.
24
Figure 3.18 - Installed capacity of wind turbines worldwide (EIA, 2019)
Figure 3.19 - Capacity factor of wind turbines worldwide
The growing capacity factor can be attributed to a diverse set of reasons, among those is a better assessment of locations to install wind turbines, another is simply from more windy years. In fact, wind availability is not constant, as such, there will always exist years with more availability and others with less. However, there are several wind previsions models that try to minimize the uncertainty of this resource using historical data from various sources (Deign, 2018).
Wind energy converter
The machine used to extract the energy contained in the wind is made of several components. The most visible is the wind turbine, composed by long blades that are driven by the air flow, this is the component that captures the wind energy and converts it in mechanical energy by driving a shaft at low speeds. This low speed shaft is connected to a gearbox that will
Challenges and Opportunities of Transition to Sustainable Electricity Generation
25
multiply the rotation speed converting it in a high-speed rotation shaft that is connected to the generator. Figure 3.20 is a representation of the wind turbine and the components responsible for the energy conversion inside the nacelle.
Figure 3.20 - Representation of a typical wind converter
The wind turbine and the nacelle are supported by a tower and inside the nacelle, there are motors responsible for rotating the group nacelle plus wind turbine in order to align the latter with the direction of the wind flow. This maximizes the extraction of the energy contained in the wind.
The power output of a wind turbine P is defined by the following variables:
𝑷 = 𝑪𝒑 ×𝟏
𝟐× 𝝆 × 𝑽∞ 𝟑 × 𝑨
𝑹 (3.3)
Where Cp is a coefficient that represents the ability to extract energy from the wind and is a characteristic of the installed wind turbine, it is therefore, a measure of efficiency. 𝝆 is the density of the air. 𝑽∞ is the speed of the air flow in the swept area of the blades. This variable is cubed and therefore has a big impact on the power output of the wind turbine. Lastly is the swept area 𝑨𝑹, that depends on the length of the blades used in the wind turbine. Wind turbines, to achieve higher power outputs, need a higher tower and longer blades to maximize both 𝑽∞ and 𝑨𝑹. One of the biggest wind turbines in the world has a nominal capacity of 12 MW, a rotor with 220 meters of diameter and a tower with a height of 260 meters (Ganguly, 2018; General Electric, 2019).
26
To understand the intermittence of electricity generation associated with wind turbines it is necessary to further explore the influence of air speed. In Figure 3.21 there is a chart with the typical relation between air speed and power output in a wind turbine.
Figure 3.21 - Relation between air speed and power output of a typical wind turbine (Dvorak, 2017)
It is visible from Figure 3.21 that the optimum wind speed is between 14 and 25 m/s, more than this leads to possible structural problems or even an overheating of the generator, therefore the emergency system is activated, stopping the wind turbine. Less than 3.5 m/s will not be able to rotate the blades, and between this speed and the optimum value the power output increases almost linearly with an increase in the wind speed. This way, for a wind turbine to achieve a capacity factor of 100%, the wind would need to always flow at a speed within the optimum values when the wind turbine is operating (Beig and Muyeen, 2016).
3.2.3 Solar photovoltaic
Photovoltaic technology converts solar energy directly into electricity. It was developed in the middle of the 20th century but only started to be used in a larger scale in the beginning of
the 21st century as it became more developed and economically viable. This technology depends on solar radiation, which is a plentiful and democratic resource, the sun shines in every single corner of the world. Furthermore, it is largely available in areas of the globe dominated by developing countries, which creates an opportunity for poorer economies to build up their energy security and capacity. Electricity generated using this technology has experienced a rapid growth as seen in Figure 3.22. Figure 3.23 shows the installed capacity of PV panels and Figure 3.24 the evolution of its capacity factor.
Challenges and Opportunities of Transition to Sustainable Electricity Generation
27
Figure 3.22 - Electricity generated from solar PV panels worldwide (BP, 2019)
Figure 3.23 - Installed capacity of solar PV panels (EIA, 2019)
This technology is indeed experiencing a fast growth, the fastest among every electric power generation technology (IEA, 2020b). However, as observed in Figure 3.24, the capacity factor of PV systems is also the lowest of all technologies. PV panels do not generate electricity during the night and even when the sun is up the amount of electricity produced can vary significantly. The low capacity factor implies that to generate the same amount of electricity with photovoltaic panels when compared to other technologies, there is a need to have a considerable higher installed capacity of PV panels.
28
Figure 3.24 - Capacity factor of PV solar panels
This technology differs from all the others as it does not use a turbine nor a generator. This can be looked at as an advantage in that fewer moving parts usually mean less maintenance is required. Instead, photovoltaic cells are made of semiconductors such as silicon that absorb the energy contained in the photons of the incident solar radiation. The received photons, when containing enough energy, excite electrons that are expelled creating an imbalance and thus an electric field. The output is a direct current (DC), and as across most households the electricity consumed is alternate current (AC), an inverter is used to make this transformation (EIA, 2020).
Figure 3.25 - PV solar panel composed of several PV cells
The power output of a PV module depends on the incident radiation and the temperature of the PV cells. To better understand the relation between these variables and the power output it is important to remember the following relation,
𝑷 = 𝑽 × 𝑰 (3.4)
The power output P depends on the voltage V and the current I, therefore, to achieve a maximum power output it is important to maximize the product of these variables. An analysis on the influence of incident radiation and cell temperature in both these variables is very
Challenges and Opportunities of Transition to Sustainable Electricity Generation
29
important to better understand how the power output of a PV module varies. In Figure 3.26 is the I-V curve and the corresponding power curve for a typical PV module at standard conditions of 1000 W/m2 of incident radiation and a cell temperature of 25 ºC.
Figure 3.26 - Power curve of a typical PV module (Duffie and Beckman, 2013)
As observed, the maximum power point corresponds to a compromise between current and voltage. For the same PV module with the same incident radiation, the I-V curve changes with the temperature of the PV cell, as observed in Figure 3.27. In fact, although current remains similar, the open circuit voltage (maximum voltage) decreases with higher cell temperatures, and vice versa.
Figure 3.27 - Effect of PV cell temperature in I and V (Duffie and Beckman, 2013)
On the other hand, current is highly affected by incident radiation, as observed in Figure 3.28, with a similar PV module and a cell temperature of 25 ºC.
30
Figure 3.28 - Effect of incident radiation in I and V (Duffie and Beckman, 2013)
To achieve the highest power output possible, the most favourable conditions are a high incident radiation in cold environments. Warm climates will see a lower output and consequently less efficient PV modules due to the higher temperatures of the cells leading to lower voltages. When analysing a location to install PV solar panels both these variables need to be extensively analysed. Incident radiation varies greatly with location, meteorological conditions, and time. It will be higher with a clear sky and radiation perpendicular to the panel and will be null in the night-time. Cell temperature depends on the ambient temperature and the amount of incident radiation converted to heat in the PV panel (Duffie and Beckman, 2013; Solar Electric Power Company, 2018).
Challenges and Opportunities of Transition to Sustainable Electricity Generation
31
4. Environmental aspects of power generation
4.1 Global warming
Electric power generation using fossil fuels generates gases that have negative impacts on the environment. These can present themselves in different ways, either directly or indirectly, in the present or in the future, but in any case, consequences are real and severe.
Global warming is one of the main indirect impacts of burning fossil fuels. The increase of GHGs present in the atmosphere, responsible for trapping and absorbing solar radiation and then converting it into heat, contributes to higher temperatures being registered all around the globe. The main GHGs, produced mainly by human activity, are carbon dioxide (CO2) and
methane (CH4), with others such as nitrous oxide (N2O) and fluorinated gases (F-gases)
representing a smaller, although not negligible, share of these gases in the atmosphere. Furthermore, one of the most important GHG is water vapour, this gas is essential to keep the earth at a temperature suited to human life. This gas is responsible for most of the greenhouse effect however, as it is considered a good and natural type of greenhouse gas it is not considered as GHG emissions. This is ruled by the water cycle so if the global temperature rises as a consequence of others GHGs emissions, more water will evaporate producing more water vapour thus creating a positive feedback that will accelerate the rise of global temperatures (IPCC, 2014).
Since pre-industrial times the world has already warmed by about 1 ºC due to the high level of human activity, derived substantially from energy related activities associated with burning fossil fuels (Allen et al., 2018). In 2015 the Paris agreement was outlined and agreed upon by 197 countries. The signed document clearly states in article 2 the goal to keep the global average temperature below 2 ºC and an effort to push this limit to 1.5 ºC relative to pre-industrial levels (United Nations, 2015). Failing to meet such targets poses a threat to the current way of life. Heavy rainfalls, wildfires, melting ice sheets and glaciers and an increased sea level rise are some of the consequences from the increase of the global average temperature. Also, global warming is an inequality amplifier, affecting poor populations in a more intense and direct way.
The warming effect of greenhouse gases varies with their capacity to absorb energy and their lifetime in the atmosphere, as such, in order to compare global warming impacts of different GHGs the global warming potential (GWP) was developed. This method compares the warming potential of different GHGs in relation to CO2 over a certain period, in particular,
how much energy one ton of a certain gas will absorb compared to 1 ton of CO2. This metric is
widely used to assess the global warming effect and the 100 years’ timeframe was adopted by the United Nations Framework Convention on Climate Change (UNFCCC) and its Kyoto Protocol. In Table 4.1 are the GWP values of some of the main GHGs both in a 20 (GWP20)
32
Table 4.1 - GWP and atmospheric lifetime of most common greenhouse gases (IPCC, 2014)
Gas Formula Atmospheric lifetime (years) GWP 20 Years GWP 100 Years Carbon Dioxide CO2 1 1 Methane CH4 12.4 84 28 Nitrous Oxide N2O 121 264 265 Perfluoromethane CF4 50000 4880 6630
In fact, GHGs with a shorter lifetime will have a higher GWP if a shorter timeframe is considered. An example of this situation is the GWP20 and GWP100 of methane. This gas has a
short lifetime in the atmosphere therefore its effects on global warming are more intensively felt in the short-term. In contrast CO2 is believed to remain in the atmosphere from centuries to
thousands of years resulting in a GWP equal for all timeframes. Other gases such as N2O and
most F-gases absorb more energy when compared to both CO2 and CH4 and their atmospheric
lifetime varies considerably from gas to gas. Although CO2 is the GHG that absorbs the least
amount of energy per unit of gas, it is responsible for the majority of the GHGs emissions as it is produced in great amounts. As of 2010, CO2 represented 72 % of all GHGs emissions using
a GWP100, with 62 % related to fossil fuels and industrial processes and 10 % to forestry and
other land use (FOLU). Methane represented 20 % of all GHGs and the remaining share is attributed to N2O and F-Gases, all using a GWP100 (IPCC, 2014).
Most of the GHGs emitted in the electricity sector are CO2 and CH4. CO2 is produced
when burning fuels that contain carbon and the amount of emissions depends on the carbon content of the fuel as well as on the efficiency of the power plant. On the other hand, CH4 is
not produced through a combustion process, instead it is unwillingly emitted along the supply chain of the different fossil fuels (Kholod et al., 2020; Alvarez et al., 2018).
The power sector has a key role to play in climate mitigation. This sector is one of the energy related areas with viable, mature, and cost competitive solutions to decarbonize the energy sector. Furthermore, other energy related activities such as transportation are following the trend of electrification paving the way for a faster decarbonization of a sector that is currently dominated by the carbon intensive fossil fuel that is oil.
4.2 Air pollution
One of the more directly felt impacts of burning fossil fuels to produce electricity is the air pollution caused by some gases produced in the combustion process. Among those it is important to highlight the negative impacts of the SO2, NOx and PM. The first is released when
fuels containing considerable amounts of sulphur in its composition are burned and is responsible for acid rains that can contaminate aquatic systems and forests. NOx is produced at
high temperature combustions and also contributes to acid rains. Nitrogen dioxide (NO2) is a
type of nitrogen oxide responsible for health complications, namely several pulmonary diseases. Particulate matter (PM) is a mixture of extremely small particles made of different components that usually fall under two different categories. PM10, that have diameters between