Some facts about business cycles synchronisation across the euro area countries: the case of small countries
Sofia Gouveia and Leonida Correia
Centre for Transdisciplinary Development Studies (CETRAD), Department of Economics, Sociology and Management (DESG), University of Trás-os-Montes and Alto Douro (UTAD), 5000-660 Vila Real, Portugal.
Abstract: According to Optimum Currency Area literature, the synchronisation of business cycles is necessary
for the successful implementation of a common monetary policy. This paper contributes to this debate, providing a descriptive analysis of the euro area business cycle synchronisation, using quarterly real GDP series, spanning from 1980:1 to 2004:4, for nine euro area countries. We consider the four largest countries (Germany, France, Italy and Spain), which account for almost 80% of the euro area GDP, and five among the smallest countries, Belgium, Finland, Greece, the Netherlands and Portugal. Our aim is to see whether the synchronisation and the amplitude of the business cycles across the Member States increased with the monetary integration process. We will give greater focus to small countries compared to what can be seen in existent literature. Overall, we found that the business cycles association for all nine countries considered from 1980 to 2004 is positive and significant. Moreover, evidence suggests that with the creation of the euro, business cycles became more correlated among the larger countries of the euro area, which is consistent with the hypothesis of endogeneity of the Optimum Currency Area criteria. Contrarily, the group of small countries is very heterogeneous and still presents different degrees of synchronisation with the euro area business cycle. Also, after 1997, the degree of synchronisation with the euro area business cycle has been reduced. This result indicates that the monetary policy of the European Central Bank, in place since 1999, has not been adjusted for some of the small countries of the euro area. The divergence of the Portuguese business cycle experienced in the recent past is of major concern.
JEL Classification: E32, F15
Keywords: Business cycle synchronisation, Economic and Monetary Union, European Integration
1. Introduction
The globalisation process and the increasing worldwide economic integration witnessed these past few years are widely believed to have led to more interdependence among the major nations of the World, and, will likely lead to further synchronisation of national cycles. In particular, the creation of the European Monetary Union (EMU) and the introduction of the euro, on 1st January 1999, put the synchronisation of business cycles among the euro area countries at the centre of the current debate on the EMU, given that it constitutes a key factor for the successful implementation of a common monetary policy.
According to the Optimum Currency Area (OCA) theory, a high degree of synchronisation among the business cycles of the Member-States of a monetary union is a necessary condition for good functioning, as the common monetary policy, which is defined taking into account the aggregate statistics of the monetary union, will be suited to all countries. In the European case, it is worth asking whether or not there is a positive correlation between economic integration and the increase of the synchronisation of the business cycles because, in spite of the deepening of the economic and monetary integration among the euro area countries throughout the last decades, we still do not know about their effects in the business cycles synchronisation.
In other words, have we seen a growing association among the business cycles of the euro area countries, which would lead on to the validation of the endogeneity OCA hypothesis suggested by Frankel and Rose (1998), and should we have reasons to be
optimistic about the success of the monetary policy in the euro area or, on the contrary, is there wide heterogeneity among the business cycles of the countries of the euro area, which could put the future of the EMU at risk?
The issue is particularly relevant in the case of the small countries of the EMU, because if a small country experiences a recession or an expansion, and its business cycle presents low synchronisation with the euro area business cycle, as the short-term interest rates are not tailored to that country’s business cycle, then the common monetary policy will not work as an instrument of stabilisation for that economy.
In recent years, several studies has been presented which, directly or indirectly, seek to study business cycles synchronisation among the euro area countries with mixed results, in keeping with sample period, the methods used and the countries included. Therefore, the question remains unanswered in the literature, as, thus far, there has been no systematic or satisfactory analysis of the synchronisation of the business cycles in the euro area. With this paper, we hope to provide a contribution in that sense, extending the existing analyses on business cycles synchronisation in the euro area across a number of dimensions. Firstly, we have used quarterly real GDP time series (and not industrial production indices which merely represent a part of the business cycle of the country) for the period prior to the EMU as well as for the EMU period itself. Secondly, we have used several measures of synchronisation including correlation coefficients, concordance indices, rolling and maximum correlations, and standard deviations. Thirdly, we have paid closer attention to the small economies of the euro area than is usually present.
Fundamentally, the main objective of this paper is to analyse the dynamics of the business cycles synchronisation among the euro area countries, so as to ascertain whether the endogeneity hypothesis formulated within the context of the OCA theory stands up. The emphasis placed on small countries has the specific aim of answering the question: "Does the common monetary policy serve the interests of the small countries?".
This paper is structured as follows: section 2 briefly outlines the literature related to the theme under study; section 3 describes the data and the methods used in the empirical analysis; the results are presented in section 4; and in section 5 the main conclusions are presented.
2. Related literature: main conclusions
Much of the debate over the desirability of a monetary union and its possible effects on the participating countries is centred on the OCA theory, formulated by Mundell (1961) and later enriched by the contributions of McKinnon (1963) and Kenen (1969), among others. The OCA theory holds that two countries are able to form a monetary union if the economic benefits derived from the savings of transactional costs (which are higher the greater the degree of economic freedom proffered by the partners of the monetary union) are superior to the economic costs which come about due to the loss of independence in handling monetary
and exchange policies. The economic costs of a monetary union increase with: (a) the intensity and the frequency with which the countries are affected by asymmetrical shocks; (b) the reduced flexibility of prices and wages; (c) the low mobility of production factors; (d) the high degree of specialisation of the countries’ production structure; and (e) the non existence of fiscal federalism.
With regard to the possible consequences of economic and monetary integration in the national business cycles of the member countries of a monetary union, two schools of thought exist: one with positive implications for the future of the monetary unions; the other with negative implications. The first argument appears in the well-known report One Market, One
Money, published in 1990, in which the European Commission evaluates ex-ante the impact
of the single currency on the euro area countries. The prognosis is that broadening the European integration process will reduce the probability of asymmetrical shocks occurring, due to the increment of intra-industrial trade, to greater similarity among the productive structures of the EMU countries, and also to greater coordination of the national economic policies.
The second argument, with roots in International Trade Theory and in the New Economic Geography Theory, had its origin in a warning given by Krugman (1993) to the Member States of the EMU cautioning them to learn from the "lessons of Massachusetts". According to this assessment, the regions of the USA have dimensions comparable to but more specialised than the countries of the EMU, probably due to the greater proximity brought about by a single market in the USA. Therefore, in the EMU, growing specialisation of its Member States is expected as obstacles to international trade are lessened and stock markets become more integrated. If this is so, trade among countries of the euro area will be mainly of the inter-industrial type. Consequently, the industry-specific shocks will be more and more identifiable with national shocks, and therefore, problems in macroeconomic management of the euro area will arise because the monetary policy of the European Central Bank (ECB) is shaped by common shocks in the euro area and not by shocks that hit any single country.
After the publication of the Delors Report in 1989, which proposed the three phases that would lead to the founding of the EMU and which would later be included in the Maastricht Treaty, several empirical studies came about with the aim of assessing whether the European Union (EU) satisfied the conditions to be considered an OCA, and/or which group of countries should move ahead to the EMU. Most authors centred their attention on the analysis of the asymmetrical shocks that hit the countries of the EU, following two distinct methods. The first method had its origin in the pioneer article by Bayoumi and Eichengreen (1993), where the use of a SVAR as well as of the identification proposed by Blanchard and Quah (1989) allowed for an analysis of the symmetry of aggregate demand and of aggregate supply shocks among the countries of the EU. The authors' main conclusion was with regard to the
appearance of two distinct groups of countries within the EU: a group made up of the core countries (Germany, Austria, Belgium, Denmark, France, Luxembourg and Holland), which presented high correlations of their shocks with Germany’s – taken as the reference country – and the peripheral group made up of the countries of the EU that exhibited low correlations with Germany.1
The second method, initiated by Artis and Zhang (1997), attempted to isolate the cyclical component from the trend component and to measure the synchronisation of the business cycles among the European countries, creating literature that has thrived in recent years. This literature has brought up several methodological questions, of which two have special relevance: how to identify and how to measure the synchronisation of the business cycles. Although several methods (parametric and non-parametric) have been put forward to extract the cyclical component of the series, there is still no consensus with regard to the best form of identification or estimation of the trend component. On the other hand, some authors reject the idea of trend-cycle decomposition and prefer to define the business cycle in terms of turning points based on the series of original data.
As for a way of measuring the synchronisation of the business cycles, several alternative approaches have been proposed, which include the calculation of correlation coefficients and concordance indices, common factors analysis of the business cycle of each country and spectral analyses of the series, among others. The lack of consensus with regard to the methodology and the divergence of the results are illustrated in Appendix 1, in which we have summarised the main studies published on this matter.
Artis and Zhang (1997) find, since 1979, increased integration for the member countries of the Exchange Rate Mechanism (ERM) of the European Monetary System (EMS). By contrast, Inklaar and De Haan (2001), using the same data, but enlarging the temporary period and dividing it into 4 sub-periods noted that for the period from 1971 to 1979 the cycles of the euro area countries are more correlated with the German business cycle than in the period 1979-87. Moreover, Massmann and Mitchell (2004), using Artis and Zhang’s data (duly updated) and calculating eight alternative measures of the business cycle, concluded that the euro area, over the last 40 years, has been characterised by periods of cyclical convergence, associated with an increase in the average correlation and a decrease of the variance, and for periods of cyclical divergence. The results for the most recent period show that the correlation among the business cycles of the 12 Member States of the EMU is statistically positive and that it has been rising since the nineties, thereby suggesting that the euro area has entered a period of cyclical convergence after a period of divergence which occurred at the beginning of the nineties, at the time of German reunification and the EMS crises.
1
Subsequent studies have analysed the other criteria suggested by the OCA theory and overall have confirmed the existence of a centre and a periphery among the European countries. For a good review of those studies see, for example, Artis (2003) and Mongelli (2002).
A characteristic common to most empirical studies on the OCA is that they are based on data from the period prior to the EMU, so as to use the results obtained to draw implications for the functioning of the EMU. Indeed, much of the current debate on the possible effects of the EMU on the asymmetry of the business cycles is centred precisely on the validity of the inferences made using historical data as a springboard, which might not reflect the alteration of the political preferences or the change of political regime inherent in monetary unification (a criticism made by Lucas). In fact, the process of adopting a single currency assumes a structural alteration, which influences the behaviour of the economic agents and the political and economic institutions of the Member States involved in that monetary union and it may catalyse progress in several areas in which the viability of a monetary union is contemplated.
Over the past few years, there has been growing interest in the study of the endogenous effects of monetary integration particularly so as to identify the different endogeneities that influence the dynamics of the EMU headed towards an OCA.2 This is a new area of research (stemming from a paper by Frankel and Rose, 1998) and the euro a recent reality. With regard to discussion of endofeneities of OCA, there first appeared the development of a conceptual framework, followed by an attempt at a systematic exploration of sources of endogeneity. At the same time, empirical studies, based on two different levels of analyses stand out: some used a sample of several countries of the world and others based on data of the EMU’s short period of life.3
3. Data and Methods
In our analysis, we used quarterly observations of the GDP at constant prices, seasonally adjusted, of nine countries of the EMU, namely; Germany (DEU), Belgium (BEL), Spain (ESP), Finland (FIN), France (FRA), Greece (GRC), the Netherlands (NLD), Italy (ITA) and Portugal (PRT), and of the euro area aggregate.4 The euro area aggregate includes the eleven countries that made up the EMU on 1st January 1999, and Greece, which joined the Euro Club in 2001.5 Full details of all data, including sample periods and sources, are provided in Appendix 2.
2
See de Grauwe and Mongelli (2005) for a good revision on literature concerning endogeneities of OCA.
3
Frankel and Rose (1998), Rose (2000), Gruben et al. (2002), Imbs (2004), Kalemi-Ozcan et al. (2003), Fidrmuc (2005) and Inklaar et al. (2005) are examples of studies that look at some of the channels through which economic and monetary integration can influence the synchronisation of the business cycles among countries. Mico et al. (2003) investigate the effects of the channels on the synchronisation of the business cycles of the EMU countries with data relevant to the euro area.
4
Austria, Ireland and Luxembourg were excluded from the analysis due to limitations on data availability: the time series with quarterly data covered quite a short period.
5
Slovenia was not included in the analysis because of its very recent participation in the process of economic and monetary integration: it joined the EU on 1st May 2004, and adopted the euro on 1st January 2007.
To identify the business cycle we used the definition proposed by Lucas (1977), as the deviations of the aggregate real output from trend.6
In this sense, the identification of the "deviation cycle" consists in isolating the cyclical component from the trend component. However, as the business cycle is not an observable variable, several methods have been developed to extract the cyclical components of the macroeconomic series.7 From among the several available filters, we have centred our study on one of the statistical techniques which comes up frequently in literature regarding business cycles: the band-pass filter proposed by Baxter and King (1999).8
The Baxter-King (BK) filter eliminates a trend component with very slow movement as well as the high frequency components; in other words, only the fluctuations that are inside a band of specific frequency are kept and considered as corresponding to the business cycles. Baxter and King suggested that the duration of the business cycle would lie between 1.5 and 8 years; the inferior band would be of 6 quarters and the superior band of 32 quarters, that is, the filter removes the variations of low frequency trend and it softens the irregular high frequency variations, and the main characteristics of the business cycles are kept. As the ideal filter imposes a moving average of infinite order, in practice a close estimate is used.
On the other hand, the analysis of the synchronisation of the business cycles in the euro area was based on the calculation of two measures. Firstly, we calculated the correlation coefficients, which describe the degree of linear association between pairs of business cycles. For each country under study, we analysed the contemporary correlation coefficients as well as the maximum correlation coefficients. Following Pérez et al. (2007), in the definition of the number of lag quarters for which the maximum correlation is obtained, we considered a window of a maximum of five quarters of leads and lags and from among those eleven correlations we chose the highest figure. In other words, we defined corr(xt,yt-i) as the
correlation between the business cycle of country x and the business cycle of country y, in the lag i (-5≤ i ≤ 5), and two countries will be cyclically synchronised if the maximum correlation is contemporaneously obtained. A positive figure for i means that country x has a lag in i quarters with respect to the cycle of country y, and a negative figure for i means that country x has a lead of i quarters with respect to country y.
Secondly, we determined the concordance indices, which measure the proportion of time in which two series are in the same cyclical phase. The concordance indices are based on
6
In empirical literature on business cycles, we found two different concepts, though related, of the business cycle. The first is generally designated as "classical business cycle" and has been used by the National Bureau of Economic Research (NBER) and refers to the absolute increase or decrease in economic activity. The second, commonly designated as "growth cycle" or "deviation cycle", is defined as being the deviations from trend and has become the main reference in academic literature since Lucas (1977). In this paper, we have followed the approach typically used in business cycles literature therefore we have centred our analysis on the "deviation cycle".
7
Canova (2007) offers a good review of the empirical methods used to decompose the series into cyclical and trend components.
8
In order to examine the robustness of the findings, we also considered the Hodrick Prescott (1997) filter, with λ = 1600, which is the conventional value for quarterly data. However, we obtained qualitatively similar results. These results for the Hodrick-Prescott (HP) filter are available from the authors on request.
binary series (0-1) for each country, in which the unit represents the expansion periods (above the trend) and the zero represents periods below the trend. Considering that Sx,t is one when the business cycle in country x is positive and zero when the cycle is negative, and defining Sy,t in the same way, the index of concordance (IC), between the business cycle of country x and the business cycle of country y is given as:
{
1( ,. , ) (1 , ).(1 , )}
1 t y t x t y T t xt xy T S S S S IC = −∑
= + − − ,in which T represents the dimension of the sample.
Initially, Harding and Pagan (2002) advanced the indices of concordance, and since then, they have been increasingly used in literature as a complement of the correlation coefficient. The main advantage of the concordance indices in relation to the correlation coefficient consists in being able to use it in order to detect linear and non-linear relationships between business cycles. The concordance indices lie between 0 and 1, indicating 1 for maximum concordance. It is worthwhile pointing out that on average the existence of a positive relationship between the cyclical position of two countries implies a degree of concordance greater than 0.5, which is the expected number for the IC when there are two independent and identically distributed series (McDermot and Scott, 2000).
With the aim of examining the evolution of the degree of business cycles synchronisation throughout the period 1981:1 to 2004:4, we used two procedures: (1) we calculated the two measures previously referred to for rolling periods, using a window of 32 observations, corresponding to the maximum duration of the business cycle in the BK filter, which was used to obtain the cyclical component of the GDP, and (2) we calculated the correlation/concordance for sub-periods of eight years, with breaks at two important moments in the history of the European economic and monetary integration9. The first sub-period (the period of EMS) runs from 1981:1 to 1988:4, marked by great stability in the functioning of the EMS and includes the passing of the Single European Act on 1st July 1987, which, besides stipulating that by the end of 1992 a Common Market should have been attained, it also explicitly defined the creation of a EMU. The second sub-period (period of the Delors Report) goes from 1989:1 to 1996:4, and covers the implementation of several proposals made in the Delors Report needed for the creation of the Monetary Union. Finally, the third sub-period (the period of the single currency) begins in January 1997 and ends in December 2004. Although the EMU got under way on 1st January 1999, the final date for the implementation was agreed only after consensus was reached with the Stability and Growth Pact in June 1997.
9
Overall, the studies, which analyse the synchronisation of the business cycles for sub-periods, distinguish the period prior to the EMS from the period of the EMS itself, as do, for instance, Artis and Zhang (1997, 1999). Moreover, some research still subdivides the EMS period: some in seemingly arbitrary ways (see, for instance, Inklaar and Haan, 2001) and others defining the breaks based on institutional and historical reasoning (see, among others, Pérez et al. 2007).
Finally, to check whether or not the business cycles in the EMU countries are of similar amplitude we calculated two dispersion measures: (1) the mean absolute deviation from trend and (2) the standard deviations of the business cycles.
4. Results
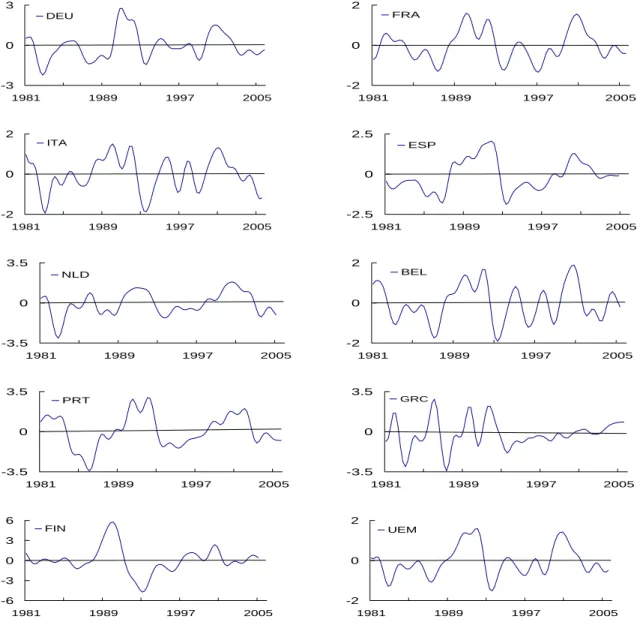
Figure 1 presents the business cycles of the countries of the euro area using the BK filter. This figure shows that, with the exception of Finland in the nineties, all of the countries present business cycles that move within a band of ±3,5%. It is also noteworthy that all of the business cycles are in an expansionary phase towards the end of the eighties and at the beginning of the nineties, which is followed by a recessive period. Finland is the country that presents the largest drop, with a deviation in relation to the tendency of -4.7% in 1993:1.
-3 0 3 1981 1989 1997 2005 DEU -2 0 2 1981 1989 1997 2005 FRA -2 0 2 1981 1989 1997 2005 ITA -2.5 0 2.5 1981 1989 1997 2005 ESP -3.5 0 3.5 1981 1989 1997 2005 NLD -2 0 2 1981 1989 1997 2005 BEL -3.5 0 3.5 1981 1989 1997 2005 PRT -3.5 0 3.5 1981 1989 1997 2005 GRC -6 -3 0 3 6 1981 1989 1997 2005 FIN -2 0 2 1981 1989 1997 2005 UEM
Table 1 shows over the whole sample period the contemporaneous and maximum correlation coefficients, together with the corresponding lead time for the euro area and the contemporaneous concordance indices for each national business cycle with the aggregate euro area cycle.
Table 1 – Measures of synchronisation with respect to the euro area, 1981-2004
DEU FRA ITA ESP av. l. NLD BEL PRT GRC FIN av. s.
Cont. correlation 0.87 0.8 0.84 0.79 0.83 0.84 0.83 0.59 0.53 0.36 0.62 Max. correlation 0.87 0.8 0.84 0.83 0.84 0.84 0.84 0.61 0.54 0.68 0.69
Lead/lag 0 0 0 -1 0 -1 1 1 -4
Cont. concordance 0.83 0.82 0.84 0.81 0.83 0.82 0.85 0.79 0.65 0.59 0.74
Note: av. l. = average 4 largest countries; av. s. = average small countries
All correlation coefficients are positive and statistically significant. The most interesting feature is the high degree of contemporaneous correlation in the majority of the countries, particularly in Germany, the Netherlands, Italy, Belgium, France and Spain. On the other hand, Portugal and Greece display modest levels of association while Finland has the lowest association with the euro area business cycle. Contemporaneous concordance indices provide similar indications. Moreover, in Germany, France, Italy and the Netherlands the contemporaneous correlation coefficient coincides with the maximum correlation, suggesting that business cycles in these countries are in phase with the euro area cycle. In the other countries, the cycles are out of phase with the euro area cycle: Spain and Belgium lead the euro area by one quarter, Finland leads the euro area by four quarters and the euro area cycle leads the Portuguese and Greece cycles by one quarter.
We have also calculated the correlation and concordance statistics using Germany as the benchmark economy and the results (see Table A1, Appendix 3) are similar to the ones obtained previously. However, the association between Germany and the euro area countries business cycles is slightly lower. The highest degree of synchronisation with the German cycle is observed for the Netherlands and the lowest is observed for Finland.10
With regard to the amplitude of the cycles, the two measures considered (the mean absolute deviation from trend and the standard deviation of the cycles) give similar results as can be seen in Table 2. Here, we can see notable differences in the individual country’s cycles amplitudes. The standard deviation of the cycle in the countries with the most volatility (Finland and Portugal) is about two times bigger than the standard deviation in the country with the lowest volatility (France).
10
The weak synchronisation between German and Finnish cycles could be explained by the breakdown of the Communist regimes in Europe: Germany’s unification boom peaked when Finland’s cycle had already gone bust, in other words, the Germany and Finnish economies were affected asymmetrically by the same external shock.
Table 2 – Measures of dispersion, 1981-2004
DEU FRA ITA ESP av. l. NLD BEL PRT GRC FIN av. s.
% 0.81 0.61 0.66 0.79 0.72 0.83 0.77 1.22 0.86 1.32 1 MAD rank 5 1 2 4 6 3 8 7 9 % 1.04 0.75 0.82 0.97 0.9 1.03 0.92 1.46 1.2 1.97 1.32 St. dev. rank 5 1 2 4 6 3 8 7 9
Note: MAD = Mean absolute deviation in business cycles; St. dev. = Standard deviations of the cycles; av. l. = average 4 largest countries; av. s. = average small countries
To summarize, considering the whole period, the euro area countries are in general highly synchronised with the euro area business cycle. However, some idiosyncratic developments can be detected especially in three small countries: Finland, Greece and Portugal. On the other hand, for small countries the differences in cycles amplitudes are very large, while the largest countries tend to have similar and smaller cyclical amplitudes among themselves.
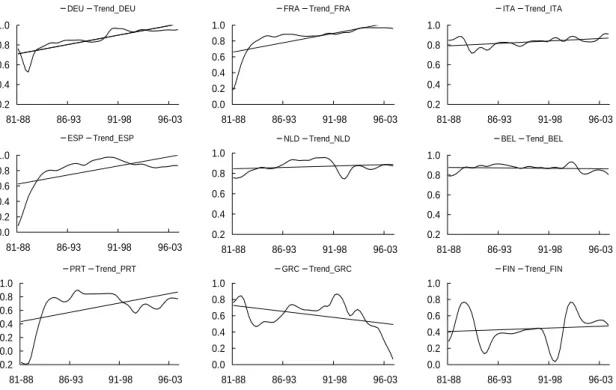
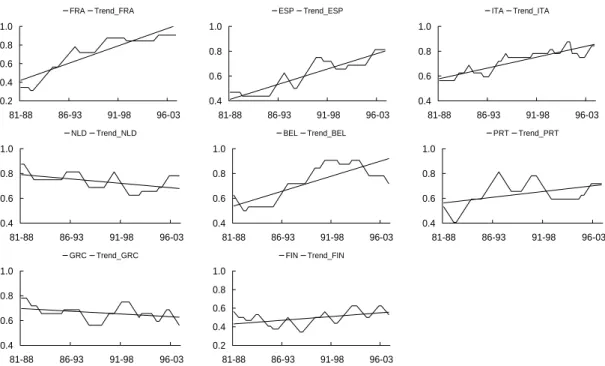
The period from 1981 to 2004 was characterized by several important macroeconomic changes that could have affected the degree of association among euro area cycles, so it is particularly relevant to analyse the synchronisation in a dynamic perspective. Figure 2 shows the rolling contemporary correlations between the business cycles of the countries included in our sample and the euro area as well as the correlations linear trend. For convenience purposes, in the rolling correlation analysis we take the average year of each period (for example, 1984 corresponds to period 1981-1988 and 2000 to period 1997-2004).
0.2 0.4 0.6 0.8 1.0 81-88 86-93 91-98 96-03 DEU Trend_DEU 0.0 0.2 0.4 0.6 0.8 1.0 81-88 86-93 91-98 96-03 FRA Trend_FRA 0.2 0.4 0.6 0.8 1.0 81-88 86-93 91-98 96-03 ITA Trend_ITA 0.0 0.2 0.4 0.6 0.8 1.0 81-88 86-93 91-98 96-03 ESP Trend_ESP 0.2 0.4 0.6 0.8 1.0 81-88 86-93 91-98 96-03 NLD Trend_NLD 0.2 0.4 0.6 0.8 1.0 81-88 86-93 91-98 96-03 BEL Tend_BEL -0.2 0.0 0.2 0.4 0.6 0.8 1.0 81-88 86-93 91-98 96-03 PRT Trend_PRT 0.0 0.2 0.4 0.6 0.8 1.0 81-88 86-93 91-98 96-03 GRC Trend_GRC 0.0 0.2 0.4 0.6 0.8 1.0 81-88 86-93 91-98 96-03 FIN Trend_FIN
From the analysis of this figure, we can extract the following:
Between 1984 and 1989, in France and Spain the correlations increase remarkably, afterwards they continue to increase until 1993, but at a more moderate pace (in 1984 Spain has a 0.09 correlation which reaches 0.97 in 1993), subsequently there is a slight decrease in the case of France and a more notable and lasting decrease in the case of Spain, before starting a new upward trend;
Germany, Italy, the Netherlands and Belgium show little variation with a pattern of high correlations over time, but a general upward trend is evident (clearer in the case of Germany);
Greece has correlations above 0.75 in 1984, then declines to nearly 0.5 around 1987, it starts an upward trend that continues until 1995, when it begins a downward trend reaching a null value in 2000;
The pattern of correlations in Finland contrasts with that of other countries, as it presents correlations close to 0.75 in the middle of the 80s and 90s and correlations below 0.4 in the period 1988-1995;
In Portugal the correlations with the euro area increased remarkably after joining the EU in 1986 (from -0.19 in 1984 to approximately, 0.75 in 1987). However, from 1993 onwards, there is a reduction in the correlations to about 0.5, with an exception in the period of 1997 and 1999 where there are slightly higher correlations but with lower values to the ones in period 1987-1993.
0.4 0.6 0.8 1.0 81-88 86-93 91-98 96-03 DEU Trend_DEU 0.4 0.6 0.8 1.0 81-88 86-93 91-98 96-03 FRA Trend_FRA 0.4 0.6 0.8 1.0 81-88 86-93 91-98 96-03 ITA Trend_ITA 0.4 0.6 0.8 1.0 81-88 86-93 91-98 96-03 ESP Trend_ESP 0.4 0.6 0.8 1.0 81-88 86-93 91-98 96-03 NLD Trend_NLD 0.4 0.6 0.8 1.0 81-88 86-93 91-98 96-03 BEL Trend_BEL 0.4 0.6 0.8 1.0 81-88 86-93 91-98 96-03 PRT Trend_PRT 0.4 0.6 0.8 1.0 81-88 86-93 91-98 96-03 GRC Trend_GRC 0.4 0.6 0.8 1.0 81-88 86-93 91-98 96-03 FIN Tend_FIN
As illustrated in Figure 3, the rolling concordance indices show similar results to the rolling correlation coefficients except for three countries: in Spain the concordances are high throughout the period; in Finland they have a downward trend; and in Portugal they have a time-varying pattern, alternating between decreasing and increasing phases.
Further light on the evolution of the business cycle synchronisation is shed in Figures A1, A2 and A3 of Appendix 3, which show the corresponding contemporaneous correlation, contemporaneous concordances and maximum correlation values, but now expressed in relation to Germany. The patterns of synchronisation for the EMU countries with respect to Germany reinforce the above-mentioned observations in relation to the euro area.
The results presented so far support the hypothesis of alteration of business cycles synchronisation between the countries in the euro area over time. In general, the countries increased their synchronisation with the euro area cycle and with the German cycle. The analysis does not allow a distinction between the behaviour pattern of the largest countries and the one for small countries. However, we identify three small countries with a pattern which is different from the others. For Greece and Finland the results do not suggest the existence of cyclical convergence with the euro area. For Portugal, we observe a remarkable increase in the degree of synchronisation with the euro area cycle, mainly in the period after joining the EU, while in recent years this country witnessed a weaker degree of association with the euro area than that observed in the period between 1987 and 1995.
0.4 0.6 0.8 1.0 1.2 1.4 81-88 86-93 91-98 96-03
DEU Trend DEU
0.2 0.4 0.6 0.8 1.0 1.2 81-88 86-93 91-98 96-03 FRA Trend_FRA 0.2 0.4 0.6 0.8 1.0 1.2 81-88 86-93 91-98 96-03 ITA Trend_ITA 0.2 0.4 0.6 0.8 1.0 1.2 81-88 86-93 91-98 96-03 ESP Trend_ESP 0.2 0.4 0.6 0.8 1.0 1.2 81-88 86-93 91-98 96-03 NLD Trend_NLD 0.2 0.4 0.6 0.8 1.0 1.2 81-88 86-93 91-98 96-03 BEL Trend_BEL 0.2 0.6 1.0 1.4 1.8 81-88 86-93 91-98 96-03 PRT Trend_PRT 0.2 0.4 0.6 0.8 1.0 1.2 1.4 81-88 86-93 91-98 96-03 GRC Trend_GRC 0.4 0.8 1.2 1.6 2.0 2.4 2.8 81-88 86-93 91-98 96-03 FIN Trend_FIN
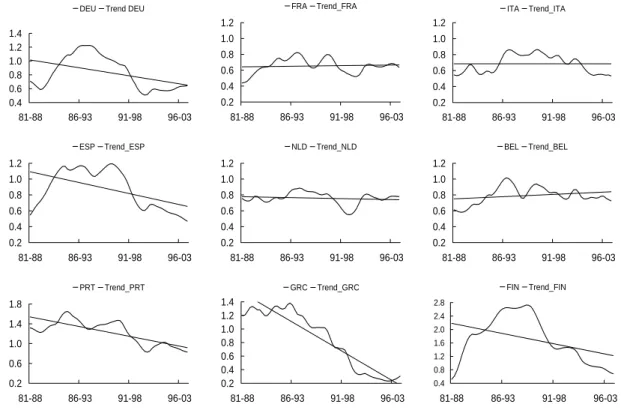
Figure 4 shows the amplitude of the business cycles of each euro area country, presenting the value of the mean absolute deviation for rolling periods of eight years. The amplitude of the cycles in the euro area countries exhibits a gradual tendency to decrease over the sample period. The most relevant aspect has been the gradual reduction in the high level of volatility in Greece and Portugal. In the case of Portugal, this movement is more moderate and occurs after an upward trend between 1985 and 1988. Finland stands out as the country with the highest cyclical amplitudes. In the beginning it has a low standard deviation, until 1992 when it registers significant increases and then a downward trend which leads to standard deviations identical to the ones in the beginning. Germany and Spain show an increase in the mean absolute deviation until the end of the 80s. However, in Germany, in 1990, and in Spain two years later, a descending trajectory begins. At the end of the period, in 2000, both reach a lower value than the one obtained in the beginning. The remaining countries of the sample - Belgium, the Netherlands, France and Italy - present a pattern of cycles amplitude largely unchanged in the last 25 years, with standard deviations with low values.
In short, the measures of dispersion seem to indicate that the amplitude of the business cycles has diminished over the period, although the pattern of evolution has varied notably among the different countries.
So far the analysis carried out for both the measures of synchronisation, and for the measures of dispersion, shows changes in the cyclical association among the EMU countries over time. In order to find clear general trends, we calculate the various measures of synchronisation and dispersion for sub-periods. Taking into consideration that there are various channels which may have influenced the business cycles synchronisation in the euro area and that each of them may have changed significantly over time, we divide the sample period into three sub-periods of eight years each, corresponding to the maximum duration of the business cycle according to BK: (a) 1981-1988; (b) 1989-1996; and (c) 1997-2004. We should emphasize that these three sub-periods represent successive stages in the process of European integration, namely the ERM period, the Report Delors period and the single currency period.
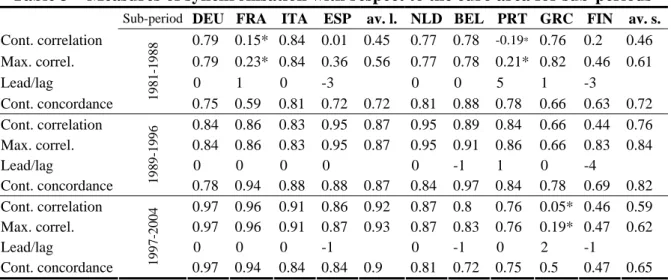
Table 3 presents the contemporaneous and maximum correlation coefficients, together with the corresponding lead time for the euro area as well as the contemporaneous concordance indices of each national business cycle with the aggregate euro area cycle, for different sub-samples. The evolution profile of synchronisation of each euro area country with the euro area observed in the sub-periods point to a possible distinction between the behaviour of the largest economies and the small ones. The average contemporaneous correlation coefficient for the largest economies increased remarkably from the first period to the second sub-period and increased moderately from the second to the third sub-period. Furthermore, in the second and in the third sub-periods the maximum correlations are coincident with the
contemporaneous correlations, with the exception of Spain which in the later period leads the euro area cycle by one quarter. The group of small countries, on average, notably increases their synchronisation with the euro area: the contemporaneous correlation coefficient rises from 0.46 in the period 1981-1988 (0.81 for maximum correlation) to 0.76 in the period 1989-1996 (0.84 for maximum correlation). However, in the later period the synchronisation of the cycles falls to around 0.59 (maximum correlation 0.62).
Table 3 – Measures of synchronisation with respect to the euro area for sub-periods Sub-period DEU FRA ITA ESP av. l. NLD BEL PRT GRC FIN av. s.
Cont. correlation 0.79 0.15* 0.84 0.01 0.45 0.77 0.78 -0.19* 0.76 0.2 0.46 Max. correl. 0.79 0.23* 0.84 0.36 0.56 0.77 0.78 0.21* 0.82 0.46 0.61 Lead/lag 0 1 0 -3 0 0 5 1 -3 Cont. concordance 1981-1988 0.75 0.59 0.81 0.72 0.72 0.81 0.88 0.78 0.66 0.63 0.72 Cont. correlation 0.84 0.86 0.83 0.95 0.87 0.95 0.89 0.84 0.66 0.44 0.76 Max. correl. 0.84 0.86 0.83 0.95 0.87 0.95 0.91 0.86 0.66 0.83 0.84 Lead/lag 0 0 0 0 0 -1 1 0 -4 Cont. concordance 1989-1996 0.78 0.94 0.88 0.88 0.87 0.84 0.97 0.84 0.78 0.69 0.82 Cont. correlation 0.97 0.96 0.91 0.86 0.92 0.87 0.8 0.76 0.05* 0.46 0.59 Max. correl. 0.97 0.96 0.91 0.87 0.93 0.87 0.83 0.76 0.19* 0.47 0.62 Lead/lag 0 0 0 -1 0 -1 0 2 -1 Cont. concordance 1997-2004 0.97 0.94 0.84 0.84 0.9 0.81 0.72 0.75 0.5 0.47 0.65
Note: av. l. = average 4 largest countries; av. s. = average small countries
(*) The correlation coefficient is not statistically significant with a level of significance of 10%
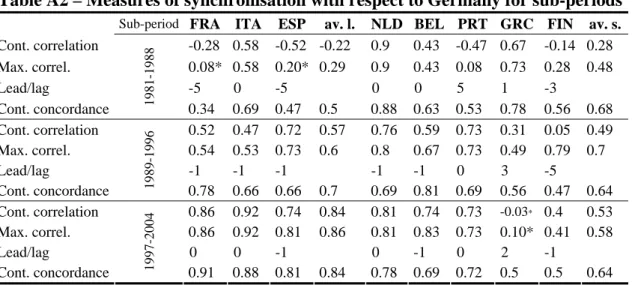
Table A2 of Appendix 3 shows the ascending pattern of the synchronisation of the cycles between the major economies over the three sub-periods as well as the downward trend of the small countries and the German cycle in the single currency sub-period. The conclusion for the small countries is reached through reading the coefficients of maximum correlation, as the contemporaneous correlations point to an increase in synchronisation throughout the three sub-periods under analysis. Cycles in the small countries became more synchronised with the German cycle over the three sub-periods, which denotes the importance of the calculation of the maximum correlations.
A more detailed analysis of the evolution of the degree of business cycles synchronisation for each of the small countries for sub-periods shows the great heterogeneity of this group. On the other hand, Greece distinguishes itself for being the country which exhibits the highest decrease in the correlation coefficient both with the euro area and with the German cycle, between the three sub-periods, particularly in the latter period. Finland highlights the great difference between the contemporaneous correlations and the maximum correlations. Portugal shows a time-varying pattern; it rises remarkably from the first to the second sub-period but falls in later sub-period. Belgium and the Netherlands present in the last sub-period a reduction of their correlation with the euro area cycle, but if we consider the correlation with the German cycle a general upward trend is evident over the three sub-periods.
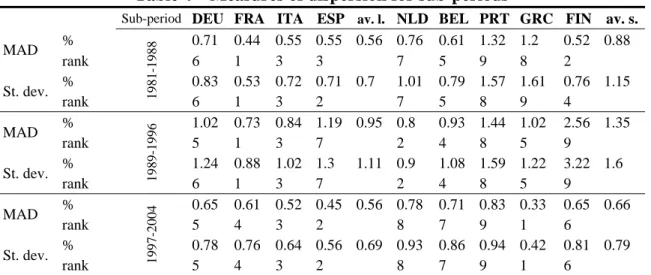
Table 4 – Measures of dispersion for sub-periods
Sub-period DEU FRA ITA ESP av. l. NLD BEL PRT GRC FIN av. s.
% 0.71 0.44 0.55 0.55 0.56 0.76 0.61 1.32 1.2 0.52 0.88 MAD rank 6 1 3 3 7 5 9 8 2 % 0.83 0.53 0.72 0.71 0.7 1.01 0.79 1.57 1.61 0.76 1.15 St. dev. rank 1981-1988 6 1 3 2 7 5 8 9 4 % 1.02 0.73 0.84 1.19 0.95 0.8 0.93 1.44 1.02 2.56 1.35 MAD rank 5 1 3 7 2 4 8 5 9 % 1.24 0.88 1.02 1.3 1.11 0.9 1.08 1.59 1.22 3.22 1.6 St. dev. rank 1989-1996 6 1 3 7 2 4 8 5 9 % 0.65 0.61 0.52 0.45 0.56 0.78 0.71 0.83 0.33 0.65 0.66 MAD rank 5 4 3 2 8 7 9 1 6 % 0.78 0.76 0.64 0.56 0.69 0.93 0.86 0.94 0.42 0.81 0.79 St. dev. rank 1997-2004 5 4 3 2 8 7 9 1 6
Note: MAD = Mean absolute deviation in business cycles; St. dev. = Standard deviations of the cycles; av. l. = average 4 largest countries; av. s. = average small countries
With regard to the cycles amplitudes (Table 4) it is not possible to distinguish a pattern of evolution for the small countries and another pattern for the largest countries. Overall, the trend is for the increase of the cycles amplitude, from the first period to the second period and a notable decrease from the second period to the most recent, except in the Greek case which exhibits a downward trend between the three sub-periods, reaching the lowest amplitude (0.33) in the period 1997-2004 among the nine countries analysed.
5. Discussion and conclusions
In this paper we calculate alternative measures of synchronisation and dispersion among euro area countries in order to characterize the degree of association among euro area business cycles and to detect if there is any endogeneity trend (if business cycles become more synchronised through time), in the period between 1981 and 2004. We place a particular emphasis on small countries, trying to find out if the common monetary policy, defined to the euro area as a whole, serves their interests. Additionally, we also question if the advent of the EMU has increased the degree of association of small countries cycles with the euro area cycle.
The results obtained suggest that over the period considered the degree of synchronisation of business cycles among Euro countries is positive and statistically significant. The majority of the countries have a higher degree of association with the euro area cycle, while Finland, Greece and Portugal are the countries who show the lowest correlations/concordances with the euro area and also those that display greater volatility in cycles.
In dynamic terms, we verify that the degree of synchronisation has varied over time. This fact can be observed in the correlation, concordance, and standard deviation for a rolling sample of 8 years. In general the rolling correlation and concordance of the euro area
countries with respect to the euro area cycle (and with the German cycle) have shown that the euro area business cycles have become increasingly synchronous, being therefore consistent with the endogeneity of OCA hypothesis. Moreover, the gradual decrease in the business cycles amplitude provides additional support to the hypothesis of increased synchronisation of the cycles within the euro area.
The analysis carried out for sub-periods allows us to distinguish two different patterns of evolution: one for the largest economies and another for the smallest ones. In general, during the three sub-periods considered, the four largest economies are increasingly more synchronised with the euro area. Conversely in the group of small countries the evolution is different. From the first to the second sub-period, there is a notable increase in the degree of synchronisation with the euro area cycle but in the third sub-period, after 1997, the degree of synchronisation with the euro area is reduced. This reduction is nevertheless moderate, with the exception of Greece, which stands out for its enormous asynchronisation. In fact, Greece is a peculiar case because it is the only country of the euro area which exhibits a significant reduction of the synchronisation with the average of the EMU throughout the three sub-periods, and in particular in the last one. In the case of Portugal, the evolution of its level of synchronisation in the single currency period is of major concern as it indicates that the Portuguese economy has had difficulties in adjusting to the functioning rules of the monetary union and/or felt the costs associated with the intensification of the globalization process, namely the competition from China, India and Eastern European countries.
Evidence suggests that the ECB monetary policy, in place since 1999, has not been adjusted to the business cycles of some of the small countries. In a recent article, Blanchard also expresses his concerns about the EMU future: “The euro area is characterised by a
succession of booms and busts each in a single country. A typical stop-go cycle starts with a localised increased in demand which in turn leads to higher wages, lost competitiveness and finally to a protracted downturn. Since short-term interest rates in the euro area are not tailored to individual countries’ cycles, monetary policy can attenuate neither boom nor bust”. 11
References
Agresti, A.-M. and B. Mojon (2003), “Some stylised facts on the euro area business cycle”, in
Monetary Policy Transmission in the Euro Area, I. Angeloni, A. Kashyap e B. Mojon
(eds), Cambridge University Press, 15-35.
Altavilla, C. (2004), “Do EMU members share the same business cycle?”, Journal of
Common Market Studies, 42(5): 869-96.
Artis M. and W. Zhang (1997), “International business cycles and the ERM: Is there a European Business Cycle?” International Journal of Finance and Economics, 2: 1-16.
11
Artis M. and W. Zhang (1999), “Further Evidence on International business cycles and the ERM: Is there a European Business Cycle?”, Oxford Economic Papers, 51: 120-32. Artis, M. (2003), “Reflection on the Optimal Currency Area criteria in the light of EMU”,
International Journal of Finance and Economics, Special Issue, Monetary Union and
Dollarization.
Artis, M. (2004), “Is There a European Business Cycle?” in Horst Siebert (ed.),
Macroeconomic Policies in the World Economy, Heidelberg: Springer, 53-79.
Artis, M., H.-M. Krolzig and J. Toro (2004), “The European business cycle”, Oxford
Economic Papers, 56: 1-44.
Baxter M. and R. King (1999), “Measuring Business Cycles: Approximate Band-Pass Filters for Economic Time Series”, The Review of Economics and Statistics, 81: 575-593.
Bayoumi, T. and B. Eichengreen (1993), “Shocking Aspects of European Monetary Unification”, in Adjustment and Growth in the European Monetary Union, F. Giavazzi e F. Torres (eds), Cambridge: Cambridge University Press, 193-229
Blanchard, O. and D. Quah (1989), “The Dynamic Effects of Aggregate Demand and Supply Disturbances”, The American Economic Review, 79(4): 655-73.
Canova, F. (2007), “Extracting and Measuring Cyclical Information”, in Methods for Applied
Macroeconomic Research, Universitat Pompeu Fabra, IGLIER and CEPR, Princeton
University Press, 70-110.
De Grauwe, P. and F. Mongelli (2005), “Endogeneities of Optimum Currency Areas? What brings countries sharing a single currency closer together?”, Working Paper Series, European Central Bank, Nº 468.
Dickerson, A., H. Gibson and E. Tsakalotos (1998), “Business Cycle Correspondence in the European Union”, Empirica, 25(1): 51-77.
European Commission (1990), “One Market, One Money – An Evaluation of the Potential Benefits and Costs of forming an Economic and Monetary Union”, European Economy, Nº 44.
Fidrmuc, J. (2005), “The Endogeneity of Optimum Currency Area Criteria and Intra-Industry Trade: Implications for EMU Enlargement”, in Paul De Grauwe and Jaques Melitz, (Eds), Prospects for Monetary Unions after the Euro, MIT Press, 55-76.
Frankel, J. and A. Rose (1998), “The endogeneity of the Optimum Currency Area Criteria”,
Economic Journal, 41: 753-760.
Gruben, W., J. Koo and E. Millis (2002), “How Much Does International Trade Affect Business Cycle Synchronization?”, Federal Reserve Bank of Dallas, Working Paper, Nº 203.
Harding D. and A. Pagan, (2002), “Dissecting the cycle: a methodological investigation”,
Journal of Monetary Economics, 49: 365-81.
Hodrick, R. and E. Prescott (1997), “Postwar U.S. Business Cycles: An Empirical Investigation”, Journal of Money Credit and Banking, 29: 1-16.
Imbs, Jean (2004), “Trade, Finance, Specialization and Synchronization”, Review of
Economics and Statistics, 86: 723-734.
Inklaar, R. and J. De Haan, (2001) “Is there really an European Business Cycle?: A comment”, Oxford Economic Papers, 53: 215-20.
Inklaar, R. R. Jong-A-Pin and J. De Haan (2005), “Trade and Business cycle synchronization in OECD Countries – A Re-examination, CESifo Working Paper, Nº 1546.
Kalemli-Ozcan, S., B. E. Sorensen e O. Yosha (2003), “Risk Sharing and Industrial Specialization: Regional and International Evidence”, American Economic Review, 93(3): 903-108.
Kenen, P. B. (1969), "The Theory of Optimum Currency Areas: An Eclectic View", in
Monetary Problems of the International Economy, R. Mundell e A. K. Swoboda, (eds),
Chicago: University of Chicago Press, 41-60.
Krugman, P. (1993). “Lessons from Massachusetts for EMU”, in Adjustment and Growth in
the European Union, F. Torres and F. Giavazzi (eds), Cambridge: Cambridge
University Press, 241-260.
Lucas, R. (1977), “Understanding Business Cycles”, Carnegie Rochester Conference Series
on Public Policy, 7-29.
Massmann M. and J. Mitchell (2004), “Reconsidering the Evidence: are Eurozone business cycles converging?”, Journal of Business Cycle Measurement and Analysis, 1(3): 275-308.
McDermott, C. John and A. Scott (2000), “Concordance in Business Cycles”, IMF Working
Paper Nº 00/37.
Mckinnon, R. I. (1963), “Optimum Currency Areas”, The American Economic Review, 53: 717-725.
Micco, A., E. Stein e G. Ordoñez (2003), “The Currency Union Effect On Trade: Early Evidence from EMU”, Economic Policy, 37: 315-356.
Mongelli, F. P. (2002), “New view on the optimum currency area theory: what is EMU telling us?”, European Central Bank, Working Paper nº 138.
Mundell, R. A. (1961), “A Theory of Optimum Currency Areas”, The American Economic
Perez, P., D. Osborn and M. Sensier (2007), “Business cycle affiliations in the context of European integration”, Applied Economics, 39(2): 199-214.
Rose, A. (2000), “One Money, one market: The effect of Common Currencies on Trade”,
Economic Policy, 30: 7-46.
The Economist (2007), “Beggar thy neighbour”, January 27th, 65-66.
Wynne, M. and Koo, J. (2000), “Business cycles under monetary union: a comparison of the EU and the US, Economica, 67: 347-74.
Appendix 1 – Summary of the literature on business cycles synchronisation in the euro area
Authors Data Measure of cycle Measure of synchronisation Conclusions
Artis and Zhang (1997, 1999)
OECD data on monthly industrial production, 1961:1-1993:12 (1997); 1961:1-1995:10 (1999); All euro area countries except AUS, FIN and LUX, plus six other countries.
Deviation cycles extracted via 3 methods: PAT, HP filter and linear trending.
Two sub-samples (pre-ERM period and ERM period);
Contemporaneous and maximum correlation coefficients with Germany (and with the USA).
Overall, the synchronicity and linkage between ERM economies and Germany has grown strongly between the two sub-periods (whilst the linkages with the USA cycle have diminished).
For Portugal and Spain (who joined the ERM in 1989 and 1992, respectively) the degree of synchronisation with the German cycle in the ERM period is less than that of any other ERM country.
Results appear robust across filtering method. Dickerson et
al. (1998)
OECD data of annual real GDP indices, 1960-1993; All euro area countries plus 11 other countries.
Deviation cycles extracted via HP filter.
Three sub-periods (1960s, 1970s and 1980/90s);
Pairwise correlations coefficients (to analyse the timing of cycles); MADs (to measure the amplitudes of cycles)
The authors find no evidence that business cycles in the EU12 have become more synchronised after the formation of the ERM.
There is a clear core-periphery distinction within the EU in both the time and magnitude of cycles. Evidence of strong comovements among a core group (AUS, BEL, FRA and DEU), not shared by all other EU countries.
Wynne and Koo (2000)
OECD data of total employment (1960-1996), and annual total output (1963-1992);
All euro area countries plus three EU countries.
Deviation cycles extracted via BK band pass filter.
Pairwise correlations coefficients and standard deviation using GMM.
In the EU founding members (BEL, FRA, DEU, ITA, LUX and NLD) the cycles show a higher degree of synchronisation than in any of the other countries that joined the EU in a later stage.
The cyclical dispersion among euro area cycles appears to be decreasing by decade.
Inklaar and de Haan (2001)
OECD data of industrial production, 1961:1-1997:12; All euro area countries except PRT, plus seven other countries.
Deviation cycles extracted via 3 methods: PAT, HP filter and linear trending.
Four sub-periods (1960-71; 1971-79; 1979-87; 1987-97);
Contemporaneous correlation coefficient with German cycle.
Overall, no evidence that business cycles in the ERM countries have become more synchronised after the formation of the ERM.
Most ERM countries show an increase in correlation with Germany from 1960-71 to 79, but a decrease from 1971-1979 to the 1971-1979-87 period.
Agresti and Mojon (2003)
ECB AWM data of GDP, 1970:1-2000:4;
All euro area countries except LUX and IRL, plus US.
Deviation cycles extracted via BK band pass filter.
Contemporaneous correlation of each national business cycle with the aggregate euro area cycle.
The contemporaneous correlations are relatively high for most of the countries (between 0.7 and 0.92). The exceptions are for the countries in periphery such as Greece, Portugal or Finland (where the correlation drops to around 0.4).
Artis et al. (2004)
OECD data of industrial production, 1961:1-1996:12; All euro area countries except GRC, IRL, FIN and LUX, plus UK.
Deviation cycles proxied by smoothed probabilities of recession regimes estimated via Markov-switching models.
Pairwise correlation coefficients and contingency indices.
Overall, relatively high correlation and contingency values among euro area countries.
Artis (2004) IMF data of quarterly real GDP indices, 1970:1-2001:4 (NLD and PRT: 1997; BEL: 1980, IRL:1997)
All euro area countries except Luxemburg, plus other countries
Deviation cycles extracted via a band pass filter based on combining two HP low-pass filters.
Three sub-periods (1970-79; 1980-92; 1993-2001);
Pairwise contemporaneous correlation coefficients.
Overall, evidence of high correlation of all euro area cycles with euro area aggregate cycle and indications of increasing synchronisation during 90s.
Massmann and Mitchell (2004)
OECD data of industrial production, 1961:1-2001:8; All euro area countries.
Deviation cycles extracted alternatively via three parametric methods (BN, UC, TIM) and four non-parametric methods (MA, HP, BK, PAT);
Classical cycles using one measure proposed by Harding & Pagan.
Pairwise contemporaneous
correlations and standard deviations using GMM;
Rolling correlation coefficient.
Although empirical inference about individual euro area business cycles is found to be sensitive to the measure of the business cycle, the measure of convergence exhibits common features across the alternative measures of cycle.
Euro area has been characterised by periods of convergence, and periods of divergence. Evidence suggest that euro area has entered a period of convergence after the period of diverge in the early 90s. Some evidence that over the past 20 years correlations on average tended to increase.
Altavilla (2004)
OECD data of real GDP, 1980:1-2002:4
Five euro area countries (BEL, DEU, ESP, FRA, ITA), euro area, the UK and US
Deviation cycles extracted via HP filter and BK band pass filter;
Classical cycles based on MS-AR
Two sub-periods: 1980-1991; 1992-2002.
Cross-correlation coefficients and concordance indices.
Overall, the business cycles were reasonably similar across European countries in both their duration and amplitude. During the 1992-2002 period the euro area cycles become more synchronised, which suggest that adhesion to new currency area is likely to lead to stronger synchronisation of EMU members´ business cycles.
Pérez et al. (2007)
OECD and IMF data of GDP, 1960:1-2002:1;
All euro area countries except GRC, IRL, LUX and PRT, plus five other countries.
Deviation cycles extracted via HP filter and BK band pass filter;
Growth rates.
Rolling contemporary correlations and maximum positive correlation with Germany (and with USA); correlations over sub-periods (1960-1979, 1980-1990, 1991-2002 and 1993-2002).
Overall, the euro area countries cycles (FRA, ITA, ESP and NLD) become more synchronised with the German cycle, particularly since the 90s.
Note: PAT = phase-average-trend; HP = Hodrick and Prescott; BK = Baxter King; MAD = mean absolute deviation; GMM = generalized methods of moments; AWM = Euro Area Wide model; BN = Beveridge-Nelson decomposition; UC = Unobserved components models; TIM = Linear regression models; MA = moving average; MS-AR = Markov-switching autoregressive models
Appendix 2 – Data source and availability
The main source is the OECD National Account’s database, but the real GDP for Portugal has been extracted from databases of the Bank of Portugal (BP), “Quarterly Series for the Portuguese Economy” published in the Economic Bulletin in the summer of 2006.
German data refers to a unified Germany since January 1991, and for the period between the first quarter of 1980 and the fourth quarter of 1991, they are concerned only with West Germany, which brings to the fore a break in Germany’s series in 1991. In order to correct this break we calculated: 1) for the first quarter of 1991, the ratio of the two series (the real GDP from unified Germany divided by the real GDP from West Germany); 2) we used the value obtained for scaling up the real GDP from West Germany in the fourth quarter of 1990; and 3) we corrected backwards (from the fourth quarter of 1990 to the first quarter of 1980) the values of the West German series maintaining the growth rates of the original series.
Using the quarterly series of the GDP, we pretend to turn as possible as we can, certain limitations that, in our opinion some studies had, particularly: a) the use of annual data (typically the real GDP or total employment), which implies that much of the business cycle dynamics is lost; b) the use of sectoral data (typically the industrial production), that although the series is more harmonised among the several countries and is available for a longer period, it represents only one part of the economic activity of the country.
The available data, sample periods and sources are shown in the table below.
Country Code Sample Period Source
Germany DEU 1980:1-2004:4 OECD (1970:1-2005:4)
France FRA 1980:1-2004:4 OECD (1970:1-2005:3)
Italy ITA 1980:1-2004:4 OECD (1970:1-2005:3)
Spain ESP 1980:1-2004:4 OECD (1970:1-2004:4)
Belgium BEL 1980:1-2004:4 OECD (1980:1-2005:2)
Netherlands NLD 1980:1-2004:4 OECD (1977:1-2005:1)
Greece GRC 1980:1-2004:4 OECD (1970:1-2005:3)
Portugal PRT 1980:1-2004:4 BP (1978:1-2005:4)
Finland FIN 1980:1-2004:4 OECD (1975:1-2005:1)
Appendix 3 – Further results
Table A1 – Measures of synchronisation with respect to Germany, 1981-2004
FRA ITA ESP av. l. NLD BEL PRT GRC FIN av. s.
Cont. correlation 0.49 0.62 0.51 0.54 0.79 0,60 0.41 0.53 0.42 0.45 Max. correlation 0.51 0.62 0.59 0.57 0.8 0.65 0.41 0.54 0.47 0.69
Lead/lag 0 0 -1 0 -1 1 1 -4
Cont. concordance 0.68 0.74 0.65 0.69 0.78 0.71 0.65 0.65 0.63 0.66
Note: av. l. = average 3 largest countries; av. s. = average small countries
Table A2 – Measures of synchronisation with respect to Germany for sub-periods Sub-period FRA ITA ESP av. l. NLD BEL PRT GRC FIN av. s.
Cont. correlation -0.28 0.58 -0.52 -0.22 0.9 0.43 -0.47 0.67 -0.14 0.28 Max. correl. 0.08* 0.58 0.20* 0.29 0.9 0.43 0.08 0.73 0.28 0.48 Lead/lag -5 0 -5 0 0 5 1 -3 Cont. concordance 1981-1988 0.34 0.69 0.47 0.5 0.88 0.63 0.53 0.78 0.56 0.68 Cont. correlation 0.52 0.47 0.72 0.57 0.76 0.59 0.73 0.31 0.05 0.49 Max. correl. 0.54 0.53 0.73 0.6 0.8 0.67 0.73 0.49 0.79 0.7 Lead/lag -1 -1 -1 -1 -1 0 3 -5 Cont. concordance 1989-1996 0.78 0.66 0.66 0.7 0.69 0.81 0.69 0.56 0.47 0.64 Cont. correlation 0.86 0.92 0.74 0.84 0.81 0.74 0.73 -0.03* 0.4 0.53 Max. correl. 0.86 0.92 0.81 0.86 0.81 0.83 0.73 0.10* 0.41 0.58 Lead/lag 0 0 -1 0 -1 0 2 -1 Cont. concordance 1997-2004 0.91 0.88 0.81 0.84 0.78 0.69 0.72 0.5 0.5 0.64
Note: av. l. = average 4 largest countries; av. s. = average small countries
(*) The correlation coefficient is not statistically significant with a level of significance of 10%
-0.4 -0.2 0.0 0.2 0.4 0.6 0.8 1.0 81-88 86-93 91-98 96-03 FRA Trend_FRA 0.0 0.2 0.4 0.6 0.8 1.0 81-88 86-93 91-98 96-03 ITA Trend_ITA -0.6 -0.2 0.2 0.6 1.0 81-88 86-93 91-98 96-03 ESP Trend_ESP 0.0 0.2 0.4 0.6 0.8 1.0 81-88 86-93 91-98 96-03 NLD Trend_NLD 0.0 0.2 0.4 0.6 0.8 1.0 81-88 86-93 91-98 96-03 BEL Trend_BEL -1.0 -0.6 -0.2 0.2 0.6 1.0 81-88 86-93 91-98 96-03 PRT Trend_PRT 0.0 0.2 0.4 0.6 0.8 1.0 81-88 86-93 91-98 96-03 GRC Trend_GRC -0.4 -0.2 0.0 0.2 0.4 0.6 0.8 1.0 81-88 86-93 91-98 96-03 FIN Trend_FIN
0.2 0.4 0.6 0.8 1.0 81-88 86-93 91-98 96-03 FRA Trend_FRA 0.4 0.6 0.8 1.0 81-88 86-93 91-98 96-03 ESP Trend_ESP 0.4 0.6 0.8 1.0 81-88 86-93 91-98 96-03 ITA Trend_ITA 0.4 0.6 0.8 1.0 81-88 86-93 91-98 96-03 NLD Trend_NLD 0.4 0.6 0.8 1.0 81-88 86-93 91-98 96-03 BEL Trend_BEL 0.4 0.6 0.8 1.0 81-88 86-93 91-98 96-03 PRT Trend_PRT 0.4 0.6 0.8 1.0 81-88 86-93 91-98 96-03 GRC Trend_GRC 0.2 0.4 0.6 0.8 1.0 81-88 86-93 91-98 96-03 FIN Trend_FIN
Figure A2 – Contemporary rolling concordance with respect to Germany
-0.2 0.0 0.2 0.4 0.6 0.8 1.0 81-88 86-93 91-98 96-03 FRA Trend_FRA 0.0 0.2 0.4 0.6 0.8 1.0 81-88 86-93 91-98 96-03 ITA Trend_ITA -0.2 0.0 0.2 0.4 0.6 0.8 1.0 81-88 86-93 91-98 96-03 ESP Trend_ESP 0.0 0.2 0.4 0.6 0.8 1.0 81-88 86-93 91-98 96-03 NLD Trend_NLD 0.0 0.2 0.4 0.6 0.8 1.0 81-88 86-93 91-98 96-03 BEL Trend_BEL -0.2 0.0 0.2 0.4 0.6 0.8 1.0 81-88 86-93 91-98 96-03 PRT Tend_PRT 0.0 0.2 0.4 0.6 0.8 1.0 81-88 86-93 91-98 96-03 GRC Trend_GRC 0.0 0.2 0.4 0.6 0.8 1.0 81-88 86-93 91-98 96-03 FIN Trend_FIN