EUROPEAN ORGANISATION FOR NUCLEAR RESEARCH (CERN)
CERN-EP-2018-137 July 18, 2018
Search for lepton-flavor violation in different-flavor,
high-mass final states in p p collisions at
√
s
= 13 TeV with the ATLAS detector
The ATLAS Collaboration
A search is performed for a heavy particle decaying into different-flavor, dilepton pairs (e µ, eτ or µτ), using 36.1 fb−1of proton–proton collision data at
√
s = 13 TeV collected in 2015–2016 by the ATLAS detector at the Large Hadron Collider. No excesses over the Standard Model predictions are observed. Bayesian lower limits at the 95% credibility level are placed on the mass of a Z0boson, the mass of a supersymmetric τ-sneutrino, and on the threshold mass for quantum black-hole production. For the Z0 and sneutrino models, upper cross-section limits are converted to upper limits on couplings, which are compared with similar limits from low-energy experiments and which are more stringent for the eτ and µτ modes.
1 Introduction
Direct charged-lepton flavor violation (LFV) is forbidden in the Standard Model (SM) of particle physics but is allowed in many extensions of the SM. Many such models predict new particles with LFV decays, such as Z0 bosons [1], scalar neutrinos in R-parity-violating (RPV) [2, 3] supersymmetry (SUSY) and quantum black holes (QBH) in low-scale gravity [4]. Processes with flavor-violating dilepton decays are expected to produce pairs of prompt, different-flavor leptons, a final state with a clear experimental signature and a low background from SM processes. The Z /γ∗→`` process is an irreducible background for same-flavor lepton searches but in different-flavor searches is limited to the production and decay of a ττ pair. This paper describes a search for new phenomena in final states with two leptons of different flavor using 36.1 fb−1 of data from proton–proton (pp) collisions at
√
s = 13 TeV at the Large Hadron Collider (LHC).
A common extension of the SM is the addition of an extra U(1) gauge symmetry resulting in a massive neutral vector boson known as a Z0boson [1]. The search presented in this paper assumes a Z0boson with the same quark couplings and chiral structure as the SM Z boson but only leptonic decays that violate Lepton Flavour Conservation are allowed. The parameter Qi j, where i, j = 1 . . . 3 represent the three lepton generations, gives the strength of the LFV couplings relative to the SM `` couplings. The ATLAS Collaboration placed lower limits of 3.3, 2.9, and 2.7 TeV on the mass of a Z0 boson decaying into e µ, eτ, and µτ pairs, respectively, using 3.2 fb−1of the 13 TeV data [5], while the CMS Collaboration has
placed limits up to 4.4 TeV on a Z0boson decaying into an e µ final state using 35.9 fb−1[6]. Following the same methodology as in Ref. [5], this paper assumes only one LFV coupling is different from zero at any time for the purpose of setting limits on the cross-section times branching of each final state considered. Polarization of τ-leptons is not included in the model, but its impact on the τ-lepton acceptance is found to be negligible.
In RPV SUSY, the superpotential terms allowing LFV are expressed as 12λi jkLiLjEkc + λ0i jkLiQjDck, where L and Q are the SU(2) doublet superfields of leptons and quarks, E and D are the SU(2) singlet superfields of charged leptons and down-type quarks, λ and λ0 are Yukawa couplings, and the indices i, j, and k denote generations. A τ-sneutrino ( ˜ντ) may be produced in pp collisions by d ¯d annihilation and subsequently decay into e µ, eτ, or µτ. Although only ˜ντ is considered in this paper, results apply to any sneutrino flavor. For the theoretical prediction of the cross-section times branching ratio, the ˜ντ
coupling to first-generation quarks (λ3110 ) is assumed to be 0.11 for all channels. As in the Z0model, each lepton-flavor-violating final state is considered separately. It is assumed that λ312= λ321= 0.07 for the eµ
final state, λ313= λ331 = 0.07 for the eτ final state, and λ323 = λ332 = 0.07 for the µτ final state. These
values are consistent with benchmark models used in previous ATLAS and CMS searches [5,7,8]. The CMS Collaboration has recently excluded R-parity-violating supersymmetric models below 1.7 TeV for λ132 = λ231 = λ
0
311 = 0.01 [6].
Various models introduce extra spatial dimensions to reduce the value of the Planck mass and resolve the hierarchy problem. The search described in this paper presents interpretations based on the Arkani-Hamed–Dimopoulos–Dvali (ADD) model [9], assuming n = 6, where n is the number of extra dimensions, and on the Randall–Sundrum (RS) model [10] with one extra dimension. Due to the increased strength of gravity at short distances in these models, pp collisions at the LHC could produce states exceeding the threshold mass (mth) and form black holes. For the models considered, mth is assumed to be equivalent
to the extra-dimensional Planck scale. For masses beyond 3–5mth, it is expected that thermal black holes
would be produced [11,12], characterized by high-multiplicity final states. The search presented in this paper focuses on the mass region below 3–5 mth, known as the quantum gravity regime [13–15], where
production of non-thermal (or quantum) black holes is expected and these black holes could decay into two-particle final states, producing the topology investigated in this paper. Non-thermal quantum black holes would have a continuum mass distribution from mthup to the beginning of the thermal regime. For
the models considered in this paper, the thermal regime is assumed to start at 3mth. The decay of quantum
black holes would be governed by a yet unknown theory of quantum gravity. The two main assumptions of the extra-dimensions models considered [4] in this paper are (a) gravity couples with equal strength to all SM particle degrees of freedom and (b) gravity conserves local symmetries (color and electric charge) but can violate global symmetries such as lepton-flavor and baryon-number conservation. Following these assumptions, the branching ratio to each final state is calculated. QBHs decaying into different-flavor, opposite-charge lepton pairs are created via q ¯q or gg annihilation. The branching ratio to ``0is 0.87% (0.34%) for a q ¯q (gg) initial state [4]. These models were used in previous ATLAS and CMS searches for quantum black holes in dijet [16–18], lepton+jet [19], photon+jet [20], e µ [6], and same-flavor dilepton [21] final states.
2 The ATLAS detector
The ATLAS detector [22] is a general-purpose particle detector with approximately forward–backward symmetric cylindrical geometry.1 It is composed of four main components, each responsible for identifying and reconstructing different types of particles: the inner detector (ID), the electromagnetic and hadronic calorimeters, and the muon spectrometer (MS). Each of the subdetectors is divided into two components, barrel and endcap, to provide coverage close to 4π in solid angle. In addition, two magnet systems allow charge and momentum measurements: an axial magnetic field of 2.0 T provided by a solenoid surrounding the ID and a toroidal magnetic field for the MS. The ID, the closest component to the interaction point, is used to reconstruct the trajectories of charged particles in the region |η| < 2.5 and measure their momenta. It is composed of three subsystems: (1) the silicon pixel detector, including an additional inner layer at a radius of 3.2 cm added in 2015 [23, 24], (2) the semiconductor tracker, used in conjunction with the silicon pixel detector to determine primary and secondary vertices with high precision thanks to their high granularity, (3) the transition radiation tracker, providing additional tracking in the region |η| < 2.0 and electron identification.
The calorimeter system covers the pseudorapidity range |η| < 4.9. Within the region |η| < 3.2, magnetic calorimetry is provided by barrel and endcap high-granularity lead/liquid-argon (LAr) electro-magnetic calorimeters, with an additional thin LAr presampler covering |η| < 1.8, to correct for energy loss in material upstream of the calorimeters. Hadronic calorimetry is provided by the steel/scintillating-tile calorimeter, segmented into three barrel structures within |η| < 1.7, and two copper/LAr hadronic endcap calorimeters. The solid angle coverage is completed with forward copper/LAr and tungsten/LAr calorimeter modules optimised for electromagnetic and hadronic measurements respectively.
Surrounding the calorimeter system, the MS is the subdetector furthest from the interaction point. It consists of three layers of precision tracking chambers and fast detectors for triggering on muons. Tracking coverage is provided for |η| < 2.7 by three layers of precision drift tube chambers, with cathode strip
1ATLAS uses a right-handed coordinate system with its origin at the nominal interaction point (IP) in the center of the detector
and the z-axis along the beam pipe. The x-axis points from the IP to the center of the LHC ring, and the y-axis points upward. The x–y plane is referred to as the transverse plane, used to define quantities such as the transverse momentum (pT). Cylindrical
coordinates (r, φ) are used in the transverse plane, φ being the azimuthal angle around the z-axis. The pseudorapidity is defined in terms of the polar angle θ as η = − ln tan(θ/2). Angular distance is measured as ∆R =
p
chambers in the innermost layer for |η| > 2.0, while trigger coverage is provided by resistive plate and thin gap chambers for |η| < 2.4.
The trigger and data-acquisition system is based on two levels of online event selection [25]: the level-1 trigger and the high-level trigger. The level-1 trigger is hardware-based and uses a subset of detector information to provide quick trigger decisions and reduce the accepted rate to 100 kHz. The high-level trigger is software-based and exploits the full detector information to further reduce the acceptance rate to about one kHz.
3 Data and simulated samples
The data sample used for this analysis was collected during 2015 and 2016 from pp collisions at a center-of-mass energy of 13 TeV. After selecting periods with stable beams and applying data-quality requirements, the total integrated luminosity is 36.1 fb−1with an uncertainty of 2.1%, derived following a methodology similar to that detailed in Ref. [26] from a calibration of the luminosity scale using x–y beam-separation scans.
The pp → Z0→``0samples were generated at leading order (LO) using the generator Pythia 8.186 [27] with the NNPDF23LO [28] parton distribution function (PDF) set and the A14 [29] set of tuned parameters. Signal samples for 25 mass points ranging from 0.5 TeV to 5 TeV were generated in 0.1 TeV steps from 0.5 to 2 TeV, 0.2 TeV steps from 2 to 3 TeV, and 0.5 TeV steps from 3 to 5 TeV. The production cross-section was calculated with the same generator used for simulation. The cross-section and signal shape in the dilepton invariant mass distribution were corrected from LO to next-to-next-to-leading order (NNLO) in the strong coupling constant with a rescaling that depends on the dilepton invariant mass and which was computed with VRAP 0.9 [30] and the CT14NNLO PDF [31] set. This correction is applied as a multiplicative factor of about 0.98 at a dilepton invariant mass m``0of 3 TeV. No mixing of the Z0boson
with the Z and γ∗bosons is included.
The d ¯d → ˜ντ →``0samples were generated at LO with MadGraph5_aMC@NLO v2.3.3 [32] interfaced to the Pythia 8.186 parton shower model with the NNPDF23LO PDF set and the A14 tune. The signal samples were generated at the same masses as for the Z0model described above. The cross-section was calculated at LO with the same generator used for simulation and corrected to next-to-leading order (NLO) using LoopTools v2.2 [33].
The pp → QBH → ``0samples were generated with the program QBH 3.00 [34] using the CTEQ6L1 [35] PDF set and the A14 tune, for which Pythia 8.183 provides showering and hadronization. For each extra-dimensional model, eleven mthpoints in 0.5 TeV steps were produced: from 3 to 8 TeV for the ADD
n= 6 model and from 1 to 6 TeV for the RS n = 1 model. The production cross-section was calculated with the same generator used for simulation. These two models differ in the number and nature of the additional extra dimensions (large extra dimensions for ADD and one highly warped extra dimension for RS). In particular, the ADD model produces black holes with a larger gravitational radius and hence the parton–parton cross-section for this model is larger than for the RS model. Therefore, the mthrange of the
generated samples differs for the two models.
The SM background in the LFV dilepton search is due to several processes which produce a final state with two different-flavor leptons. For the e µ mode, the dominant background contributions originate from t ¯t and single-top production, with the subsequent decays of the top quark producing leptonically decaying W bosons. Other backgrounds originate from diboson (WW, W Z, and Z Z) production, and τ-lepton
pair production q ¯q → Z/γ∗→ττ, which both produce different-flavor final states, through the leptonic decays of the W and Z bosons or the τ-leptons. They contribute about 15% and 1% of the background, respectively. Multijet and W +jets processes contribute due to the misidentification of jets as leptons and are the dominant background for the final states with a τ-lepton.
Backgrounds from top-quark production include t ¯t and single-top with an associated W boson (tW ). Both were generated at NLO using the Powheg-Box [36–38] generator (v2 for t ¯t and v1 for single-top) with the CT10 [39] PDF set used in the matrix-element calculations. Pythia 6.4.28 [40] and the corresponding Perugia 2012 tune [41] were used to simulate the parton shower, hadronization, and the underlying event. Top quarks were decayed using MadSpin [42], preserving all spin correlations. The hdamp parameter,
which controls the pTof the first emission beyond the Born configuration in Powheg-Box, was set to the
mass of the top quark. The main effect of this parameter is to regulate the high-pTemission against which
the t ¯t system recoils. The mass was set to the top quark mass of 172.5 GeV. The EvtGen 1.2.0 program [43] was used for the properties of b- and c-hadron decays. A value of 831+20−29(scale)+35−35(PDF+αS)+23−22(mass
uncertainty) pb is used for the t ¯t production cross-section, computed with Top++ 2.0 [44], incorporating NNLO QCD corrections, including resummation of next-to-next-to-leading logarithmic (NNLL) soft gluon terms. A W t production cross-section of 71.7 ± 3.8 pb is used, as computed in Ref. [45] to approximately NNLO (NNLL+NLO) accuracy.
Diboson processes producing at least two charged leptons were simulated using the Sherpa 2.2.2 genera-tor [46]. The matrix elements contain all diagrams with four electroweak vertices. Fully leptonic decays were calculated for up to one parton (four leptons, or two leptons and two neutrinos) or zero partons (three leptons and one neutrino) at NLO and up to three partons at LO using the Comix [47] and OpenLoops [48] matrix-element generators and merged with the Sherpa parton shower [49] using the ME+PS@NLO pre-scription [50]. The CT10 PDF set was used in conjunction with the default parton shower tuning provided by the authors of Sherpa. Inclusive cross-section values of 1.28, 4.51, and 10.64 pb are used for Z Z , W Z , and WW production, respectively.
Events containing W or Z bosons are generated using Powheg-Box v2 interfaced to the Pythia 8.186 parton shower model. The CT10 PDF set is used in the matrix element. The AZNLO set of tuned parameters [51] is used, with PDF set CTEQ6L1, for the modelling of non-perturbative effects. The EvtGen 1.2.0 program is used for the properties of b- and c-hadron decays. Photos++ 3.52 [52] is used for QED emissions from electroweak vertices and charged leptons. The W /Z samples are normalised with the NNLO cross sections. This background contribution is normalized to an inclusive cross-section of 1.9 nb, calculated for m`` >60 GeV.
Processes such as W +jets and multijet production with jets that are misidentified as leptons were estimated through a combination of data-driven methods and simulation, detailed in Section5. The W +jets contribu-tion was estimated with the aid of the Sherpa 2.2.2 simulated samples. Matrix elements were calculated for up to two partons at NLO and four partons at LO using Comix and OpenLoops and merged with the Sherpa parton shower [49] according to the ME+PS@NLO prescription [50]. The overall cross-section times branching ratio for the W±→`±ν+jets events is taken to be 59.6 nb.
For all samples used in this analysis, the effects of multiple proton–proton interactions per bunch crossing (pileup) were included by overlaying minimum-bias events simulated with Pythia8.186 using the ATLAS A14 set of tuned parameters [53] and reweighting the simulated events to reproduce the distribution of the number of interactions per bunch crossing observed in the data. The generated events were processed with the ATLAS simulation infrastructure [54], based on Geant4 [55], and passed through the trigger simulation and the same reconstruction software used for the data.
4 Event reconstruction and selection
This search is optimized to look for new phenomena in the high mass range. Events are selected if they satisfy a single-muon or single-electron trigger with a pTthreshold of 50 GeV for muons and 60 or
120 GeV for electrons. The single-electron trigger with higher pT threshold has a looser identification
requirement, resulting in an increased trigger efficiency at high pT.
Electron candidates are formed by associating the energy in clusters of cells in the electromagnetic calorimeter with a track in the ID [56]. A likelihood discriminant suppresses contributions from hadronic jets, photon conversions, Dalitz decays, and semileptonic heavy-flavor hadron. The likelihood discrimi-nant utilizes lateral and longitudinal calorimeter shower shapes plus tracking and cluster–track matching quantities. The discriminant criterion is a function of the pT and |η| of the electron candidate. Two
operating points are used in this analysis, as defined in Ref. [57]: Medium and Tight. The Tight working point (85% efficient at pT = 65 GeV determined with Z → ee events) is required for electron candidates.
Electron candidates must have pT > 65 GeV and |η| < 2.47, excluding the region 1.37 < |η| < 1.52,
where the energy reconstruction performance is degraded due to the presence of extra inactive material. Further requirements are made on the transverse and longitudinal impact parameters of the track, which is the distance between the z-position of the point of closest approach of the track in the ID to the beamline and the z-coordinate of the primary vertex relative to the primary vertex of the event (d0and ∆z0). The
requirements are the following: |d0/σd0| < 5 and |∆z0sin θ | < 0.5 mm. Candidates are required to satisfy
relative track-based (as defined above for muon candidates) and calorimeter-based isolation requirements with an efficiency of 99% to suppress background from non-prompt electrons originating from heavy-flavor semileptonic decays, charged hadrons, and photon conversions from π0 decays. The sum of the calorimeter transverse energy deposits (excluding the electron itself) in an isolation cone of size ∆R = 0.2 divided by the electron pT is the discriminant used in the calorimeter-based isolation criterion. For the
reducible background estimation, electron candidates passing the Medium working point (95% efficient at pT = 65 GeV determined with Z/γ
∗
→ ee events) are referred to as “loose electrons”.
Candidate muon tracks are initially reconstructed independently in the ID and the MS. The two tracks are input to a combined fit which takes into account the energy loss in the calorimeter and multiple scattering. Muon identification is based on information from both the ID and MS to ensure that muons are reconstructed with the optimal momentum resolution up to very high pTusing the High-pToperating
point [58]. Only tracks with hits in each of the three stations of the muon spectrometer are considered. This provides a muon transverse momentum resolution of about 10% at 1 TeV. Moreover, muon candidates are required to be within the ID acceptance region2of |η| < 2.5, fulfill |d0/σd0|< 3 and |∆z0sin θ | < 0.5 mm,
have a transverse momentum larger than 65 GeV, and fulfill a track-based isolation criterion with an efficiency of 99% over the full range of muon momenta to further reduce contamination from non-prompt muons. The scalar sum of the transverse momenta of tracks (excluding the muon itself) in an isolation cone of size ∆R = 0.2 divided by the muon pT is the discriminant used in the track-based isolation
criterion. For the reducible background estimation, muon candidates fulfilling all selection criteria except the isolation criterion are called “loose muons”.
Jets are reconstructed using the anti-ktalgorithm [59] with a radius parameter of 0.4 using energy clusters [60] of calorimeter cells as input. Jet calibrations [61] derived from
√
s= 13 TeV simulated data and from collision data taken at 13 TeV are used to correct the jet energies and directions to those of the particles from the hard-scatter interaction.
Hadronic decays of τ-leptons are composed of a neutrino and a set of visible decay products (τhad-vis),
typically one or three charged pions and up to two neutral pions. The reconstruction of τ-leptons and their visible hadronic decay products starts with jets reconstructed from topological clusters [62]. The τhad-vis
candidates must have |η| < 2.5 with the transition region between the barrel and endcap calorimeters (1.37 < |η| < 1.52) excluded, a transverse momentum greater than 65 GeV, one or three associated tracks with ±1 total electric charge. Their identification is performed using a multivariate algorithm that employs boosted decision trees (BDT) using shower shape and tracking information to discriminate against jets. All τhad-vis candidates are required to fulfill the “loose” identification requirements of Ref. [63]. An
additional dedicated likelihood-based veto is used to reduce the number of electrons misidentified as τhad-viscandidates. For the purpose of the reducible background estimation, τhad-viscandidates failing the
“loose” identification requirements are used.
Jets containing b-hadrons (b-jets) are identified with a b-tagging algorithm based on a multivariate technique [64]. Operating points are defined by a single value in the domain of discriminant outputs and are chosen to provide a specific b-jet efficiency in an inclusive t ¯t sample. The employed working point has an efficiency of 77% and rejection factors of 6 and 134 for charm and light-quark/gluon jets, respectively [64].
Only events with exactly two different-flavour leptons are chosen. As such, there is no overlap between the three channels considered: e µ, eτ, µτ. They must have a reconstructed primary vertex, defined as the vertex whose constituent tracks have the highest sum of p2T, and exactly two reconstructed different-flavor lepton candidates meeting the above-mentioned criteria. Events with an additional electron, muon or τhad-visare vetoed. For the e µ channel only, events with an extra electron or muon fulfilling the “loose” criteria are also vetoed, including events used for the purpose of the reducible background estimation. For all three channels, the lepton candidates must be back-to-back in the transverse plane with ∆φ(`, `0)> 2.7. The invariant mass of the dilepton pair is used as the discriminant. No requirement is made on the respective charges of the leptons since it reduces the signal efficiency by as much as 6% for the highest-mass signals considered due to charge misassignment without a significant effect on the background rejection. To account for differences between data and simulation, corrections are applied to the lepton trigger, reconstruction, identification, and isolation efficiencies as well as the lepton energy/momentum resolution and scale [56–58,63].
Double-counting of leptons and jets is avoided by applying an overlap removal algorithm based on the ∆R distance metric. First, jets within ∆R < 0.2 of any identified muons or electrons are removed. Then, any muons and electrons within 0.2 < ∆R < 0.4 from the jet axis are removed.
The missing transverse momentum vector (E®Tmiss) is defined as the negative vector sum of the transverse momenta of all identified physics objects and an additional soft term. The soft term is constructed from all tracks that are associated with the primary vertex, but not with any selected physics object. In this way, the missing transverse momentum incorporates the best calibration of the jets and the other identified physics objects, while maintaining pileup independence in the soft term [65].
The dominant background for the e µ channel is t ¯t production, which can be suppressed by rejecting events that contain one or more b-jets (b-veto).
For a Z0boson with a mass of 1.5 TeV, the fractions of events that pass all of the selection requirements are approximately 45%, 45%, 20%, and 15% for the e µ, e µ with b-veto, eτ, and µτ final states, respectively. For the reducible background estimation in the eτ and µτ channels, the transverse mass mT of a lepton
mT= q
2pTETmiss[1 − cos ∆φ(`, ETmiss)],
where pT is the transverse momentum of the lepton, ETmiss is the magnitude of the missing transverse
momentum vector, and ∆φ(`, ETmiss) is the azimuthal angle between the lepton and ®ETmissdirections. For the dilepton mass calculation in the eτ and µτ channels, the missing momentum from the neutrino in the hadronic decay of a τ-lepton is estimated and added to the four-momentum of the τhad-vis candidate.
At the considered momenta, the hadronic decay of the τ-lepton results in the neutrino and the resultant jet being nearly collinear. The neutrino four-momentum is reconstructed from the magnitude of the missing transverse momentum and the direction of the τhad-vis candidate. This technique significantly improves
the dilepton mass resolution and search sensitivity [7]. For a simulated Z0boson with a mass of 2 TeV, the mass resolution improves from 8% (17%) to 4% (12%) in the eτ (µτ) channel.
5 Background estimation
The background processes for this search can be divided into two categories: reducible and irreducible. The latter is composed of processes which produce two different-flavor prompt leptons, including Z /γ∗→ττ, t ¯t, single-top, and diboson production. These processes are modeled using simulated samples and normalized to their theoretically predicted cross-sections. Reducible backgrounds originate from jets mis-reconstructed as leptons and require the use of data-driven techniques. The contribution from reducible backgrounds is small in the e µ channel, about 5%, whereas in the eτ and µτ channels they are the leading components and make up 50−60% of the total background.
5.1 Top-quark background extrapolation
The simulated samples used to estimate single-top-quark and t ¯t production are statistically limited for dilepton invariant masses above 1 TeV. Therefore, for m``0 >700 GeV, the t¯t plus single-top contributions
are evaluated using monotonically decreasing functions fitted to the m``0 distribution. Two functional
forms are chosen for their stability when varying the fit range and for the quality of the fit:
a · mb``0· mc ·ln(m``0
)
``0 and
a (m``0+ b)c ,
where a, b and c are free parameters in the fit. To account for fit variations, the lower and upper limits of the fit range were varied in 25 GeV steps between 200−300 GeV and 1000−1200 (800−1000) GeV for eµ (eτ and µτ). The nominal extrapolation is taken as the average of all the tested fit ranges using both functional forms. The extrapolation is found to agree within statistical uncertainties with the simulated data. For each mass bin, the up and down variations obtained from varying the fit parameters are combined in quadrature with the uncertainty of the fit range variation. This uncertainty is 32% at 2 TeV for the e µ channel.
5.2 Reducible background
The main reducible backgrounds are W +jets and multi-jet production. The contribution to the reducible background from muons originating from decays of hadrons in jets is found to be negligible compared with the contribution from fake electrons and τ-leptons. Therefore, in the e µ channel, where reducible backgrounds are a small contribution to the total, non-prompt muons are neglected and only events with one prompt muon and a jet faking an electron are considered. In channels involving taus, however, reducible backgrounds are more significant, and so contributions from both electrons and muons, primarily non-prompt leptons from heavy flavor decays, are taken into account. However, the dominant source of reducible background in these channels remains fake taus from gluon-initiated jets.
5.2.1 eµ channel: matrix method
For the e µ channel, the matrix method is employed, as detailed in Ref. [21]. The selection criteria are loosened for electron candidates to create a sample of events with a muon and a “loose” electron as defined in Section4. These events are referred to as “loose”, while those in which both the electron and muon pass all selections are “tight”. The probability of a “loose” electron matched to a generated electron to pass the full object selection (the “real efficiency”) is evaluated from Z → ee simulated events, while the probability that a jet is misidentified as an electron (the “fake rate”) is obtained in a multijet-enriched data sample. To suppress the W +jets contribution to the multijet-enriched sample, its events are required to have ETmiss < 25 GeV and mT < 50 GeV as well as to pass the signal region selection outlined in
Section4. Both the real efficiency and the fake rate are determined as a function of pT, and they are used
to estimate the reducible background contribution by solving a system of linear equations involving the numbers of loose and tight events in the signal region. Residual contaminations from W+jets and other SM background processes (top, diboson, and Z → ``) in the multi-jet CR are subtracted using simulation. This background is estimated up to around 1.5 TeV, where there are no data. However, at this stage, the expectation of this background is well below one event, and generally negligible compared to diboson and top quark processes.
The uncertainties associated with the matrix method are evaluated by considering systematic effects on the electron fake rate. Uncertainties of the real electron efficiency have a negligible impact on the estimation and are not considered. The systematic uncertainties in the fake rate include
• the choice of multijet-enriched region,
• uncertainties on the MC subtraction in the multijet-enriched region, and
• the difference in the fake rates obtained using this method and those obtained from simulated W +jets events.
The overall uncertainty of the e µ reducible background is about 30%. Given that in the e µ channel this contribution is about 7% of the total background over the invariant mass range considered, the uncertainties in the estimation method have a small impact on the results.
5.2.2 eτ and µτ channels: W +jets estimate
The dominant background for the eτ and µτ channels is the W +jets process, where a jet is misidentified as a τhad-vis candidate. It is estimated using simulated events with each jet weighted by its probability
to pass the τ-lepton identification as measured in data. This not only ensures the correct fake rate but also improves the statistical precision of the estimate, since events failing the τ-lepton identification requirements are not discarded. The τhad-visfake rate is measured in a W → e/µ+jets control region as a
function of the pT, η, and number of tracks of the τhad-viscandidates. The W +jets-enriched control region
uses the same selection as the signal region, but reverses the back-to-back criterion to ∆φ(`, `0) < 2.7, and uses τ-leptons fulfilling all requirements except identification, although a minimum requirement on the BDT discriminant is retained. Only events with exactly one electron or muon fulfilling all selection criteria, as well as mT > 80 GeV to enrich the W+jets contribution, are used. Events where the invariant
mass of the e or µ and the τhad-viscandidate is between 80 and 110 GeV are vetoed to reduce contamination
from Z boson decays. Contributions from non-W +jets processes are subtracted using simulation. The τhad-viscandidates present in the remaining events are dominated by jets. The contribution of events with non-prompt electrons is estimated from simulation and found to be less than 1%. The τhad-visfake rate is
defined as the fraction of τhad-viscandidates in the sample that also pass the τhad-visidentification. This rate
is used to weight simulated W +jets events. The resulting distribution obtained for the W +jets is validated in the W +jets-enriched control region, where good agreement is found between data and the expected SM background processes.
The uncertainties in the τhad-visfake rate are evaluated from
• the modeling of the “loose” τhad-visidentification requirement in simulation,
• the statistical uncertainty of the data-driven estimation of the τ-lepton fake rate, and • the differences in τ-lepton fake rate between signal and control regions.
These errors are detailed in the following paragraphs.
The τhad-visfake rate is re-evaluated when removing the mT > 80 GeV requirement to check the
contam-ination from non-W +jets processes. The effect on the fake rate and the final estimation of the W +jets background is about 2%.
The statistical uncertainty of the fake rate in the control regions is propagated through the estimate. The impact is small at low m`τbut is the leading uncertainty of the fake rate in the range m`τ > 1 TeV.
The jet composition of the fake τhad-visbackground is evaluated from simulated W +jets events. The control
region where the τhad-visfake rate is evaluated should have a a jet composition similar to that in the signal
region. Therefore, W +jets simulated events are used to investigate the difference between the fake rates measured in the W +jets control and signal regions. The comparison reveals a slightly lower fake rate in the signal region, consistent with the lower expected gluon contribution. The relative difference between these fake rates is assigned as a systematic uncertainty, which contributes an uncertainty of about 8% to the total background at m`τ = 1 TeV.
5.2.3 eτ and µτ channels: multijet estimate
The multijet background contributions in the eτ and µτ channels are evaluated using events in three control regions (R1, R2, R3). The events must pass the selection for the signal region, except that in R1and R3the
electron/muon must fail isolation and the τhad-vis candidate must fail identification, and in R1 and R2 the
leptons must have the same electric charge and the electron/muon pT must be less than 200 GeVto avoid
signal contamination. For a Z0boson with a mass of 500 GeV, the lowest signal mass considered in this paper, the contamination from the signal processs in R2is found to be below 1%. The region definitions
are summarized in Table1. The background contribution is estimated as NMJ = NR3 × NR2/NR1. The
transfer factor NR2/NR1is calculated as a function of the dilepton mass to encapsulate correlations between
m`τ and the isolation and identification requirements, and it is fitted with a polynomial function. In each of the regions defined, the contributions from other SM processes, such as W +jets, Z +jets, Z /γ∗ →``, diboson, and top-quark production, are subtracted using simulation. The contribution from the multijet background is ∼60% (∼20%) of the W +jets background for the eτ (µτ) channel, corresponding to ∼25% (∼10%) of the total expected background.
Table 1: Definition of the regions used for the multijet background estimation in the eτ and µτ channels.
Object selection Lepton-pair charges
R1 Non-isolated e/µ & τhad-visfailing τ ID requirements (pT` & pTτ < 200 GeV) Same-charge R2 Isolated e/µ & pass ID τhad-vis(pT` & pTτ < 200 GeV) Same-charge
R3 Non-isolated e/µ & τhad-visfailing τ ID requirements Same-charge + Opposite-charge
The multijet background is estimated using a transfer factor obtained using same-charge lepton pairs and applied to opposite-charge plus same-charge lepton pairs. To check the validity of this procedure, the multijet background is also estimated using a transfer factor obtained with opposite-charge pairs. The difference between the resulting shape and transfer factors is assigned as a systematic uncertainty. The impact of this uncertainty is about 7% at 1 TeV.
The statistical uncertainties in the m`τ-dependent transfer factor and the subtraction of simulated events are propagated to the final estimate and assigned as a systematic uncertainty. The overall uncertainty is 50% (15%) at 1 TeV for the eτ (µτ) channel. The uncertainty in the µτ channel is smaller because the transfer factor is found to have a negligible effect on the dilepton invariant mass, and the transfer-factor fit uncertainties are reduced.
5.3 Reducible background validation
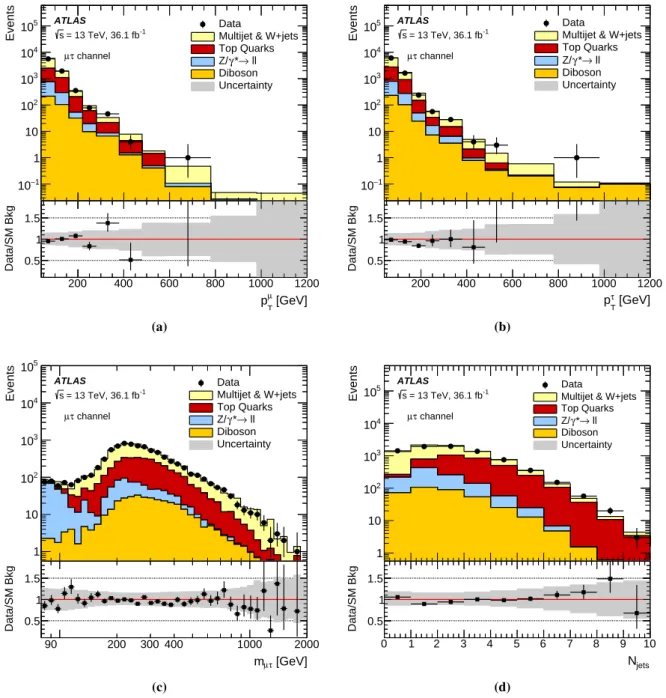
The validity of the background estimation is checked in the W +jets control region. Figures1and2show the electron, muon, and τ-lepton transverse momentum, `τ invariant mass and jet multiplicity distributions for the eτ and µτ channels, respectively, in the W +jets control region. Good agreement is observed between the data and the background prediction. The contribution from each SM background for each of the final states in the signal region is given in Section7.
200 400 600 800 1000 1200 [GeV] e T p 1 − 10 1 10 2 10 3 10 4 10 5 10 Events Data
Multijet & W+jets Top Quarks ll → * γ Z/ Diboson Uncertainty -1 = 13 TeV, 36.1 fb s ATLAS channel τ e 200 400 600 800 1000 1200 [GeV] e T p 0.5 1 1.5 Data/SM Bkg (a) 200 400 600 800 1000 1200 [GeV] τ T p 1 − 10 1 10 2 10 3 10 4 10 5 10 Events Data
Multijet & W+jets Top Quarks ll → * γ Z/ Diboson Uncertainty -1 = 13 TeV, 36.1 fb s ATLAS channel τ e 200 400 600 800 1000 1200 [GeV] τ T p 0.5 1 1.5 Data/SM Bkg (b) 2 10 103 [GeV] τ e m 1 10 2 10 3 10 4 10 5 10 Events Data
Multijet & W+jets Top Quarks ll → * γ Z/ Diboson Uncertainty -1 = 13 TeV, 36.1 fb s ATLAS channel τ e 90 200 300 400 1000 2000 [GeV] τ e m 0.5 1 1.5 Data/SM Bkg (c) 0 1 2 3 4 5 6 7 8 9 jets N 1 10 2 10 3 10 4 10 5 10 Events Data
Multijet & W+jets Top Quarks ll → * γ Z/ Diboson Uncertainty -1 = 13 TeV, 36.1 fb s ATLAS channel τ e 0 1 2 3 4 5 6 7 8 9 jets N 0.5 1 1.5 Data/SM Bkg (d)
Figure 1: Distributions in the W+jets-enriched control region for the eτ channel: (a) the electron and
(b) τ-lepton transverse momentum, (c) the eτ invariant mass, and (d) the jet multiplicity. No further data points are found in overflow bins.
200 400 600 800 1000 1200 [GeV] µ T p 1 − 10 1 10 2 10 3 10 4 10 5 10 Events Data
Multijet & W+jets Top Quarks ll → * γ Z/ Diboson Uncertainty -1 = 13 TeV, 36.1 fb s ATLAS channel τ µ 200 400 600 800 1000 1200 [GeV] µ T p 0.5 1 1.5 Data/SM Bkg (a) 200 400 600 800 1000 1200 [GeV] τ T p 1 − 10 1 10 2 10 3 10 4 10 5 10 Events Data
Multijet & W+jets Top Quarks ll → * γ Z/ Diboson Uncertainty -1 = 13 TeV, 36.1 fb s ATLAS channel τ µ 200 400 600 800 1000 1200 [GeV] τ T p 0.5 1 1.5 Data/SM Bkg (b) 2 10 103 [GeV] τ µ m 1 10 2 10 3 10 4 10 5 10 Events Data
Multijet & W+jets Top Quarks ll → * γ Z/ Diboson Uncertainty -1 = 13 TeV, 36.1 fb s ATLAS channel τ µ 90 200 300 400 1000 2000 [GeV] τ µ m 0.5 1 1.5 Data/SM Bkg (c) 0 1 2 3 4 5 6 7 8 9 10 jets N 1 10 2 10 3 10 4 10 5 10 Events Data
Multijet & W+jets Top Quarks ll → * γ Z/ Diboson Uncertainty -1 = 13 TeV, 36.1 fb s ATLAS channel τ µ 0 1 2 3 4 5 6 7 8 9 10 jets N 0.5 1 1.5 Data/SM Bkg (d)
Figure 2: Distributions in the W+jets-enriched control region for the µτ channel: (a) the muon and (b)
τ-lepton transverse momentum, (c) the µτ invariant mass, and (d) the jet multiplicity. No further data points are found in overflow bins.
6 Systematic uncertainties
The sources of experimental uncertainty considered are pileup effects; lepton efficiencies due to triggering, identification, reconstruction, isolation, energy scale, and resolution [56–58,63,66]; jet energy scale and resolution [61]; b-tagging [64]; and missing transverse momentum [65]. Sources of uncertainty are considered for both the simulated background and signal processes.
Mismodeling of the muon momentum resolution at the TeV scale from residual misalignment of the muon precision chambers can alter the signal and background shapes. A corresponding uncertainty is obtained from studies performed in dedicated data-taking periods with no magnetic field in the MS. The muon reconstruction efficiency is affected at high pT by possible large energy losses in the calorimeter. The
associated uncertainty is estimated by comparing studies of Z → µµ data events extrapolated to high pT
with the results predicted by simulation [67]. The effect on the muon reconstruction efficiency was found to be approximately 3% per TeV as a function of muon pT.
The uncertainty of the electron identification efficiency extrapolation is determined from the differences in the electron shower shapes in the EM calorimeters between data and simulation in the Z → ee peak, which are propagated to the high pTelectron sample. The effect on the electron identification efficiency
is 2% and is independent of pTfor electrons with transverse momentum above 150 GeV [67].
The treatment of systematic uncertainties for τ-leptons with pT up to 100 GeV is detailed in Ref. [62].
An additional uncertainty of 20% per TeV is assigned to the reconstruction efficiency of τ-leptons with pT > 100 GeV to account for the degradation of the modeling and reconstruction efficiency from track merging, derived from studies in simulation and in dijet data events at 8 TeV [68].
The missing transverse momentum uncertainty is derived from the uncertainties of the momenta of physics objects and uncertainties of the soft term determined by comparisons with simulation.
A mis-modeling of the dilepton pT variable is found in the t ¯t simulation. After reweighting to data in a t ¯t control region, an uncertainty is assigned to account for the effect on the dilepton invariant mass spectrum.
A pile-up modeling uncertainty is estimated by varying the distribution of pile-up events in the reweighting of the MC, to cover the uncertainty on the ratio between the predicted and measured inelastic cross-section in the fiducial volume defined by MX > 13 GeV where MX is the mass of the hadronic system [69]. The uncertainty of 2.1% in the luminosity applies to the signal and to backgrounds derived from simula-tions.
The uncertainties of the reducible background estimation in the e µ channel, and the τ-lepton fake rate, the multijet transfer factor calculation, and the top-quark extrapolation are presented in Section5. The PDF uncertainties are the dominant systematic uncertainties affecting the background estimates, together with the uncertainty on the extrapolation to estimate the top-quark background contribution at high mass. The contribution from PDF uncertainties is estimated using different PDF sets and eigenvector variations within a particular PDF set for the top-quark, diboson, and W +jets backgrounds. The CT10 PDF uncertainty due to eigenvector variations is evaluated through the use of LHAPDF [70] following the prescriptions of Ref. [71]. The uncertainty related to the choice of PDF is evaluated by comparing the results with those from the central value of other PDF sets: MMHT2014 [72], NNPDF3.0 [73], and CT14 [31]. PDF-related uncertainties in the signal shape are not considered. The uncertainties of the m``0
scale and hdamp parameter varied by factors of 2 and 1/2, and are referred to as“Top scale” in Table2.
These uncertainties for W+jets are not considered as they are found to be small, given that this background is mainly composed of real lepton (e or mu) and fake tau pairs. For the diboson background prediction, the PDF systematic is the leading uncertainty.
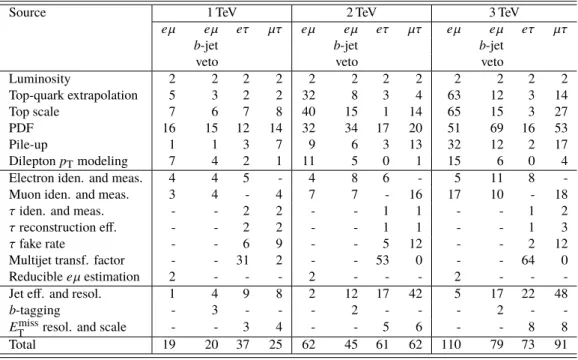
Experimental systematic uncertainties common to signal and background processes are assumed to be correlated. The systematic uncertainties of the estimated SM background and signal yields are summarized in Tables2and3. For signal processes, only experimental systematic uncertainties are considered. The simulated samples contribute a 3% statistical uncertainty to the overall signal acceptance times efficiency.
Table 2: Summary of the systematic uncertainties taken into account for background processes. Values
are provided for m``0 values of 1, 2 and 3 TeV. Uncertainties are quoted as a percentage of the
total background. The “-” sign indicates that the systematic uncertainty is not applicable.
Source 1 TeV 2 TeV 3 TeV
eµ eµ eτ µτ eµ eµ eτ µτ eµ eµ eτ µτ
b-jet b-jet b-jet
veto veto veto
Luminosity 2 2 2 2 2 2 2 2 2 2 2 2 Top-quark extrapolation 5 3 2 2 32 8 3 4 63 12 3 14 Top scale 7 6 7 8 40 15 1 14 65 15 3 27 PDF 16 15 12 14 32 34 17 20 51 69 16 53 Pile-up 1 1 3 7 9 6 3 13 32 12 2 17 Dilepton pTmodeling 7 4 2 1 11 5 0 1 15 6 0 4
Electron iden. and meas. 4 4 5 - 4 8 6 - 5 11 8
-Muon iden. and meas. 3 4 - 4 7 7 - 16 17 10 - 18
τ iden. and meas. - - 2 2 - - 1 1 - - 1 2
τ reconstruction eff. - - 2 2 - - 1 1 - - 1 3
τ fake rate - - 6 9 - - 5 12 - - 2 12
Multijet transf. factor - - 31 2 - - 53 0 - - 64 0
Reducible e µ estimation 2 - - - 2 - - - 2 - -
-Jet eff. and resol. 1 4 9 8 2 12 17 42 5 17 22 48
b-tagging - 3 - - - 2 - - - 2 -
-Emiss
T resol. and scale - - 3 4 - - 5 6 - - 8 8
Total 19 20 37 25 62 45 61 62 110 79 73 91
7 Results
Tables4–7show the expected and observed numbers of events in the low and high mass regions for each channel. The e µ background is dominated by t ¯t and diboson events, while W +jets events are dominant for the eτ and µτ final states.
Figure3shows the dilepton invariant mass distributions for the e µ, e µ with b-veto, eτ, and µτ channels. The largest deviation found in the data is a deficit in the 1.1–1.4 TeV range of the e µ channel, with a global significance of 1.8 standard deviations, obtained using the BumpHunter program [74]. Due to the parton luminosity tail in the LFV Z0model, the impact of the deficit in the 1.1–1.4 TeV range is also seen in the observed limit for Z0boson masses up to 4–5 TeV. No significant excess is found in any channel.
Table 3: Summary of the systematic uncertainties taken into account for signal processes. Values are
provided for m``0values of 1, 2 and 3 TeV. The “-” sign indicates that the systematic uncertainty
is not applicable.
Source 1 TeV 2 TeV 3 TeV
eµ eµ eτ µτ eµ eµ eτ µτ eµ eµ eτ µτ
b-jet b-jet b-jet
veto veto veto
Luminosity 2 2 2 2 2 2 2 2 2 2 2 2
Pile-up 1 1 4 3 3 3 4 3 2 2 3 4
Electron iden. and meas. 6 6 8 - 7 7 13 - 9 9 14
-Muon iden. and meas. 5 5 - 5 6 6 - 7 7 7 - 8
τ iden. and meas. - - 8 6 - - 10 8 - - 11 9
τ reconstruction eff. - - 2 2 - - 2 2 - - 3 3
Jet eff. and resol. 1 1 2 2 1 1 3 4 1 1 3 3
b-tagging - 1 - - - 1 - - - 1 -
-Emiss
T resol. and scale - 2 3 2 - - 2 2 - - 3 2
Total 8 8 13 9 10 10 17 12 12 12 19 14
Table 4: Expected and observed numbers of eµ events in the low (a) and high (b) mass regions after
applying all selection criteria. The statistical and systematic uncertainties are quoted. Process meµ< 300 GeV 300 < meµ< 600 GeV
Top 8460 ± 60 ± 860 2770 ± 30 ± 380 Diboson 1500 ± 20 ± 130 493 ± 9 ± 57 W +jets 550 ± 30 ± 190 214 ± 14 ± 75 Z/γ∗→`` 90 ± 6 ± 12 19.5 ± 1.6 ± 3.2 Total background 10600 ± 70 ± 980 3490 ± 40 ± 440 Data 10353 3417
(a) Neventswith meµ< 600 GeV
Process 600 < meµ< 1200 GeV 1200 < meµ< 2000 GeV
Top 140 ± 6 ± 27 4.6 ± 0.7 ± 2.7 Diboson 47.5 ± 1.2 ± 8.0 2.96 ± 0.31 ± 0.79 W +jets 24.1 ± 3.9 ± 8.4 0.1 ± 2.3 ± 0.0 Z/γ∗ →`` 1.31 ± 0.07 ± 0.27 0.07 ± 0.01 ± 0.02 Total background 213 ± 7 ± 37 7.7 ± 2.4 ± 2.8 Data 196 1
Process 2000 < meµ < 3000 GeV meµ> 3000 GeV
Top 0.28 ± 0.09 ± 0.32 (0.16 ± 0.08 ± 0.28) · 10−1 Diboson 0.25 ± 0.10 ± 0.11 (0.44 ± 0.01 ± 0.56) · 10−2 W +jets < 0.01 < 0.001 Z/γ∗→`` (0.48 ± 0.03 ± 0.23) · 10−2 (0.16 ± 0.02 ± 0.31) · 10−3 Total background 0.54 ± 0.13 ± 0.41 (0.21 ± 0.08 ± 0.30) · 10−1 Data 0 0
Table 5: Expected and observed numbers of eµ events in the low (a) and high (b) mass regions after
applying all selection criteria including the b-jet veto. The statistical and systematic uncertainties are quoted.
Process meµ< 300 GeV 300 < meµ < 600 GeV
Top 1660 ± 20 ± 260 570 ± 10 ± 100 Diboson 1470 ± 20 ± 130 479 ± 8 ± 55 W +jets 231 ± 18 ± 87 87 ± 8 ± 33 Z/γ∗→`` 86 ± 6 ± 12 18.4 ± 1.3 ± 3.0 Total background 3450 ± 30 ± 350 1150 ± 20 ± 150 Data 3411 1082
(a) Neventswith meµ< 600 GeV
Process 600 < meµ< 1200 GeV 1200 < meµ< 2000 GeV
Top 28.6 ± 1.7 ± 8.9 0.72 ± 0.10 ± 0.85 Diboson 45.9 ± 1.2 ± 7.7 2.85 ± 0.30 ± 0.76 W +jets 11.0 ± 2.8 ± 4.3 0.1 ± 1.9 ± 0.0 Z/γ∗→`` 1.27 ± 0.06 ± 0.25 (0.70 ± 0.05 ± 0.20) · 10−1 Total background 87 ± 3 ± 15 3.7 ± 2.0 ± 1.1 Data 83 0
Process 2000 < meµ < 3000 GeV meµ> 3000 GeV
Top (2.8 ± 0.8 ± 5.5) · 10−2 (0.8 ± 0.4 ± 2.3) · 10−3 Diboson 0.25 ± 0.10 ± 0.11 (0.42 ± 0.01 ± 0.51) · 10−2 W +jets < 0.001 < 0.001 Z/γ∗→`` (0.46 ± 0.03 ± 0.23) · 10−2 (0.14 ± 0.02 ± 0.30) · 10−3 Total background 0.28 ± 0.10 ± 0.14 (0.52 ± 0.04 ± 0.60) · 10−2 Data 0 0
(b) Neventswith meµ > 600 GeV
The electron–muon event with an invariant mass of 2.1 TeV found in the previous version of this analysis [5] no longer satisfies the event selection, since the previously selected muon candidate is found to overlap with a jet using the criteria of this paper and is no longer classified as a prompt muon.
Since no deviations from the SM prediction are observed, model-dependent exclusion limits are extracted using a Bayesian method implemented with the Bayesian analysis toolkit [75]. A binned likelihood function is constructed from the product of the Poisson probabilities of the observed and expected numbers of events in each m``0 mass bin as in Ref. [5]. A 95% credibility level (CL) Bayesian upper limit is placed on the
signal cross-section times branching ratio.
Expected exclusion limits are obtained by generating 1000 pseudo-experiments for each signal mass point. The median value of the pseudo-experiment distribution of the 95% CL Bayesian upper limit is taken as the expected limit. The one- and two-standard deviation intervals of the expected limit are obtained by finding the 68% and 95% intervals of the pseudo-experiment upper limit distribution, respectively. The invariant mass spectrum for each final state is analyzed in 60 bins from 120 GeV to 10 TeV. The bin width is around 7% of the dilepton mass throughout the whole range. The predicted width of the Z0boson, 3% for mZ0 = 2 TeV, is smaller than the detector resolutions for the eµ and the µτ channels, which are
3 10 [GeV] µ e m 1 3 10 6 10 Events Data Top Quarks Diboson Multijet & W+jets
ll → * γ Z/ LFV Z' 1.5 TeV 1.5 TeV τ ν∼ RPV QBH RS 1.5 TeV Uncertainty -1 = 13 TeV, 36.1 fb s ATLAS channel µ e 200 300 400 1000 2000 [GeV] µ e m 0.5 1 1.5 Data/SM Bkg (a) 3 10 [GeV] µ e m 1 3 10 6 10 Events Data Top Quarks Diboson Multijet & W+jets
ll → * γ Z/ LFV Z' 1.5 TeV 1.5 TeV τ ν∼ RPV QBH RS 1.5 TeV Uncertainty -1 = 13 TeV, 36.1 fb s ATLAS channel (b-veto) µ e 200 300 400 1000 2000 [GeV] µ e m 0.5 1 1.5 Data/SM Bkg (b) 3 10 [GeV] τ e m 1 3 10 6 10 Events Data Multijet & W+jets Top Quarks ll → * γ Z/ Diboson LFV Z' 1.5 TeV 1.5 TeV τ ν∼ RPV QBH RS 1.5 TeV Uncertainty -1 = 13 TeV, 36.1 fb s ATLAS channel τ e 200 300 400 1000 2000 [GeV] τ e m 0.5 1 1.5 Data/SM Bkg (c) 3 10 [GeV] τ µ m 1 3 10 6 10 Events Data
Multijet & W+jets Top Quarks ll → * γ Z/ Diboson LFV Z' 1.5 TeV 1.5 TeV τ ν∼ RPV QBH RS 1.5 TeV Uncertainty -1 = 13 TeV, 36.1 fb s ATLAS channel τ µ 200 300 400 1000 2000 [GeV] τ µ m 0.5 1 1.5 Data/SM Bkg (d)
Figure 3: The invariant mass distribution of (a) eµ, (b) eµ with b-veto, (c) eτ, and (d) µτ pairs for data
and the SM predictions. Three signal examples are overlaid: a Z0boson with a mass of 1.5 TeV, a τ-sneutrino ( ˜ντ) with a mass of 1.5 TeV, and a RS quantum black-hole (QBH) with a threshold mass of 1.5 TeV. The range is chosen such that all data points are visible. The error bars show the Poissonian statistical uncertainty of the observed yields, while the band in the bottom plot includes all systematic uncertainties combined in quadrature. No further data points are found in overflow bins.
Table 6: Expected and observed numbers of eτ events in the low (a) and high (b) mass regions after
applying all selection criteria. The statistical and systematic uncertainties are quoted. Process meτ < 300 GeV 300 < meτ< 600 GeV
Top 2020 ± 30 ± 390 1800 ± 30 ± 370
Diboson 465 ± 10 ± 77 330 ± 8 ± 58
Multijet and W +jets 13200 ± 200 ± 2900 3100 ± 70 ± 870 Z/γ∗→``
3300 ± 60 ± 500 610 ± 20 ± 130 Total background 19000 ± 200 ± 3300 5800 ± 100 ± 1100
Data 19532 5858
(a) Neventswith meτ < 600 GeV
Process 600 < meτ < 1200 GeV 1200 < meτ < 2000 GeV
Top 161 ± 2 ± 53 4.6 ± 0.4 ± 2.2
Diboson 48 ± 2 ± 11 4.7 ± 0.8 ± 1.7
Multijet and W +jets 300 ± 20 ± 140 24 ± 2 ± 16 Z/γ∗→``
25.6 ± 0.6 ± 6.0 1.30 ± 0.04 ± 0.42 Total background 540 ± 20 ± 160 34 ± 2 ± 17
Data 480 24
Process 2000 < meτ < 3000 GeV meτ > 3000 GeV
Top 0.13 ± 0.04 ± 0.10 (0.20 ± 0.10 ± 0.32) · 10−2 Diboson 0.41 ± 0.16 ± 0.21 (0.35 ± 0.04 ± 0.39) · 10−2 Multijet and W +jets 2.4 ± 0.3 ± 2.0 0.30 ± 0.14 ± 0.19 Z/γ∗→``
0.09 ± 0.02 ± 0.04 (0.34 ± 0.01 ± 0.39) · 10−2 Total background 3.1 ± 0.4 ± 2.1 0.31 ± 0.15 ± 0.23
Data 5 0
(b) Neventswith meτ> 600 GeV
resolution is 4% at mZ0 = 2 TeV, comparable to the Z0boson width. The width of the ˜ντ is below 1%,
and hence the resolution of the detector is larger than the width for each of the final states investigated. Figures4–6show the observed and expected 95% CL upper limits on the production cross-section times branching ratio of the Z0, RPV SUSY ˜ντ and QBH models for each of the final states considered. The extracted limits are not as strong for signal masses above about 2.5 TeV due to a decrease in acceptance at very high pTand, specifically to the LFV Z
0
model, low-mass signal production due to PDF suppression. The results are summarized in Table8. The acceptance times efficiency of the ADD and RS QBH models agree within 1%, and the same prediction is used for the limit extraction.
Results expressed in terms of the coupling limts can be directly compared to those obtained from precision low energy experiments [76]. For the Z0 model the cross-section times branching ratio is proportional to Q2``0, and the same quark couplings as the SM Z boson are used. The limits on Q``0 are shown in
Figure7as a function of mZ0for the three channels. The most stringent coupling limits from low-energy
experiments are from µ-to-e conversion and µ → eee for the e µ channel, from τ → eee and τ → e µµ for the eτ channel, and from τ → µµµ and τ → e µµ for the µτ channel. The current experimental limits on these processes are converted to coupling limits using the formulae of Ref. [77] and are shown in Figure7. For the eτ and µτ channels, the observed limit is restricted up to the Z0mass point of 4 TeV. This because for the higher mass points, the limit on Q``0becomes sufficiently large that the total width of the Z0would
Table 7: Expected and observed numbers of µτ events in the low (a) and high (b) mass regions after
applying all selection criteria. The statistical and systematic uncertainties are quoted. Process mµτ < 300 GeV 300 < mµτ < 600 GeV
Top 1380 ± 20 ± 300 1160 ± 20 ± 250
Diboson 318 ± 8 ± 55 225 ± 6 ± 42
Multijet and W +jets 6900 ± 200 ± 1400 1650 ± 50 ± 380 Z/γ∗→``
1650 ± 40 ± 270 339 ± 14 ± 71 Total background 10300 ± 200 ± 1700 3380 ± 60 ± 550
Data 10525 3378
(a) Neventswith mµτ < 600 GeV
Process 600 < mµτ < 1200 GeV 1200 < mµτ < 2000 GeV
Top 95 ± 1 ± 26 3.5 ± 0.2 ± 2.7
Diboson 33.3 ± 1.7 ± 9.2 2.9 ± 0.5 ± 1.5
Multijet and W +jets 140 ± 10 ± 43 6.4 ± 1.0 ± 2.4 Z/γ∗→``
14.4 ± 1.2 ± 4.3 0.88 ± 0.07 ± 0.32 Total background 282 ± 10 ± 61 13.7 ± 1.1 ± 5.0
Data 255 12
Process 2000 < mµτ< 3000 GeV mµτ> 3000 GeV
Top 0.17 ± 0.03 ± 0.21 (0.56 ± 0.19 ± 0.94) · 10−2 Diboson 0.54 ± 0.30 ± 0.38 (0.62 ± 0.09 ± 0.95) · 10−2 Multijet and W +jets 0.87 ± 0.35 ± 0.89 (0.87 ± 0.70 ± 0.60) · 10−2 Z/γ∗→``
(0.78 ± 0.03 ± 0.42) · 10−1 (0.63 ± 0.04 ± 0.84) · 10−2 Total background 1.65 ± 0.46 ± 1.30 (0.27 ± 0.07 ± 0.33) · 10−1
Data 2 0
(b) Neventswith mµτ > 600 GeV
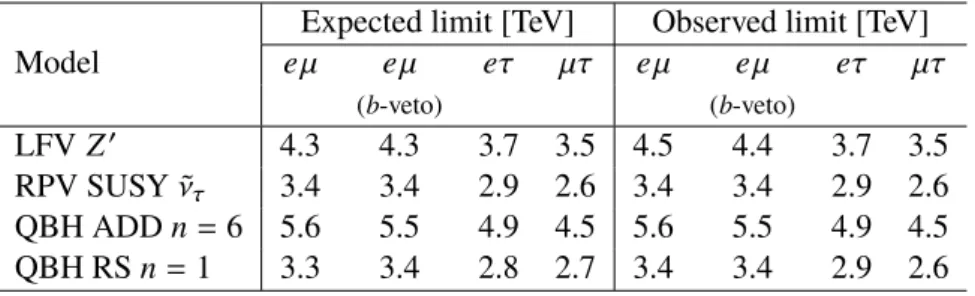
Table 8: Expected and observed 95% credibility-level lower limits on the mass of a Z0boson with lepton-flavor-violating couplings, a supersymmetric τ-sneutrino ( ˜ντ) with R-parity-violating couplings, and the threshold mass for quantum black-hole production for the ADD n = 6 and RS n = 1 models.
Model
Expected limit [TeV] Observed limit [TeV]
eµ eµ eτ µτ eµ eµ eτ µτ
(b-veto) (b-veto)
LFV Z0 4.3 4.3 3.7 3.5 4.5 4.4 3.7 3.5
RPV SUSY ˜ντ 3.4 3.4 2.9 2.6 3.4 3.4 2.9 2.6 QBH ADD n = 6 5.6 5.5 4.9 4.5 5.6 5.5 4.9 4.5
[TeV] Z' m 0.5 1 1.5 2 2.5 3 3.5 4 4.5 5 B [pb] σ 5 − 10 4 − 10 3 − 10 2 − 10
Exp 95% CL with b-veto
σ 1 ± Expected σ 2 ± Expected
Exp 95% CL without b-veto Obs 95% CL with b-veto Obs 95% CL without b-veto LFV Z' ATLAS µ e → LFV Z' -1 = 13 TeV, 36.1 fb s (a) [TeV] τ ν∼ m 0.5 1 1.5 2 2.5 3 3.5 4 4.5 5 B [pb] σ 5 − 10 4 − 10 3 − 10 2 − 10
Exp 95% CL with b-veto
σ 1 ± Expected σ 2 ± Expected
Exp 95% CL without b-veto Obs 95% CL with b-veto Obs 95% CL without b-veto
τ ν∼ RPV ATLAS µ e → τ ν∼ -1 = 13 TeV, 36.1 fb s =0.07 321 λ = 312 λ =0.11, 311 ' λ (b) [TeV] th m 1 1.5 2 2.5 3 3.5 4 4.5 5 5.5 6 B [pb] σ 6 − 10 5 − 10 4 − 10 3 − 10 2 − 10 1 − 10
Exp 95% CL with b-veto
σ 1 ± Expected σ 2 ± Expected
Exp 95% CL without b-veto Obs 95% CL with b-veto Obs 95% CL without b-veto QBH ADD n=6 QBH RS n=1 ATLAS µ e → QBH -1 = 13 TeV, 36.1 fb s (c)
Figure 4: The observed and expected 95% credibility-level upper limits on the (a) Z0 boson, (b) τ-sneutrino ( ˜ντ), and (c) QBH ADD and RS production cross-section times branching ratio for decays into an e µ final state with and without the b-veto requirement. The signal theoretical cross-section times branching ratio lines for the Z0model, the QBH ADD model assuming six extra dimensions, and the RS model with one extra dimension are obtained from the simulation of each process, while the RPV SUSY ˜ντincludes the NLO K-factor calculated using LoopTools [33]. The acceptance times efficiency of the ADD and RS QBH models agree within 1%, and the same curve is used for limit extraction. The expected limits are shown with the ±1 and ±2 standard deviation uncertainty bands on the results with the b-veto requirement.
[TeV] Z' m 0.5 1 1.5 2 2.5 3 3.5 4 4.5 5 B [pb] σ 5 − 10 4 − 10 3 − 10 2 − 10 1 − 10 Expected 95% CL σ 1 ± Expected σ 2 ± Expected Observed 95% CL LFV Z' ATLAS τ e → LFV Z' -1 = 13 TeV, 36.1 fb s (a) [TeV] τ ν∼ m 0.5 1 1.5 2 2.5 3 3.5 4 4.5 5 B [pb] σ 5 − 10 4 − 10 3 − 10 2 − 10 1 − 10 Expected 95% CL σ 1 ± Expected σ 2 ± Expected Observed 95% CL τ ν∼ RPV ATLAS τ e → τ ν∼ -1 = 13 TeV, 36.1 fb s =0.07 331 λ = 313 λ =0.11, 311 ' λ (b) [TeV] th m 1 1.5 2 2.5 3 3.5 4 4.5 5 5.5 6 B [pb] σ 5 − 10 4 − 10 3 − 10 2 − 10 1 − 10 1 Expected 95% CL σ 1 ± Expected σ 2 ± Expected Observed 95% CL QBH ADD n=6 QBH RS n=1 ATLAS τ e → QBH -1 = 13 TeV, 36.1 fb s (c)
Figure 5: The observed and expected 95% credibility-level upper limits on the (a) Z0 boson, (b) τ-sneutrino ( ˜ντ), and (c) QBH ADD and RS production cross-section times branching ratio for decays into an eτ final state. The signal theoretical cross-section times branching ratio lines for the Z0model, the QBH ADD model assuming six extra dimensions, and the RS model with one extra dimension are obtained from the simulation of each process, while the RPV SUSY ˜ντ
includes the NLO K-factor calculated using LoopTools [33]. The acceptance times efficiency of the ADD and RS QBH models agree within 1%, and the same curve is used for limit extraction. The expected limits are shown with the ±1 and ±2 standard deviation uncertainty bands.
[TeV] Z' m 0.5 1 1.5 2 2.5 3 3.5 4 4.5 5 B [pb] σ 5 − 10 4 − 10 3 − 10 2 − 10 1 − 10 Expected 95% CL σ 1 ± Expected σ 2 ± Expected Observed 95% CL LFV Z' ATLAS τ µ → LFV Z' -1 = 13 TeV, 36.1 fb s (a) [TeV] τ ν∼ m 0.5 1 1.5 2 2.5 3 3.5 4 4.5 5 B [pb] σ 5 − 10 4 − 10 3 − 10 2 − 10 1 − 10 Expected 95% CL σ 1 ± Expected σ 2 ± Expected Observed 95% CL τ ν∼ RPV ATLAS τ µ → τ ν∼ -1 = 13 TeV, 36.1 fb s =0.07 332 λ = 323 λ =0.11, 311 ' λ (b) [TeV] th m 1 1.5 2 2.5 3 3.5 4 4.5 5 5.5 6 B [pb] σ 5 − 10 4 − 10 3 − 10 2 − 10 1 − 10 1 Expected 95% CL σ 1 ± Expected σ 2 ± Expected Observed 95% CL QBH ADD n=6 QBH RS n=1 ATLAS τ µ → QBH -1 = 13 TeV, 36.1 fb s (c)
Figure 6: The observed and expected 95% credibility-level upper limits on the (a) Z0 boson, (b) τ-sneutrino ( ˜ντ), and (c) QBH ADD and RS production cross-section times branching ratio for decays into an µτ final state. The signal theoretical cross-section times branching ratio lines for the Z0model, the QBH ADD model assuming six extra dimensions, and the RS model with one extra dimension are obtained from the simulation of each process, while the RPV SUSY ˜ντ
includes the NLO K-factor calculated using LoopTools [33]. The acceptance times efficiency of the ADD and RS QBH models agree within 1%, and the same curve is used for limit extraction. The expected limits are shown with the ±1 and ±2 standard deviation uncertainty bands.
channel, the coupling limits in this paper do not compete with those from low-energy experiments, but for the eτ and µτ channels, the coupling limits in this paper are more stringent, though they require additional assumptions on the quark couplings.
For the ˜ντmodel, the dependence on the couplings is more complicated because both the production and the decay violate lepton-flavor conservation. Assuming only the d ¯d and ``0couplings, the cross-section times branching ratios are proportional to the Yukawa couplings |λ3110 λ3i j|2/(3|λ
0 311|
2+ 2|λ
3i j|2), where
i j = 12, 13, and 23 for the eµ, eτ, and µτ channels, respectively. The factor 3 in the denominator accounts for color and the factor 2 is because both final-state charge combinations are allowed (`±`0∓). The limits on |λ3i j0 | versus |λ311| are shown in Figure8for ˜ντ masses of 1 TeV, 2 TeV, and 3 TeV. The most stringent
coupling limits set by low-energy experiments derive from µ-to-e conversion for the e µ channel, from τ → eη for the eτ channel, and from τ → µη for the µτ channel. The coupling limits in Ref. [3] are scaled to current experimental limits on these processes [78] and are shown in Figure8. For the e µ channel, the coupling limits in this paper do not compete with those from low-energy experiments, but for eτ and µτ channels, the coupling limits in this paper are more stringent.
[TeV] Z' m 0 1 2 3 4 5 µ e Q -5 10 -4 10 -3 10 -2 10 -1 10 1 Observed limit -to-e conversion µ γ e → µ eee → µ ATLAS -1 = 13 TeV, 36.1 fb s µ e → LFV Z' (a) [TeV] Z' m 0 1 2 3 4 5 µ e Q -5 10 -4 10 -3 10 -2 10 -1 10 1 Observed limit -to-e conversion µ γ e → µ eee → µ ATLAS -1 = 13 TeV, 36.1 fb s , b-veto µ e → LFV Z' (b) [TeV] Z' m 0 1 2 3 4 5 τ e Q -3 10 -2 10 -1 10 1 10 2 10 Observed limit µ µ e → τ eee → τ γ e → τ ATLAS -1 = 13 TeV, 36.1 fb s τ e → LFV Z' (c) [TeV] Z' m 0 1 2 3 4 5 τµ Q -3 10 -2 10 -1 10 1 10 2 10 Observed limit ee µ → τ µ µ µ → τ γ µ → τ ATLAS -1 = 13 TeV, 36.1 fb s τ µ → LFV Z' (d)
Figure 7: The 95% credibility-level upper limits on the couplings (a) Qeµ, (b) Qeµwith a b-veto, (c) Qeτ, and (d) Qµτ as a function of mZ0 from the cross-section times branching ratio limits in this
| 311 ' λ | -3 10 10-2 10-1 | 312 λ | -3 10 -2 10 -1 10 = 3 TeV ν∼ Observed limit, m = 2 TeV ν∼ Observed limit, m = 1 TeV ν∼ Observed limit, m = 3 TeV ν∼ -to-e conversion, m µ = 2 TeV ν∼ -to-e conversion, m µ = 1 TeV ν∼ -to-e conversion, m µ ATLAS -1 = 13 TeV, 36.1 fb s µ e → τ ν∼ (a) | 311 ' λ | -3 10 10-2 10-1 | 312 λ | -3 10 -2 10 -1 10 = 3 TeV ν∼ Observed limit, m = 2 TeV ν∼ Observed limit, m = 1 TeV ν∼ Observed limit, m = 3 TeV ν∼ -to-e conversion, m µ = 2 TeV ν∼ -to-e conversion, m µ = 1 TeV ν∼ -to-e conversion, m µ ATLAS -1 = 13 TeV, 36.1 fb s , b-veto µ e → τ ν∼ (b) | 311 ' λ | -3 10 10-2 10-1 | 313 λ | -3 10 -2 10 -1 10 = 3 TeV ν∼ Observed limit, m = 2 TeV ν∼ Observed limit, m = 1 TeV ν∼ Observed limit, m = 3 TeV ν∼ , m η e → τ = 2 TeV ν∼ , m η e → τ = 1 TeV ν∼ , m η e → τ ATLAS -1 = 13 TeV, 36.1 fb s τ e → τ ν∼ (c) | 311 ' λ | -3 10 10-2 10-1 | 323 λ | -3 10 -2 10 -1 10 = 3 TeV ν∼ Observed limit, m = 2 TeV ν∼ Observed limit, m = 1 TeV ν∼ Observed limit, m = 3 TeV ν∼ , m η µ → τ = 2 TeV ν∼ , m η µ → τ = 1 TeV ν∼ , m η µ → τ ATLAS -1 = 13 TeV, 36.1 fb s τ µ → τ ν∼ (d)
Figure 8: The 95% credibility-level upper limits on the RPV couplings (a) |λ312|, (b) |λ312| with a
b-veto, (c) |λ313|, and (d) |λ323| versus |λ 0
311| for a few values of mν˜ from the cross-section
times branching ratio limits in this paper (solid, dot-dashed, and dotted lines) and from low-energy experiments (short-dashed, medium-dashed, and long-dashed lines). For the eτ and µτ channels, the low energy limits for the 2 TeV and 3 TeV mass points are outside the frame, beyond the upper-right corner.
8 Conclusions
A search for a heavy particle decaying into an e µ, eτ, or µτ final state is conducted using 36.1 fb−1 of proton–proton collision data at
√
s = 13 TeV recorded by the ATLAS detector at the Large Hadron Collider. The Standard Model predictions are consistent with the data. From the e µ, eτ, and µτ final states, Bayesian lower limits at 95% credibility level are set on the mass of a Z0vector boson with lepton-flavor-violating couplings at 4.5, 3.7, and 3.5 TeV, respectively; on the mass of a supersymmetric τ-sneutrino with R-parity-violating couplings at 3.4, 2.9, and 2.6 TeV; and on the threshold mass for quantum black-hole production in the context of the Arkani-Hamed–Dimopoulos–Dvali (Randall–Sundrum) model at 5.6 (3.4), 4.9 (2.9), and 4.5 (2.6) TeV. The quantum black hole limits extracted are below those extracted in dijet searches, since the branching ratio to dijet is expected to be much larger than to dilepton. Coupling limits for the lepton-flavor-violating Z0boson and ˜ν models are more stringent than those from low-energy experiments for the eτ and µτ modes.
Acknowledgements
We thank CERN for the very successful operation of the LHC, as well as the support staff from our institutions without whom ATLAS could not be operated efficiently.
We acknowledge the support of ANPCyT, Argentina; YerPhI, Armenia; ARC, Australia; BMWFW and FWF, Austria; ANAS, Azerbaijan; SSTC, Belarus; CNPq and FAPESP, Brazil; NSERC, NRC and CFI, Canada; CERN; CONICYT, Chile; CAS, MOST and NSFC, China; COLCIENCIAS, Colombia; MSMT CR, MPO CR and VSC CR, Czech Republic; DNRF and DNSRC, Denmark; IN2P3-CNRS, CEA-DRF/IRFU, France; SRNSFG, Georgia; BMBF, HGF, and MPG, Germany; GSRT, Greece; RGC, Hong Kong SAR, China; ISF, I-CORE and Benoziyo Center, Israel; INFN, Italy; MEXT and JSPS, Japan; CNRST, Morocco; NWO, Netherlands; RCN, Norway; MNiSW and NCN, Poland; FCT, Portugal; MNE/IFA, Romania; MES of Russia and NRC KI, Russian Federation; JINR; MESTD, Serbia; MSSR, Slovakia; ARRS and MIZŠ, Slovenia; DST/NRF, South Africa; MINECO, Spain; SRC and Wallenberg Foundation, Sweden; SERI, SNSF and Cantons of Bern and Geneva, Switzerland; MOST, Taiwan; TAEK, Turkey; STFC, United Kingdom; DOE and NSF, United States of America. In addition, individual groups and members have received support from BCKDF, the Canada Council, CANARIE, CRC, Compute Canada, FQRNT, and the Ontario Innovation Trust, Canada; EPLANET, ERC, ERDF, FP7, Horizon 2020 and Marie Skłodowska-Curie Actions, European Union; Investissements d’Avenir Labex and Idex, ANR, Région Auvergne and Fondation Partager le Savoir, France; DFG and AvH Foundation, Germany; Herakleitos, Thales and Aristeia programmes co-financed by EU-ESF and the Greek NSRF; BSF, GIF and Minerva, Israel; BRF, Norway; CERCA Programme Generalitat de Catalunya, Generalitat Valenciana, Spain; the Royal Society and Leverhulme Trust, United Kingdom.
The crucial computing support from all WLCG partners is acknowledged gratefully, in particular from CERN, the ATLAS Tier-1 facilities at TRIUMF (Canada), NDGF (Denmark, Norway, Sweden), CC-IN2P3 (France), KIT/GridKA (Germany), INFN-CNAF (Italy), NL-T1 (Netherlands), PIC (Spain), ASGC (Taiwan), RAL (UK) and BNL (USA), the Tier-2 facilities worldwide and large non-WLCG resource providers. Major contributors of computing resources are listed in Ref. [79].