F
ACULDADE DEE
NGENHARIA DAU
NIVERSIDADE DOP
ORTOEnvironmental Monitoring Services
based on Wireless Sensor Networks
Carlos Eduardo Azevedo Oliveira
Thesis submitted under the course of:
Integrated Master In Electrical and Computer Engineering Major in Automation
Tutor: Gil Gonçalves (Eng.)
c
Resumo
Actualmente é evidente a dependência da sociedade moderna nas tecnologias de informação baseadas em sistemas computacionais, capazes de agregar e manipular enormes quantidades de formação. Associado ao aparecimento das tecnologias sem fios, à miniaturização dos circuitos in-tegrados e a ao aumento da sua eficiência energética, surgiu uma nova área de estudos denominada comummente por: Wireless Sensor Networks. As “WSNs” resultam da junção de conhecimentos das áreas de Ciências de Computação e da Electrónica, que possibilitam o desenvolvimento de plataformas capazes de recolher dados de determinadas variáveis, de forma distribuída.
São vastos os campos de aplicação das tecnologias baseadas em redes de sensores sem fios, dadas as vantagens destas soluções quando comparadas com plataformas que recorrem a redes ligadas por cabos. Estas redes são normalmente estabelecidas utilizando pequenos dispositivos, alimentados por baterias, que recolhem informação no espaço que os rodeia. Dado o interesse nestas tecnologias, surgiram especificações e standards, tais como o ZigBee e o IEEE802.15.4 que definem os canais de comunicação e permitem interoperabilidade entre diferentes plataformas.
Estas novas plataformas vieram juntar-se a tecnologias wireless já bem estabelecidas, que estão presentes no quotidiano. O Bluetooth é um exemplo de uma dessas tecnologias. O seu uso tornou-se vulgar, tanto para fins pessoais como nos locais de trabalho. A expansão do número de dispositivos capazes de estabelecer redes sem fios é um acontecimento inevitável dado o aumento das taxas de transmissão, da fiabilidade deste tipo de comunicação de dados e da aceitação geral por parte do consumidor.
Esta dissertação documenta o desenvolvimento de uma plataforma baseada numa rede de sen-sores sem fios, capaz de recolher e publicar online dados ambientais. Um dos objectivos principais deste trabalho é o desenvolvimento de uma aplicação, capaz de integrar os dados recolhidos com ferramentas de geo-referenciação disponíveis publicamente. Tal é feito respeitando os standards abertos existentes. É utilizada uma abordagem incremental para demonstrar os vários passos uti-lizados na construção do sistema, e como foram resolvidas as várias dificuldades encontradas.
Este sistema é de seguida utilizado num caso de estudo. Nesta experiência as aplicações desenvolvidas são utilizadas para fins concretos no estudo da influência de diferentes materiais de construção no conforto térmico em espaços públicos.
Esta dissertação mostra que as redes de sensores sem fios se adaptam particularmente bem em aplicações que requerem uma recolha de dados espacialmente distribuída. Variações mi-cro climáticas podem ser parametrizadas utilizando as ferramentas desenvolvidas. A integração dos dados recolhidos com sua localização geográfica possibilita uma percepção aprofundada da possível correlação entre a evolução das grandezas medidas e as características espaciais locais. Este estudo demonstra também que existem ainda limitações relacionadas com a qualidade das conexões entre nós e nos algoritmos responsáveis pelo estabelecimento rotas. A performance das aplicações desenvolvidas é também analisada por forma a demonstrar esta afirmação.
É possível estender o sistema desenvolvido para outras aplicações de monitorização. Um ex-emplo é a possível integração de sensores para monitorização dos níveis de poluição sonora, ou
ii
mesmo da qualidade do ar, adicionando sensores de qualidade do ar e microfones. A monitoriza-ção do consumo energético de edifícios, bem como uma estimamonitoriza-ção da sua eficiência energética pode também ser conseguida expandindo algumas das funcionalidades do sistema desenvolvido.
Abstract
It is nowadays notorious the dependence of modern society in computer systems, able to ag-gregate and manipulate tremendous amounts of information. In the last decades, associated to the surge of the new wireless technologies, to the increased miniaturization and energy efficiency of integrated circuits, a new study subject emerged: Wireless Sensor Networks. WSNs join knowl-edge from several fields of science, like Computer Science and Electronics, to enable platforms that can be used to distributively sense specific variables.
The fields of application of WSN technologies are immense due to several advantages over common wired sensing networks. Standards and specifications like the IEEE802.15.4 and ZigBee emerged, that specify the communication channels and allow interoperability between different hardware. These networks are usually established with small battery powered devices , that collect data in their surrounding environment.
These new platforms join already well established applications in the field of wireless per-sonal area networks, that are today present in people’s lives. Bluetooth serves as an example; this technology is today seamlessly used in working and home environments. The penetration of de-vices capable of establishing wireless networks is bound to increase due to its massive acceptance, increasing data transmission rates and reliability.
The result of this work is a complete platform, based on a wireless sensor network, able to gather environmental data and providing it online through a set of services. One of the main purposes of the research subject is to develop a system, complying with applicable open standards that allows easy integration of data gathered at the wireless network level with current publicly available geo-location tools. A step by step documentation of the system is used, in order to demonstrate its build steps and the methodologies used in order to circumvent the difficulties found. This research is supported by a case study, where the system is used for real life purposes in the study of construction materials and their influence on thermal comfort zones.
This study shows that wireless sensor networks are particularly well suited for gathering envi-ronmental data in a spatial distributed context. Small micro-climatic changes can be parametrized using the developed tools. Integrating the evolution of different measurable variables with its geo-graphic location enables a deeper understanding of how the location characteristics influence such variation. This research will also show that there are still issues pertaining link quality, and rout-ing algorithms when usrout-ing WSNs. The developed application performance is analysed in order to backup such statements.
It is possible to extend this system for other monitoring appliances. Further research could be made to extend this application for pollution monitoring, by adding air quality sensors and also noise sensors. Monitoring the buildings energy consumption, and estimating their thermal efficiency could also be achieved by extending the developed framework.
Acknowledgments
I would like to thank all the valuable insights, recommendations and support given to this study by a number of people and research groups. Professor Gil Gonçalves provided valuable feedback during all stages of this research, which greatly improved the overall research outcomes.
Several recommendations provided by members of the USTL group made it possible to de-velop this work taking into consideration interoperability questions and issues with existent solu-tions. Also some very useful and valuable advices were given towards the use of specific solusolu-tions. I would like to thank in particular José Pinto for his “crash course” on some of the tools and soft-ware libraries used, and also for his advices on the viability of some of the employed algorithms. I should also mention Eng. Alexandre Sousa for his practical advices on the build and assembly of the used hardware platforms.
During this study, the support and encouragement of friends and family, made it possible to withstand the occasional changes in ones social routine. Their presence and care often reminded me of life’s true priorities.
The results from this research were positively benefited from the aforementioned supports. Any error or omission present in the resultant work is of the author’s responsibility.
Carlos Eduardo A. Oliveira
“Good ideas are not adopted automatically. They must be driven into practice with courageous patience.”
Hyman George Rickover
Contents
1 Introduction 1
1.1 Research Objectives . . . 3
1.2 Scope and Limitation of the Research . . . 3
1.3 Document Overview . . . 4
2 Analysis of Relevant Literature and Related Projects 5 2.1 Overview Of Wireless Sensor Networks . . . 5
2.1.1 Routing Schemes . . . 7
2.1.2 Hardware Platforms . . . 9
2.1.3 Operating Systems . . . 9
2.1.4 Applicable Standards . . . 10
2.2 Related Projects . . . 11
3 System Analysis and Development 13 3.1 Methodology and Development Model . . . 13
3.1.1 System Scope and Initial Assumptions . . . 13
3.1.2 Possible System Architectures . . . 14
3.2 System Requirements Analysis . . . 18
3.3 Wireless Sensor Network . . . 19
3.3.1 Requirements Analysis . . . 19
3.3.2 Chosen Development Hardware . . . 20
3.3.3 Chosen Development Software . . . 25
3.3.4 Developed Application and Algorithms . . . 26
3.3.5 Testing and Validation . . . 42
3.4 Data Retrieval,Storage and Network Management . . . 43
3.4.1 Required functional aspects . . . 43
3.4.2 Chosen Development Software . . . 43
3.4.3 Used Hardware . . . 44
3.4.4 Developed Application and Algorithms . . . 44
3.4.5 Testing and Validation . . . 52
3.5 Data and Network Analysis Services. . . 52
3.5.1 Required functional aspects . . . 52
3.5.2 Chosen Development Software . . . 53
3.5.3 Developed Application and Algorithms . . . 53
3.5.4 Testing and Validation . . . 59
3.6 System Integration . . . 60
3.6.1 Full System Testing . . . 61
x CONTENTS
4 Case Study and Platform Testing 63
4.1 Deployment Preparation . . . 63
4.2 Case Study Deployment . . . 65
4.3 Environmental Data Analysis . . . 67
4.4 Network Behaviour Analysis . . . 75
5 Conclusions and Future Work 83 5.1 Review,Discussion and Implications . . . 83
5.2 Main Results and Conclusions of the Thesis . . . 84
5.3 Suggestions for Further Research . . . 84
A Section A 87
List of Figures
3.1 System Layers and Interfaces . . . 14
3.2 Information exchanged by nodes . . . 15
3.3 Possible System Layout . . . 15
3.4 System Diagram with OGC SWE support . . . 16
3.5 Adopted System Layout . . . 16
3.6 Considered Initial Requirements . . . 18
3.7 TmoteSky . . . 20
3.8 TmoteSky - Back . . . 21
3.9 Photodiodes Output Current Variation . . . 22
3.10 PhotoDiodes connected to MSP430 ADC Ports . . . 23
3.11 Accuracy Charts - From the SHT11 data-sheet [1] . . . 24
3.12 MSP430 Central Role . . . 25
3.13 Definition of Rotational Axis . . . 29
3.14 Division of Source Code Sections . . . 31
3.15 Powerup UML Sequence Diagram . . . 32
3.16 Configuration Activity . . . 34
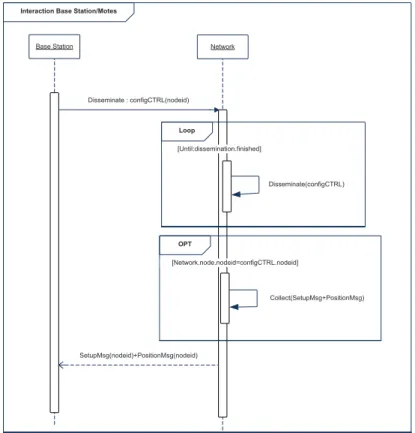
3.17 Interaction between Base Station and Motes . . . 36
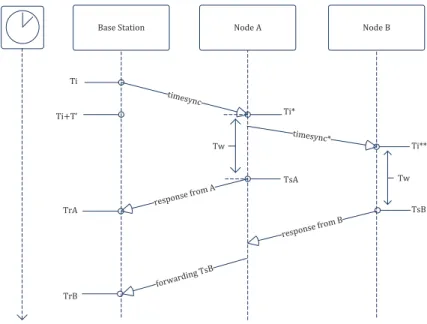
3.18 TymeSync Base Station and Motes . . . 39
3.19 Error Increasing with TimeSync Dissemination . . . 40
3.20 Collection and Dissemination Sharing the Same Routes . . . 40
3.21 Collection and Dissemination not Sharing the Same Routes . . . 41
3.22 Time Dissemination and Lag . . . 41
3.23 Main Developed Java Packages . . . 44
3.24 Developed Java Package : ems . . . 45
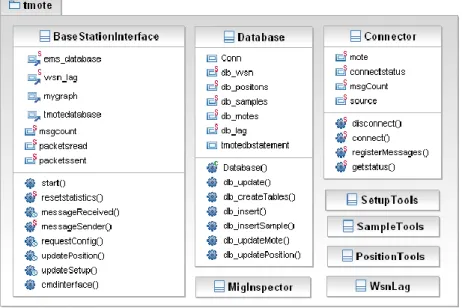
3.25 Classes contained in the tmote package . . . 46
3.26 Apllication Initiated . . . 46
3.27 Command Line Interface . . . 47
3.28 Database Entitiy-Relationship Diagram . . . 47
3.29 Messages Generated by the Mig Tool . . . 48
3.30 Control Message . . . 49
3.31 Setup Message Extended . . . 49
3.32 Mig Message Inspector Class . . . 50
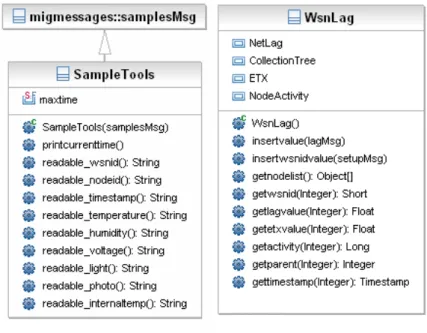
3.33 Samples and WsnLag messages . . . 51
3.34 GUI Network Management Tab . . . 51
3.35 GUI Database Management Tab . . . 52
3.36 Web Interface Packages . . . 54
3.37 SqlQueryEngine Package . . . 54
3.38 Url Directories . . . 55
xii LIST OF FIGURES
3.39 Nodepage Html . . . 55
3.40 NetStatus Html . . . 57
3.41 Colormap Html . . . 58
3.42 Developed KML Package . . . 58
3.43 Google Earth Network Interface . . . 59
3.44 Google Earth Network Interface . . . 59
3.45 System Integration Diagram . . . 60
4.1 Points to Monitor . . . 64
4.2 Stand Model . . . 65
4.3 Assembly Line Stages . . . 66
4.4 Example - Temperature Evolution from Space A, Ground Motes . . . 67
4.5 On the left the garden versus the library on the right . . . 68
4.6 Temperature evolution at the Garden . . . 69
4.7 Temperature evolution at the Library Square . . . 69
4.8 Temperature evolution on both Locations . . . 70
4.9 Temperature Colormap of the Upper Layers . . . 70
4.10 Temperature Colormap of the Upper Layers 1PM to 2PM . . . 71
4.11 Temperature Evolution Of Upper Layer Motes . . . 72
4.12 CPU Temperature Evolution Of Upper Layer Motes . . . 72
4.13 Relative Humidity on both Spaces . . . 73
4.14 Light Averaged every 10 Minutes . . . 74
4.15 Light Colormap . . . 74
4.16 Number of Received Samples per Node . . . 75
4.17 Difference Between Expected and Received Sample messages (Percentage) . . . 76
4.18 Comparison Between Null Minutes with Random Message Loss . . . 76
4.19 Null Minutes Concurrency . . . 77
4.20 Average Lag . . . 78
4.21 Garden Motes - Comparison of Performance Values . . . 78
4.22 Library Motes - Comparison of Performance Values . . . 79
List of Tables
3.1 The Samples Network Message . . . 26
3.2 The Positions Network Message . . . 27
3.3 The Setup Messages . . . 29
3.4 Code added to the Dissemination Component Configuration . . . 38
3.5 Code added to the Dissemination Component Implementation . . . 38
A.1 The Deployment Correlation Table . . . 88
Abbreviations
GIS Geographic Information Systems GPS Global Positioning System
USART Universal Synchronous/Asynchronous Receiver Transmitter USB Universal Serial Bus
LED Light Emitor Diode SPI Serial Port Interface
ADC Analog to Digital Converter SMA SubMiniature Version A SQL Structure Query Language HTML Hypertext Markup Language PDF Portable Document Format Db Decibel
KB KiloByte
ADT Abstract Data Type
ANDF Architecture-Neutral Distribution Format API Application Programming Interface CAD Computer-Aided Design
Chapter 1
Introduction
There as been, traditionally, in many areas, the need for data collection or data sensing, on a broad array of variables. Most of the times, until recently, wired sensors have been used in order to analyse variables of interest. In industrial environments, protocols like MODBUS [2], CAN [3] and similar ones, over mediums like RS232 [4], RS485 [5] or even Ethernet [6], have been nor-mally used to connect sensors to central stations.This poses, however, several inconvenients from deployment and management point of views. Sometimes the areas that needs to be sensed are un-easy to access and may be so wide or complex, that makes cable installation a daunting and expensive task. The situation aggravates itself whenever the deployment of sensors is temporary. Installing and un-installing arrays of sensors on industrial environments for short amounts of time can impact plant production, and the benefits from the data measurements may vanish when com-pared with the profit loss of conducting the relevant studies.
A typical example of this paradox is machine calibration conducted with vibration analysis. Prior to the setup of such vibration sensors it is often necessary to shut off the machines in ques-tion, to proceed with cable installation in order to wire the required sensors. Each machine status is normally analysed, in order to fix any deviations and increase performance. The time that the “machine” is stopped means, in many industries, loss of money. This loss itself may be enough to postpone or eliminate the study from happening. The following paragraphs show some exam-ples of how wired sensors are being used to retrieve data in different contexts. The underlying disadvantages of using these type of solutions are emphasized.
Nowadays, energy consumption studies are still, most times, conducted using wired devices capable of measuring power consumption. To characterize a vast industrial area, looking for the source of potential energy loss, often needs allot of wiring. The preparation time, due to the nature and usual placement of the energy conducting cables, is laborious and expensive. This as made companies to pre-install energy counters in strategical areas during the construction of their plants in order to minimize the need of such studies. However to locate energy loss sources, it is often necessary to analyse in detail on the plant floor each device.
2 Introduction
The environment and climate change are a topic of discussion that have motivated several studies. When we think about climate, climate change, and environmental issues, we often think in a macro-scale, instead of what we usually feel everyday. To analyse the impact made by mankind in the global climate we often recur to data that is recorded by weather stations scattered around the earth, that give a general perspective about climate and climate behaviour. There is often only average readings of certain variables’ evolution in specific places, and those readings are considered representative of a wider area. Some fields of science acknowledge that there is a need to have a deeper analysis on subjects like micro-climate, micro-climate changes and its impact on human life and animal species. This can be done by taking less scattered readings on several measurable quantities. Several studies have traditionally used wired solutions, based on portable weather stations, some times expensive, in order to characterize volcanic areas, rain forests and iced continents among others. This places a lot of issues related with the power supply of that kind of hardware and how wide the area can those measures represent.
Human networks, and urban life are often parametrized by adhoc studies using “in-situ” obser-vations by researchers and observers. These interactions between people, also with the surround-ing environment and urban spaces is of extreme interest for both marketsurround-ing companies and social behaviour scientific studies. How to reliably collect data about peoples lives and people’s inter-actions, without interfering with their privacy has opened its own field of public discussion. City planners can use computerized city models to run and test new construction developments as well reorganizing existing ones. It would be possible to reduce power consumption, traffic jams and increasing the city’s quality of life. All of these statements depend on a consistent and distributed data gathering platform. It is hard to imagine or calculate the amount of wiring, and installation time, needed to collect signals from sensing platforms, even if using pre-existent platforms like the telephone lines,cable or electrical power lines.
Home automation platforms have started to rely on previous conception and preparation of buildings, for the installation of proper cabling. Part of the home automation devices require com-munication with sensors distributed through the house. Some automation systems communicate using the powerlines. Still installation of small devices that measure light intensity or temperature, may need relocation, or can, due to the nature of its placement, hamper the use of the power source for communications, normally due to aesthetic reasons.
Many artificial intelligence algorithms work by analysing patterns and comparing it with cur-rent readings in order to take a “decision”. Some artificial intelligent (software) agents are used in simulated environments through which data is fed. In real life, many systems use sensors, cameras gps (among others) as their data acquiring mechanisms, in order to sense and possibly act upon the world. Distributed computing systems can be used as a way to sense the world. This systems can work as a colony, silently registering and analysing data looking for determined or unknown patterns.
The previous paragraphs show the need for a distributed data gathering system, that can be used in a broad array of existing situations. These devices need to have short installation times, and similar reliability to already existent wired solutions. The mentioned facts resulted in the
1.1 Research Objectives 3
development of wireless sensor solutions.
Even if one can gather all the information required for a certain application, there is still the need for a easy and flexible data storage and analysis tool. Normally software is build in a “case by case” analysis. Sometimes problems exist with software portability between different operative systems. Some require specific instructions or previous knowledge prior to its usage. A new approach is now appearing emerging. The aggregation of publicly available data on the world wide web, with data collected by sensing platforms is starting to be used. This delivers a more compelling and easier way to analyse data, by enabling users to use common and known tools. It also enables public data to be readily available everywhere.
This thesis was developed as part of the current activities from the Network Centric Control Systems Group (NCCS), of the Electrical and Computer Engineering Department at FEUP. The outcome of this research was added to the several solutions already developed by one of the NCCS research groups: the FEUP WSN Group [7].
The FEUP WSN Group has been developing solutions on the field of Wireless Sensor Net-works: Monsense [8], Early Warning Fire Detection System, Aquatic Monitoring Solution, Dis-tributed Noise Monitoring System among others.
1.1
Research Objectives
The main goals of this research is the development of a wireless sensor network application that can be integrated with current GIS or earth browsing software. Network management,data storage and data analysis are also accounted for.
The system was developed taking in mind a broad range of applications. This work takes into account questions like portability, software modularity and system integration. A clear, and scalable approach is also seen as a paralel objective.
1.2
Scope and Limitation of the Research
The sensing platforms described throughout this work are introduced up to a sufficient level of detaill, whenever needed. A similar approach is taken when describing technologies used dur-ing research. For instance it is out of the scope of this research a deep characterization of the underlying technologies used by sensors. Instead whenever needed mere equations describing the functionality of such devices are introduced.
The literature used during research is deeply connected with the pratical aspects of this work. It is not feasible to introduce all of the required theory behind the networking protocols used during development. Whenever possible a small description of the features used is made leaving external references for further analysis.
A great part of this research is in fact dedicated to the development of a system capable of reaching the proposed objectives. There are several software tools that were used to develop such system, and there are some external applications used by the system itself to produce the expected
4 Introduction
results or objectives. Although knowledge about such applications had to be gathered in order to interact and use its functionalities, it is considered that it is not a research objective to explain in a detailed manner how this interaction with external applications is implemented. External references that were consulted in order to fulfil the required implementation tasks are displayed whenever necessary. The development process is instead documented in a more detailed manner, showing the research and implementation steps taken.
Time was a constraint present during the research and development stage. There is a trade-off between the research schedule and the number of aspects and functionalities researched or implemented throughout the work. Decisions were often made taking into account the devised research or project deadlines, although some of them might not be optimal, they fulfilled the requirements and objectives devised at each stage. Time constraints have also limited the case study, it was still possible to retrieve enough valuable data for analysis.
1.3
Document Overview
This work describes the development of a platform based on a wireless sensor network, which is able to publish gathered data on-line. The building of this framework will be discussed thor-oughly through the entire document. The system test and actual deployment is later on discussed, together with findings on the test subject. This dissertation is composed by five chapters.
In Chapter2, related works and current technologies are reviewed and discussed. Chapter3, shows the methodology employed to develop the Environmental Monitoring Services system, by describing each of the system’s layers. A case study in Chapter 4 shows the deployment and usage of the constructed system, together with the analysis of the data generated. In Chapter5, a review is made about the overall performance and behaviour of each system layer. Findings and suggestions for further research conclude the last Chapter.
Chapter 2
Analysis of Relevant Literature and
Related Projects
This literature review confines itself to specific subjects pertaining to the development of wire-less sensor network applications, and the storage, treatment and display of data. It does a brief introduction to the current wireless sensor, state of the art applications. It is out of the scope of this review to introduce on a detailed level how the physical interfaces which compose the network nodes interact to establish communication.
2.1
Overview Of Wireless Sensor Networks
The recent development and miniaturization of micro-controllers has enabled new applications and systems to emerge at an increasing rate. These silicon devices allow perceiving the world as well as acting upon it in ways that were impossible a decade ago [9]. Nowadays it is possible to establish a network of small devices, designed to retrieve data from their surrounding environment, or acting on it, leaving only a small footprint of their presence. These nodes normally forward their readings to a sink node, usually called base-station. Many issues still exist pertaining network scalability, hardware reliability, ease of use and development tools. Real-life applications normally recur to specially engineered products designed to fulfill a determined function. Platforms can normally be adapted to a different array of sensors. The usual sensors that can be found to work out of the box with these devices are light, temperature, humidity, vibration and barometric pressure sensors.
“computers are noticeably more widespread, smaller, and mobile. What we often overlook are the billions of computers around us that we never see. Over 10 billion microcontrollers ship each year, and they exist in unexpected objects. Even my skis have a small microcontroller in them.” [10]
6 Analysis of Relevant Literature and Related Projects
In [10], new applications in the field of pervasive computing are discussed. The author particu-larly emphasizes the fall backs of “sense and send” methodologies and encourages the wide-spread use of small remote devices with collaborative abilities. These collaborative abilities could be used to detect environment variations and act upon it. Another fact that is mentioned is that currently, to develop applications using these platforms, one must be capable of programming specific code to work with the various micro-controllers’ platforms and usage scenarios. This normally requires some prior knowledge of circuitry and low level programming which is something that greatly limits the number of people capable to perform such task and hinders potential applications for the already existing technologies. A different approach is incited: the adoption of a well known programming language, to develop applications that run on these small devices.
There is an intrinsic, and apparently unsolvable problem when working with remote deployed devices: their power source. More often than not, the wireless nodes can not draw their power from a power grid. This is normally due to the remote nature, or difficult to reach locations in which these sensing solutions are used. Studies show that it is possible to scavenge energy from the environment in order to keep the sensor networks live.
“Energy harvesting techniques can deliver energy densities of 7.5 mW/cm2 from out-door solar, 100 uW/cm2 from inout-door lighting, 100 uW/cm3 from vibrational energy and 60 uW/cm2 from thermal energy typically found in a building environment. A truly autonomous, “deploy and forget" battery-less system can be achieved by scaling the energy harvesting system to provide all the system energy needs.” [11]
A detailed overview on energy harvesting techniques can be found in [11]. Several studies [12,13,14] show that it is also possible to use human movement to feed the nodes. The Seiko Kinetic [15] wrist watch is one of the examples in which energy is derived from body movement. Normally wireless nodes have different power states, that correlate to the functionalities which are enabled. Increasing production energy levels can be achieved by adding more harvesting sources. Rechargeable batteries should be used in order to avoid energy waste when energy production superseeds the node’s energy consumption. When the energy derived from the surrounding envi-ronment is not enough to power the node, then the node can use the battery as its energy source.
In [16] a system capable of deriving power from solar energy is demonstrated. This system is able to power wireless network nodes using a small solar panel connected, through a charging circuit, to an array of capacitors and a backup battery. The charging circuit is controlled by the wireless nodes’ software. It is demonstrated that if the node’s (the telos platform [17]) full power duty cycle need is of 10%, then its operation lifetime is of 4 years.
During night time, there is still the need to recur to the rechargeable batteries.The limited bat-tery recharge cycles are the only hindering factor of such systems. With the inclusion of large capacitors the need to recharge the batteries is reduced. Capacitors are usually employed in en-ergy harvesting techniques greatly due to their cost, (almost) infinite recharge cycles and higher power efficiency. In most cases a combination of capacitors and rechargeable batteries is used. To characterize node power consumption, it is necessary to define each platform’s components’
2.1 Overview Of Wireless Sensor Networks 7
power state and energy consumption levels. Although power consumption levels vary from plat-form to platplat-form, there is generally a pattern that can be found. When active, the transceiver is responsible for the most part (around 80%) of the nodes power consumption, followed by the micro-controller and sensors. Such fact needs to be taken into account when developing a new platform, or developing an application for the existent ones.
“With current hardware technology, the most of the energy is spent by the radio transceiver. Besides the energy spent during transmission and reception of messages, also the energy consumption due to listening on the channel waiting for incoming packets is relevant (idle listening)." [18]
In [18] a radio duty cycle approach, together with a low level communication protocol, is devised in order to reduce the transceiver’s power consumption. This work shows how to charac-terize the power profile of the transceivers in order to optimize their power consumption through the implementation of an alternative MAC protocol. This protocol makes the use of preamble messages, already used for radio sleep modes, to schedule communication between nodes. This approach works by sending a countdown time message in the preamble, allowing the receiving node to calculate when actual data will be sent through the communication channel; therefore the receiving node can remain sleeping until that calculated time. This strategy shows a maximum of 30% increase in battery lifetime.
2.1.1 Routing Schemes
The several nodes that build a network often need to establish routes for information to be de-livered at base. This occurs due to the limited transmission range of each node. Several techniques have been developed in order to build such routes.
Routing protocols have a major role in wireless sensor networks. There is a large volume of literature and publications dealing with this subject. The routing algorithm can directly impact the WSN energy consumption. As seen in [19], different routing schemes may lead to different power loss, and different message loss.
A (non) routing scheme is data “flooding". Simply put, each node simply broadcasts each received message. This wastes energy, in a variety of ways but eventually, the message reaches a base station. Other variations are “gossiping” in which nodes calculate a random node within their proximity to send its messages.
Simple routing algorithms calculate the number of nodes between a giving node and the base station without accounting for link quality within each pair of nodes. Nodes periodically send their data through the routes to the base-station. This in theory works, but the variable behaviour of the link quality traduces itself in sporadic link loss, possibly leading to message loss.
In [20] the “expected transmission count metric” is used to find the maximum throughput rates in multi-hop wireless networks. This metric works by estimating the necessary message retransmissions from a given node to the base, taking link quality into account. This can then be
8 Analysis of Relevant Literature and Related Projects
used to find the optimal route for message delivery, by assigning a network hierarchy to the nodes. This approach is used in [21] to establish the collection routes.
Other routing protocols use a data-centric approach. Sometimes a group of nodes in proximity may have similar reading from ones of its sensors, within a certain interval. Also, different nodes can have different power (or other resources) available. The several nodes negotiate with each other to share the data in which they are interested on. The nodes take into account their available resources. This negotiation eliminates redundant data. The base-station then negotiates with the network for a particular set or range of values from its network. With the redundant data elimi-nated, redundant transmissions are eliminated as well, and the valuable data evolves through the network until it reaches the base-station. This kind of approach can be seen in the SPIN (Sensor Protocols for Information via Negotiation) [22] algorithm and in the “Directed Diffusion” Protocol [23].
Ideally each node’s power consumption should be the same. However in practice, some routing algorithms fail to take that into consideration. Some of the nodes end up being used more often for retransmission than others. This fact leaves the network power consumption unbalanced. If a critical node in an established path “dies”, due to the fact it consumed all of its provided energy, then most protocols try to find out another route. However, nothing changes the fact that no future readings will be retrieved from the dead node. This as lead some researchers to develop algorithms that try to rearrange the routes in order to maximize battery lifetime evenly through the network [24].
Another approach is hierarchical clustering. Nodes are grouped onto clusters. Inside a cluster, nodes send their data to a cluster head or “parent”. Nodes form a cluster by choosing the cluster parent that provides the best link quality. This parent node is similar to the other nodes, but needs to cope with the task of receiving and aggregating data from the nodes within that cluster. Cluster parents are the ones that establish routes to reach the base-station. This kind of routing as one apparent disadvantage: power consumption at each cluster parent node. In [25] this fact is overcome by periodically assigning the cluster parent role to a different node. Another study [25] has a similar approach but the nodes decide randomly when to become cluster parents. These techniques make energy consumption evolve homogeneously through the various nodes.
Some routing schemes take into account geographical information. By using the expected radio transmission radius, and each mote position it is feasible to define the possible transmission paths. Sometimes several nodes can establish redundant paths. Those path redundant nodes can shut off their radios, and the critical path ones listen periodically to the channel. Negotiation between the nodes establishes the listening time from the critical path nodes. The path redundant nodes communicate with the critical path ones in the devised times. Periodically the critical nodes are replaced with one of the redundant nodes, keeping load balancing. This kind of methodology can be seen in GAF (geographic adaptive fidelity) [26].
One different communication scheme is multi-path based routing. In multi-path based algo-rithms the nodes try to establish, not one, but many links to the base-station. This works well if the base-station is on the center of the WSN. There is an energetic cost by employing this
methodol-2.1 Overview Of Wireless Sensor Networks 9
ogy, but the gains in redundancy may justify it, depending on the application. Lets imagine that the base-station can only communicate with a small portion of nodes from the WSN and that multi-path routing is being used. The messages from the remaining nodes will need to pass through the nodes the base-station communicates with, making them consume more power. This leads to load unbalancing, making those nodes “life expectancy” shorter. Many solutions have been proposed to deal with this subject, one passes by using different kind of power sources for the nodes that in theory have to stand a higher number of communications. A strategy employed in [27], uses the concept of multi-path routing employing multiple sinks (or base-stations). In this methodology the nodes try to establish multiple routes to the available sinks. These paths topology resembles a star-burst, due to the fact that the sink nodes are placed on the perimeter of the WSN. These sinks are then connected using other kinds of networking mediums. An application controls the data received at the multiple sinks and eliminates redundant messages from the nodes.
The previous routing schemes try to maximize reliability and optimize energy consumption. The issue of response time, combined with packet loss needs also to be addressed. For instance, some WSNs can be used to monitor a specific event. If a node detects such event, and the event data is critical, then it is expected that not only that information is delivered reliably, but it is also delivered in the shortest time possible. To address these issues, recent studies try to develop and apply “quality of service” (QoS) metrics, by creating new routing paradigms or modifying existent ones. One study [28] uses a multi-path approach together with QoS measures, that enables critical packets to follow the best overall routes and relays standard (non-critical) information to the remaining paths.
2.1.2 Hardware Platforms
Wireless sensor nodes (typically called motes) are available from several different manufac-turers, mainly US-based. These include Sentilla [10],Crossbow [29], Dust Networks [30] and Meshnetics [31], among others. Some of these devices have been traditionally used as testbeds in wireless sensor network applications. These sensor nodes usually employ micro-controllers, radio transceivers and sensors. Each platform normally comes with an operating system.
2.1.3 Operating Systems
Although each of the platforms introduced in the previous subsection usually comes with pre-built software, it is possible in some cases through the use of open source development tools to build specific applications. These development tools often contain an operative system, or kernel, over which the developer can run its code.
On the proprietary side, Sentilla has created a Java Virtual Machine for their motes. It allows JAVA code to be run on the motes, by using their special developed packages. Meshnetics provides BitCloud to work with their motes. BitCloud is mentioned here because it is based on a software
10 Analysis of Relevant Literature and Related Projects
stack implementing the ZigBee [32] feature set. It uses C language. They also provide “MeshNet-ics OpenMAC” which is an open source implementation of the IEEE802.15.4 [33] Media Access Control (MAC) layer.
TinyOs [34] is an operating system written specifically to work with wireless embedded sensor networks. It is open-source and has an active development group. This OS has a component based, application construction methodology. TinyOs provides a library with components that execute specific functions. There are abstract components for general functionalities, and specific components that are tied to work with specific hardware. The execution model is event-driven, and allows task-scheduling in a FIFO order. Thread support is not incorporated by default in the OS. Programs are developed in a language programming language called nesC. This language syntax is similar to C, but adds other functionalities and operators to specifically deal with hardware abstractions and event handling. In the end the application developed is statically linked with the TinyOs code, building a binary that can be used to flash the motes. TinyOs is distributed as a set of tools and libraries. These tools include compilers, applications for flashing different platforms and utilities for communicating with the platforms, for example through USB.
Contiki is also an open source operative system specially developed for memory constrained networked devices with small processing power. It offers a multi-tasking execution model. Contiki provides an IP communication stack for IPv4 and IPv6. The development tools provide simulators in order to improve and accelerate both the development and debugging stage. Contiki programs are written in the C programming language. Like TinyOs, it uses an event-driven kernel. One of its most attractive functionalities is the ability, by default, to load and unload programs at run-time on top of its kernel. This OS also provides lightweight thread support on top of the event driven kernel.
2.1.4 Applicable Standards
The radio transceivers used on wireless sensor nodes are usually compliant with the IEEE 802.15.4 standard. This standard defines the PHY and MAC requirements and definitions for personal are networks. The medium access mechanism used is carrier sense multiple access with collision avoidance (CSMA-CA). The standard includes also definitions for star and peer to peer topologies.
A set of standards [35] from the OpenGeospatial Consortium, is available for the display of sensor related data on web enabled platforms. This set includes, among others, the “Sensor Model Language” standard (SensorML) [36], the “Sensor Observation Service” standard (or SOS) [37] and the “Sensor Planning Service Implementation” standard (or SPS).
The “SensorML” standardizes the way to describe sensors and sensor systems, as well as its readings. The “SOS” standard describes the methods that should be present in a web service in order to retrieve information about sensor systems and sensors. Sensor Planning Service (SPS) provides a standard interface to collection assets (i.e., sensors, and other information gathering assets) and to the support systems that surround them.
2.2 Related Projects 11
The “Geographic Markup Language” (or GML) [38] is an OpenGeospatial standard that pro-vides a set of XML encodings to represent and transport geographic data. GML propro-vides coordi-nate reference systems, temporal reference systems and units of measure. GML tries to conforms its representations with other well established ISO standards.
KML (formerly Keyhole Markup Language) is an XML grammar used to encode and transport representations of geographic data for display in an earth browser, usually Google Earth [39] or Google Maps [40]. KML complements GML, and uses some of its geometric representations.
2.2
Related Projects
In [41], a long term outdoor experiment over a wide area is conducted to analyse the perfor-mance of a wireless sensor network. In the experiment several parameters were analysed, like the radio performance, and the stability quality of their provided links. Also the multi-hop environ-ment is thoroughly tested.
In [42], wireless sensor networks are used in oceanography. The mechanical design, circuit design and networking software design are described together with the issues found.
In [43], a study on human interaction behaviour is conducted. Although not directly related with WSN technologies this study shows the potential enclosed in sensing technologies when applied in pervasive ways. According to this study, city planning needs to take into account the flow of urban life, and its interaction with new technologies.
Microsoft has developed a project [44] called “SenseWeb” to display sensor readings in its GIS mapping tool [45]. This project includes software libraries, to transform the data gathering by sensor platforms (which can include wireless sensor networks), and publish it on the “sensormap” webpage [46].
“OOstethys” [47] is a community of software developers and marine scientists that develop tools, using the latest applicable open standards, to display oceanographic information in the Google Maps Api [40]. Their project delivers an integrated platform to publish on their website information retrieved by oceanographic sensor platforms.
Several projects have been developed in [7] using wireless sensor networks for a variety of purposes. These include an “Early Warning Fire Detection System”, the “MonSense Application - Planning, Deployment, Monitoring and Control of WSNs”, a “Distributed Noise Monitoring System” and an “Aquatic monitoring solution”.
The University of Melbourne as been developing a project called “The SensorWeb project” [48]. This project aims at developing a set of applications and software layers that interconnect sensing platforms with distributed computing grids. By integrating sensor networks with grid computing, it is possible to offload some of the typical tasks that usually run in centralized systems. The “Sensor Web” concept embraces a larger set of systems, in which wireless sensor networks can be part of.
In the Washington State University there is also a “Sensorweb Research Laboratory” which is developing Sensor Web systems and applying this technology to scientific and social applications.
12 Analysis of Relevant Literature and Related Projects
The technologies being developed share the visions employed by the NASA in their own “Sen-sorWeb” researches. NASA has been developing applications enabling the Sensor Web concept [49].
Chapter 3
System Analysis and Development
This chapter begins by providing the methodology used to reach the research objectives. Throughout this chapter the constructive parts of each level of the system are explained.
3.1
Methodology and Development Model
To reach the proposed objectives an incremental development model [50] was followed. Dur-ing the plannDur-ing stage, it was acknowledged that to allow further enhancements and system reuse it would be interesting to layer the system into subsystems, in its logical boundaries [51]. Thereby the system was divided onto different layers, each one with its own time-line, requirements and characteristics. All layers in the end work together towards the common objectives. These layers became effectively the development goals.
By using an incremental/iterative model throughout implementation, it was possible to refine some of the specifications, and add functionalities that were previously not defined. This allowed some degree of freedom as the system evolved, and also enabled early testing of the functionalities.
3.1.1 System Scope and Initial Assumptions
In order to develop a reliable and coherent wireless network, together with data aggregation services to serve as a mean to gather environmental data, several parameters need to be defined before actually starting the development. The immediate question that may arise is "‘where will the system be used?"’. This work has in its essence the quest to build a versatile environmental data gathering platform that can be used in various scenarios, which were already mentioned in previous chapters. There were, however, several assumptions made beforehand in order to develop or find concrete hardware and software solutions. These assumptions will be presented on the following paragraph.
The WSN is targeted to observe environmental phenomena. The variables to be measured are light, temperature and humidity. Variation of the measured quantities is not expected to occur
14 System Analysis and Development
in a timescale smaller than one minute. Data retrieved is collected at one node of the WSN, the base-station. Current hardware only allows a few hundred meters of wireless transmission range. To cover wider areas, it is expected that the nodes have the ability to establish a route so that their messages reach the base-station.
An important question is time synchronization, and message time-stamping between the nodes of the network. “Where and When” is crucial in data analysis, but so is sensor precision and transmission errors. Reliable storage and aggregation mechanisms of the gathered data must be designed to cope with information flowing from the network into the base-station.
Making data easily accessible through easy-to-use tools can make the user experience more compelling and productive. Furthermore, the ability to reconfigure network parameters can allow for multiple usage scenarios, where homogeneity or heterogeneity between the nodes, their as-signed tasks and configurations may exist. Geo-spatial information about sensor orientation and node location allows precise data characterization; methodologies to define both are also explained in this chapter.
Three layers emerge from the previous statements: a data gathering layer (WSN), a data stor-age and network manstor-agement layer, and a data/web service providing layer3.1.
Wireless Sensor Network
Data Storage and Network Management
Data Visualization and Webservices
interface interface
Figure 3.1: System Layers and Interfaces
Each layer is based on a combination of hardware and software designed to satisfy defined tasks. To apply a scalable methodology, comprehensive layer boundaries must be defined.
The following sections will detail constructive software and hardware parameters, when ap-plied, to each of the layers mentioned.
3.1.2 Possible System Architectures
It is not premature to discuss the considered system layouts. In fact, although each layer can be developed separately, there is one common starting point: the flow of data from the wireless sensor network until the end-user. The definition of the data to be exchanged is derived from the expected system usage. In this case, to accurately characterize the measures and the measure procedure, the the information contained in diagram 3.2needs to be exchanged.
Each node needs to be identified in order to distinguish between the several nodes’ sampled data. The main parameter, expected to be exchanged by the nodes, is the data sampled by the platform’s available sensors. Each node is placed in a specific location and has a configuration. This can be used to characterize the data to be stored.
Due to the limited storage ability of the current available motes, storing sampled data during long term deployments is not feasible. The data storage layer needs to be built on a different
3.1 Methodology and Development Model 15
Wireless Sensor Node (Exchanged Data)
Node id Sampled Data Location Configuration Reference to Parent Node
Figure 3.2: Information exchanged by nodes
platform. An application running on a common personal computer could do such a task while connected to the base-station node. The same application layer could allow for network recon-figuring (e.g. enabled nodes, time between samples), since it is already in direct contact with the base-station. On top of the central layer, the data visualization layer can be built making use of an available web-programming technology. A possible system layout can be seen here:
Wireless Sensor Network Base Station
Database Technology
Predefined Requests ex.: KML + Google Maps Api ex.: WebPages
Environmental Monitoring Service Provider
Figure 3.3: Possible System Layout
Although the system diagram 3.3in could be used as a starting point for system development, it does not allow for an interactive user experience, or for convenient data analysis. The user experience is diminished by using predefined requests over the sampled data.
An alternative approach, compliant with the OGC set of standards [35] would need a dedicated server application with XML parsing capabilities. Also extra work would have to be done in order to implement the methods described in the Sensor Observation Service.
It should be noted that during research only a few applications were found that support OGC’s Sensor Observation Service, being that the majority that currently exist only support a subset of the software methods described in the standard. Also SensorML [36] can be used to describe the sensor to account for “sensor describing requests”.
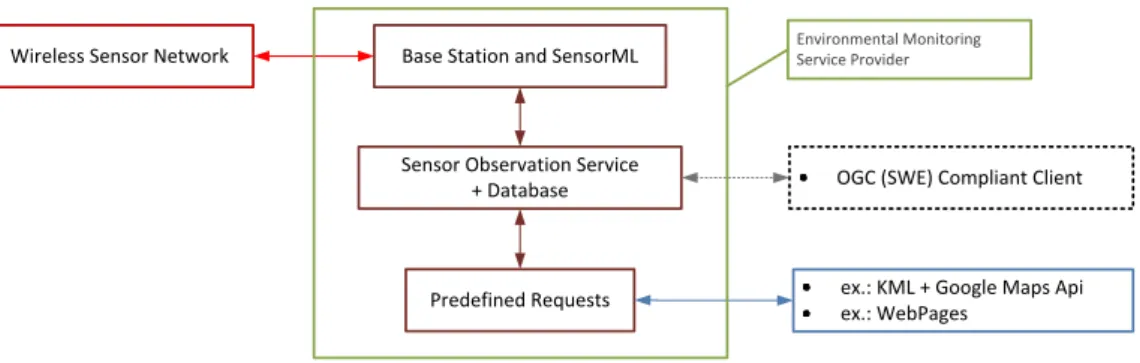
As an example, in both diagrams KML [52] and the Google Maps API [40] were considered as constructive elements of the final layer.
16 System Analysis and Development
Wireless Sensor Network Base Station and SensorML
Sensor Observation Service
+ Database OGC (SWE) Compliant Client
Predefined Requests ex.: KML + Google Maps Api
ex.: WebPages
Environmental Monitoring Service Provider
Figure 3.4: System Diagram with OGC SWE support
The architecture shown in figure 3.5 shows another possible layout, that takes into account personalized data requests.
Wireless Sensor Network Base Station
Network Management
+ Database Technology Graphical User Interface
Dynamic Requests ex.: KML + Google Maps Api
ex.: WebPages
Environmental Monitoring Service Provider
Figure 3.5: Adopted System Layout
3.1.2.1 System Concept
The diagram in figure 3.5 shows the guideline followed through the implementation of the system. With this arrangement, it is possible for the user to specify which particular data he/she wants, and how it should be aggregated before display. For instance, the user may request to read the average temperature at each hour from a specific set of nodes, in a specific time frame. It also includes a GUI to allow easy reconfiguration of the WSN subsystem.
This choice takes into consideration that each software layer can adapt well to a variety of operating scenarios (e.g. when the WSN is online or offline). Also, this kind of approach allows specific functionalities to be implemented, when needed, in a specific layer, without breaking pre-viously existing features. Lets imagine that a new type of WSN is added to a system that was developed with the considerated guideline. The "Data storage and Network Management Layer" would need to be changed in order to connect to the new WSN but the data visualization should suffer no changes. And the same can be said to any new feature added to the data visualization
3.1 Methodology and Development Model 17
layer, when considering the remaining layers. This separation also helps the developer to bet-ter manage the development cycle.The following subsections contain the employed development algorithms for each subsystem.
18 System Analysis and Development
3.2
System Requirements Analysis
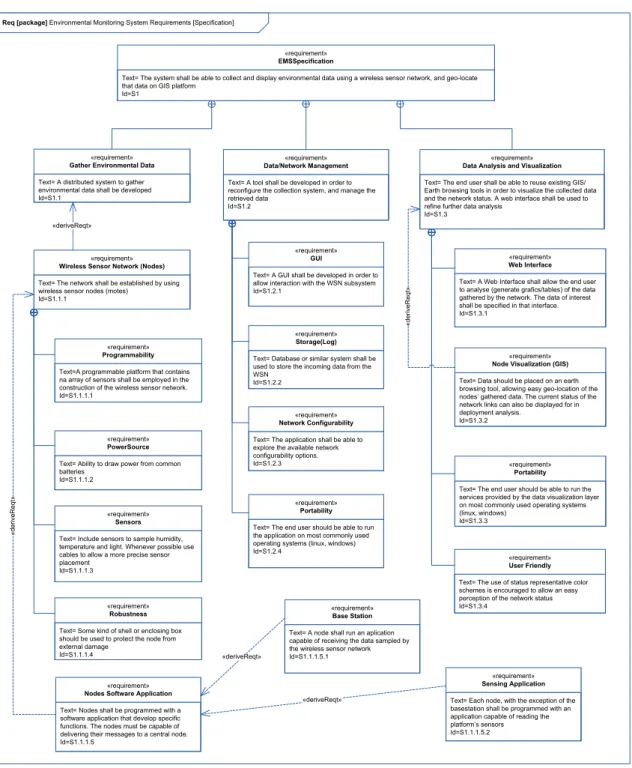
An overview of the established requirements for the system can be seen in figure 3.6. This guideline was used during the planning stage to better understand each of the subsystems tasks. A refinement to these requirements is made during each subsystem development subsection.
Req [package] Environmental Monitoring System Requirements [Specification]
Text= The system shall be able to collect and display environmental data using a wireless sensor network, and geo-locate that data on GIS platform
Id=S1
«requirement»
EMSSpecification
Text= A distributed system to gather environmental data shall be developed Id=S1.1
«requirement»
Gather Environmental Data
Text= The network shall be established by using wireless sensor nodes (motes)
Id=S1.1.1
«requirement»
Wireless Sensor Network (Nodes)
Text=A programmable platform that contains na array of sensors shall be employed in the construction of the wireless sensor network. Id=S1.1.1.1
«requirement»
Programmability
Text= Ability to draw power from common batteries
Id=S1.1.1.2
«requirement»
PowerSource
Text= A tool shall be developed in order to reconfigure the collection system, and manage the retrieved data
Id=S1.2
«requirement»
Data/Network Management
Text= The end user shall be able to reuse existing GIS/ Earth browsing tools in order to visualize the collected data and the network status. A web interface shall be used to refine further data analysis
Id=S1.3
«requirement»
Data Analysis and Visualization
Text= Include sensors to sample humidity, temperature and light. Whenever possible use cables to allow a more precise sensor placement
Id=S1.1.1.3
«requirement»
Sensors
Text= Some kind of shell or enclosing box should be used to protect the node from external damage
Id=S1.1.1.4
«requirement»
Robustness
Text= A GUI shall be developed in order to allow interaction with the WSN subsystem Id=S1.2.1
«requirement»
GUI
Text= Database or similar system shall be used to store the incoming data from the WSN
Id=S1.2.2
«requirement»
Storage(Log)
Text= The application shall be able to explore the available network configurability options. Id=S1.2.3
«requirement»
Network Configurability
Text= A Web Interface shall allow the end user to analyse (generate grafics/tables) of the data gathered by the network. The data of interest shall be specified in that interface. Id=S1.3.1
«requirement»
Web Interface
Text= Data should be placed on an earth browsing tool, allowing easy geo-location of the nodes’ gathered data. The current status of the network links can also be displayed for in deployment analysis.
Id=S1.3.2
«requirement»
Node Visualization (GIS)
Text= The end user should be able to run the application on most commonly used operating systems (linux, windows) Id=S1.2.4
«requirement»
Portability
Text= The end user should be able to run the services provided by the data visualization layer on most commonly used operating systems (linux, windows)
Id=S1.3.3
«requirement»
Portability
Text= The use of status representative color schemes is encouraged to allow an easy perception of the network status Id=S1.3.4
«requirement»
User Friendly
«deriveReqt»
Text= Nodes shall be programmed with a software application that develop specific functions. The nodes must be capable of delivering their messages to a central node. Id=S1.1.1.5
«requirement»
Nodes Software Application
«d er iv eR eq t» «d er iv eR eq t» «deriveReqt»
Text= A node shall run an aplication capable of receiving the data sampled by the wireless sensor network Id=S1.1.1.5.1
«requirement»
Base Station
Text= Each node, with the exception of the basestation shall be programmed with an application capable of reading the platform’s sensors Id=S1.1.1.5.2
«requirement»
Sensing Application
«deriveReqt»
3.3 Wireless Sensor Network 19
3.3
Wireless Sensor Network
The wireless sensor network layer is composed by network nodes. These nodes contain a variety of sensors. The final sub-system is a symbiosis between hardware and developed software functionalities. This sub-section details the development of the WSN layer.
3.3.1 Requirements Analysis
A list of requirements was built in order to choose the appropriate hardware (wireless nodes) and software development platform, as well as proceeding with the design and implementation of the WSN. This list is composed by hardware and software requirements. Starting with the hardware requirements:
• Programmable platform.
• Stable and mature platform, focused on stability instead of state-of-the-art hardware. • Ability to draw power from typical batteries.
• Include sensors to sample temperature, humidity and light.
• If possible, attach sensors to the node using cables (allows accurate sensor placement). • If needed, build or use an existent box to surround each node, in order to prevent damage
from possible accidents or misuse during deployments.
• Some kind of on board debugging mechanism or error monitoring mechanism should be present (for instance LEDs).
One of the main concerns to be considered when programming the motes is that they should be as configurable as possible, maintaining of course stability. This allows the end user to be able to fully explore the system without the need to recompile code. The software was developed bearing in mind the following requirements:
• Programmable state (active/inactive mote)
• Programmable sensors – which sensors sample data • Programmable sampling time
• Programmable collect time
• Positional data permanent storage algorithm • Sample time-stamping
20 System Analysis and Development
• Configuration data storing algorithm • Programmable radio listening time • Multiple wireless networks
• Scalable coding (allow easy integration of new messages and functionality)
3.3.2 Chosen Development Hardware
The TmoteSky [17] hardware platform will be used to construct the wireless network. This hardware is suitable when considering the established requirements, and it was readily available for usage. These motes have inbuilt sensors for light measurements, and optional temperature and humidity sensors. Easy integration of batteries for standalone operation can be made by soldering the appropriate connectors. Low power consumption modes can be activated to extend battery lifetime. Communication will be established between the motes using the 2.4 GHz radio frequency conforming with the IEEE802.15.4 specifications [33]. The maximum transmission rate expected to be achieved by each node’s radio is of 250Kbit/s. Quite a few software development packages are compatible with this device.
Figure 3.7: TmoteSky Platform - Picture from the TmoteSky data-sheet [17]
This platform is built with several different semiconductors instead of one single chip or pack-age. It’s a versatile design which allows for further enhancement through the use of the expansion connectors or even the repair of broken components if needed. The several components listed on the TmoteSky’s data-sheet play different roles in the node.
3.3 Wireless Sensor Network 21
At the heart of the platform there is the Texas Instruments MSP430 micro-controller. The MSP430F1611 is a 16-bit RISC CPU which has 48KB of ROM, 256 Bytes of internal flash mem-ory and 10KB of RAM. The micro-controller data-sheet mentions that it has been specifically developed for applications were low power consumption is essential. It allows five low power modes (disabling specific functions) and an active mode. The return to the active mode from any sleep mode can be made through an interrupt event. With supply voltage of 3 Volts and clocked at 1 MHz, the MSP430 consumes a maximum of 600 µA. This micro-controller can be clocked up to 8 MHz, where it normally draws 4 mA; it supports two serial communication interfaces that can function as asynchronous UART or as SPI/I2C interfaces. Two built-in 16-bit timers, 8 external ADC ports, 8 internal ADC ports, and dual 12-bit D/A converter are also available. All the other sub-components are connected to the micro-controller. The MSP430 is placed on the backside of the PCB, as it can be seen here:
Figure 3.8: TmoteSky Platform’s Microcontroller - Picture from the TmoteSky data-sheet [17]
The micro-controller could sample the sensors and send the sampled data immediately; there are however several drawbacks with this approach. In the case of a transmission failure or a system reset, the sampled data would be forever lost. The micro-controller flash memory capacity is suffi-cient for a limited number of samples. By using the external flash (ST M25P80 40MH serial code flash) it is possible for the nodes of the network to store a predefined number of samples for further collection. This allows the network to be sleeping or sampling most of the time and waking up at predefined time intervals in order to send the sampled data to the base-station. Such methodology greatly improves battery lifetime, and limits the loss of sampled data by only allowing deletion upon successful collection. The external flash has 1024KB of storage capacity; it can be also used for external code storage.
22 System Analysis and Development
Wireless functionality is provided by an 802.15.4 compliant radio: the Chipcon CC2420. The radio is connected with the MSP 430 through the SPI bus. It provides eight selectable power states. The transmission output power varies with the selected power state. The CC2420 also provides a digital received signal strength indicator and a link quality estimator. These functionalities are the founding base for establishing routes for the collection of data through the network. The Tmote has an onboard antenna, and an optional SMA antenna connector can be soldered to the board. Expected ranges that can be achieved with the onboard antenna vary from 50 meters indoors to 125 meters outdoors. To improve the transmission range the Tmotes have been soldered with SMA connectors, and generic 5 dBi antennas have been used. The transmission ranges extended from 125 meters to 200 meters outdoors(open field) when using maximum radio power.
The Hammamatsu photodiodes allow light measurement. The two photodiodes have different tasks. The conversion of light intensity onto electric current varies with wavelength; the S1087-01 has a spectral response range from 320nm to 730nm, which corresponds to the photosynthetically active radiation spectrum. The S1087 responds to the full visible spectrum and infrared (320 to 1100 nm). Both photodiodes’ package is made from ceramics, which does not allow light from the backside or the sides to reach the sensing area of the photodiode. Conversion to Lux from the output current can be achieved by analyzing the following graphic, which contains the response characteristics of the mentioned diodes and similar photodiodes:
Figure 3.9: Output Current vs Incident Light Level - From the Hammatsu S1087 data-sheet [53]
Please note however that the graphic3.9corresponds to the short circuit current. In the Tmote the photodiodes are in series with resistors, resulting in a variable voltage (figure 3.10). This voltage is then read by the 12 bit ADC ports.
3.3 Wireless Sensor Network 23
Figure 3.10: PhotoDiodes connected to MSP430 ADC Ports
V sensor = (ADCvalue ÷ 4096) × 1.5 (3.2) Isensor = V sensor/(100 × 103) (3.3) Isensor = ADCvalue÷ (100 × 103× 4096) × 1.5 (3.4) LuxFullSpectrum = 0.625 × ((104× ADCvalue) ÷ 4096) × 1.5 (3.5) LuxPhotoActive = 0.625 × ((104× ADCvalue) ÷ 4096) × 1.5 (3.6) Conversion from the ADC count to the actual voltage is made using equation 3.1. The TmoteSky’s ADC reference voltage is 1.5 Volts [17], which gives equation3.2. Finally observing figure3.10, the photodiode’s current goes through a 100kΩ resistor thereby producing equation
3.4.
The S1087 linear response seen in figure 3.9 is easily written into equation3.5 for the full spectrum and equation3.6for the photo active radiation. These formulas can be used directly on the microprocessor or in upper system layers.
This mote can be programmed through USB. The USB connector is normally used to ex-change data with a personal computer. This feature allows any mote with the appropriate program to become a base-station by simply connecting it to a computer. The TmoteSky has expansion connectors that allow direct access to the micro-controllers ADC ports, I2C port or the USART. An array of 3 LEDs, a reset and a user interrupt button are also available.
The Sensirion SHT11 is a small size, relative humidity and temperature digital sensor. It comes fully calibrated from factory and it interfaces with the micro-controller through a bidirectional two wire serial interface. The data-sheet also mentions that this sensor has been specifically designed for platforms that require low power consumption.
At 25oC this device has a temperature accuracy of ± 0.4oC and a (relative) humidity accuracy of ± 3%. The temperature sensor has a typical resolution of 0.01oC, the response range starts at -40oC and ends at 123.8oC, whereas for the relative humidity one has a typical resolution of 0.03% RH and a response range starting at 0% and ending at 100% RH. Accuracy varies within each sensor’s response range.
The SHT11 has a default measurement resolution of 14 bits for the temperature and 12 bits for the relative humidity. The SHT11 data-sheet shows the conversion formula between the raw values and values represented in SI units. The formula’s coefficients vary with supply voltage and
24 System Analysis and Development
Figure 3.11: Accuracy Charts - From the SHT11 data-sheet [1]
resolution.
TCelsius = −39.60 + 0.01 × RawTValue (3.7) HRel = −4 + 0.0405 × RawHValue+ (−2.8 × 10⁻⁶) × RawHValue2 (3.8) HComp = ((TCelsius− 25) × (0.01 + 8 × 10⁻⁵) × RawHValue) + HRel (3.9)
By considering the default resolution for both sensors, and that on the TmoteSky this sensor is supplied by 3 volts, the conversion formula for the temperature is given by equation3.7. Similarly to this, the conversion formula for the relative humidity is defined by equation3.8. The sensor’s humidity reading needs to be compensated for temperatures significantly different from 25oC, which can be done by considering formula3.9. Two internal sensors are available on the MSP430, an internal voltage monitor sensor and an uncalibrated thermistor. Both are sampled using the CPU’s internal 12 bit ADC channel. The TmoteSky data-sheet formula provides the following conversion formulas:
VoltageSensor = (VADCvalue÷ 4096) × 1.5 (3.10) InternalTemperature = ((TADCvalue÷ 4096) × 1.5 − 0.986) ÷ 0.00355 (3.11)
The optional sensors come, by default, soldered directly on the TmoteSky circuit board. This poses a certain inconvenient, for instance when trying to measure surface temperature. To solve this problem, the SHT11 devices were purchased separately and soldered to small printed circuit boards.
![Figure 3.7: TmoteSky Platform - Picture from the TmoteSky data-sheet [17]](https://thumb-eu.123doks.com/thumbv2/123dok_br/16010209.1103789/38.892.185.658.611.943/figure-tmotesky-platform-picture-tmotesky-data-sheet.webp)
![Figure 3.8: TmoteSky Platform’s Microcontroller - Picture from the TmoteSky data-sheet [17]](https://thumb-eu.123doks.com/thumbv2/123dok_br/16010209.1103789/39.892.245.661.489.783/figure-tmotesky-platform-microcontroller-picture-tmotesky-data-sheet.webp)