Integrated Master in Bioengineering
Environmental benefits of Chlorella vulgaris and
Pseudokirchneriella subcapitata
CO
2capture and bioenergy production
Dissertation for Master Degree in Biological Engineering
Ana Luísa da Cunha Gonçalves
Supervisors: Manuel José Vieira Simões (Ph.D.) José Carlos Magalhães Pires (Ph.D.)
Acknowledgements
I am grateful to my supervisors Manuel Simões (Ph.D.) and José Carlos Pires (Ph.D.), for introducing me this research topic and then providing me the necessary support.
I also acknowledge: i) the Faculty of Engineering of University of Porto, Chemical Engineering Department, and Laboratory for Process, Environmental and Energy Engineering (LEPAE) for providing all the necessary facilities to perform this study; ii) the CIIMAR (Centre of Marine and Environmental Research of the University of Porto), for providing one of the microorganisms used in this study, the cyanobacterium Synechocystis sp.
I am also very grateful to all the researchers from Laboratory E007, especially to Carla Ferreira, who has supported me in different tasks of my work. I cannot forget also the support of the technicians Paula Pinheiro and Sílvia Faia, which was essential for the development of this work.
I acknowledge also my friends Inês and Catarina for being my support everytime I needed during these five years and for their friendship. I even thank my coleagues in the laboratory, Ana Catarina and Chico, for their support, help, and kindness. I have also to thank all the other friends that have showed to be very important in this phase, for their funny company at lunch time and coffee breaks and for all the support given: João Pedro, Carolinas, Soraia, Mariana, Natacha, Diogo, Andrés, and Luísa. For all of them I say: Thank you, very much!
Finally, I would like to thank my Mother and also Adélia, António, Guida and Vítor for the support, patience and encouragement showed during this period.
Abstract
The increase of anthropogenic CO2 emissions has been causing several environmental
problems, due to the accumulation of this pollutant in atmosphere, the main responsible for the greenhouse effect and global warming. The search for effective systems to capture CO2, has
revealed the potential of microalgae to effectively perform this task. Apart from their application in carbon dioxide removal, these photosynthetic organisms are able to produce a wide variety of compounds that can have different utilities in diversified areas. Although many studies have focused on the use of microalgae as an effective biological method for CO2 sequestration, further
research is required to increase biomass productivities and to reduce production costs.
In this study, different applications of microalgae were exploited using the species Chlorella vulgaris and Pseudokirchneriella subcapitata: i) to verify the effect of light intensity, photoperiods, and medium composition on microalgal growth, allowing to infer the best culture conditions for CO2 uptake; ii) to evaluate lipid productivities from microalgae grown under
different light intensities and photoperiods using a colorimetric method; and iii) to study the ecological interaction between the microalga P. subcapitata and the cyanobacterium Synecchocystis sp.
Results have shown that increasing light intensities leads to an increase in biomass production. However, continuous light supply and higher light intensities (between the range studied) leads to cell damage due to the photooxidation phenomenon. In general, higher nutrient concentration results in higher biomass productivities. It was observed that lipid productivities also increased with light intensity. However, higher light intensities studied were apparently responsible for the degradation of fatty acids, a consequence of photooxidation too. Mixed cultures of the organisms P. subcapitata and Synecchocystis sp. revealed that P. subcapitata has higher ability to uptake inorganic phosphorus even at low concentrations, being suitable for wastewater treatment. Furthermore, the study of surface properties of these organisms has shown that further research in this field is required, as it seems that the interactions between these organisms may be very useful in biotechnological processes, such as the production of biomolecules, biofilm formation or harvesting techniques (bio-flocculation).
Key-words: Chlorella vulgaris, Pseudokirchneriella subcapitata, CO2 capture, Lipid
Table of contents
Acknowledgements ... iii
Abstract ... v
Table of contents ... vii
List of figures ... xi
List of tables ... xiii
Nomenclature ... xv
1. Work outline ... 1
1.1. Background and project presentation ... 1
1.2. Main objectives ... 2 1.3. Thesis organization ... 3 2. Literature review... 5 2.1. Microalgae ... 5 2.2. Applications of microalgae... 6 2.3. Microalgal cultivation ... 6 2.3.1. Closed photobioreactors ... 7 2.3.2. Open ponds ... 8
2.4. Downstream processing of microalgae ... 9
2.4.1. Harvesting ... 9
2.4.2. Drying ... 11
2.4.3. Cell disruption and extraction of microalgal metabolites ... 12
2.4.4. Biodiesel production ... 14
3. The effect of light supply and medium composition on CO2 capture ... 17
3.1. Introduction ... 17
3.2. Materials and methods ... 18
3.2.1. Microorganisms and culture medium ... 18
3.2.2. Experimental setup ... 19
3.2.3. Analytical methods ... 20
3.2.4. Quantification of extracellular proteins and polysaccharides ... 20
3.2.5. Kinetic parameters ... 21
3.4. Conclusions ... 29
4. Effect of light supply on lipid production ... 31
4.1. Introduction ... 31
4.2. Materials and Methods ... 32
4.2.1. Microorganisms cultivation and harvesting ... 32
4.2.2. Standard curves ... 33
4.2.3. Saponification of cellular lipids ... 33
4.2.4. Lipid extraction and colorimetric detection ... 33
4.2.5. Statistical analysis ... 34
4.3. Results and discussion ... 34
4.4. Conclusions ... 37
5. Interactions between microalgae and cyanobacteria: kinetic modeling and surface interactions ... 39
5.1. Introduction ... 39
5.2. Materials and methods ... 40
5.2.1. Microorganisms and culture medium ... 40
5.2.2. Growth under different Pi concentrations ... 41
5.2.3. Analytical methods and kinetic parameters ... 42
5.2.4. Quantification of extracellular proteins and polysaccharides ... 42
5.2.5. Zeta potential measurements ... 42
5.2.6. Surface contact angles ... 43
5.2.7. Surface hydrophobicity ... 43
5.2.8. Statistical analysis ... 44
5.3. Results and discussion ... 44
5.4. Conclusions ... 49
6. Concluding remarks and research needs ... 51
6.1. General conclusions ... 51
6.2. Research needs ... 52
References ... 53 Annexes ... A.1 A.1. Calibration curves optical density versus biomass concentration ...A.1 A.2. Bradford reagent ...A.1 A.2.1. Composition ...A.1 A.2.2. Preparation...A.2
Table of contents
A.3. Calibration curve for protein quantification... A.2 A.4. DNS reagent ... A.2 A.4.1. Composition ... A.2 A.5. Calibration curve for polysaccharides quantification ... A.3 A.6. The effect of light intensity on microalgal growth through Monod model ... A.3 A.7. Calibration curves for lipid quantification ... A.6
List of figures
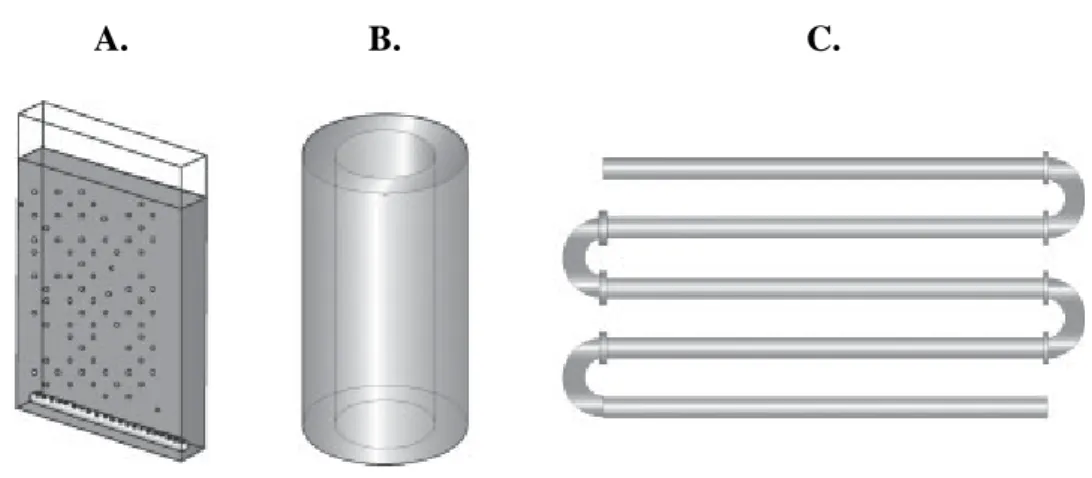
Figure 2.1. Most common PBR geometries: A. flat plate reactor; B. bubble-column reactor; C. tubular reactor (Posten, 2009). ... 8 Figure 3.1. Microscopic photographs of the microalgae C. vulgaris (A) and P. subcapitata (B) taken from a Leica DM LB2 microscope (Leica Microsystems, Germany) incorporated with a DFC300 FX camera and the acquisition software IM50. Photographs were obtained using a 100× oil immersion objective. ... 18 Figure 3.2. Experimental unit for microalgal growth. ... 19 Figure 3.3. Growth curves of C. vulgaris grown in M1 (A, C and E) and in M2 (B, D and F) for
different light conditions: light intensity (36, 72, 96 and 126 µE m-2 s-1) and photoperiod (10:14 – A and B; 14:10 – C and D; 24:0 – E and F). Values are presented as the mean ± s.d. of two independent experiments. ... 23 Figure 3.4. Growth curves of P. subcapitata grown in M1 (A, C and E) and in M2 (B, D and F)
for different light conditions: light intensity (36, 72, 96 and 126 µE m-2 s-1) and photoperiod (10:14 – A and B; 14:10 – C and D; 24:0 – E and F). Values are presented as the mean ± s.d. of two independent experiments. ... 24 Figure 4.1. Lipid yields in mg g-1 CDW determined for C. vulgaris (A) and P. subcapitata (B) under different light intensities and different photoperiods. Values are presented as the mean ± s.d. of two independent experiments. ... 35 Figure 5.1. Microscopic photographs of the cyanobacterium Synechocystis sp. (A) and the microalga P. subcapitata (B) taken from a Leica DM LB2 microscope (Leica Microsystems, Germany) incorporated with a DFC300 FX camera and the acquisition software IM50. Photographs were obtained using a 100× oil immersion objective. ... 41 Figure 5.2. Model fit of Monod equation to the experimental data for Synechocystis sp. and P.
subcapitata in single cultures (A and B) and in mixed cultures (C and D). ... 46
Figure A.1. Calibration curve of OD683 as a function of biomass concentration, in g L-1, for C.
vulgaris and P. subcapitata. ... A.1
Figure A.2. Calibration curve of absorbance at 595 nm as a function of BSA concentration in g L-1. ... A.2 Figure A.3. Calibration curve of absorbance at 540 nm as a function of glucose concentration in g L-1. ... A.3
Figure A.4. Model fit of Monod equation to the experimental data for C. vulgaris grown in M1
(A, C and E) and in M2 (B, D and F) for different photoperiod (10:14 – A and B; 14:10 – C and
D; 24:0 – E and F). ... A.4 Figure A.5. Model fit of Monod equation to the experimental data for P. subcapitata grown in M1 (A, C and E) and in M2 (B, D and F) for different photoperiod (10:14 – A and B; 14:10 – C
and D; 24:0 – E and F). ... A.5 Figure A.6. Calibration curve of absorbance at 440 nm as a function of fatty acids concentration in mg L-1 for different long-chain fatty acids. ... A.6 Figure A.7. Calibration curve of absorbance at 440 nm as a function of fatty acids concentration in mg L-1 using an average of extinction coefficients obtained for each long-chain fatty acid. . A.6
List of tables
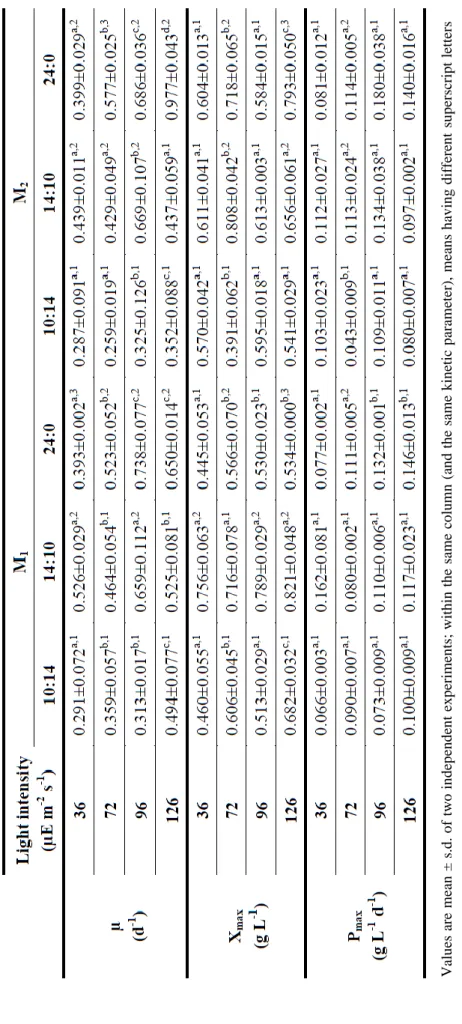
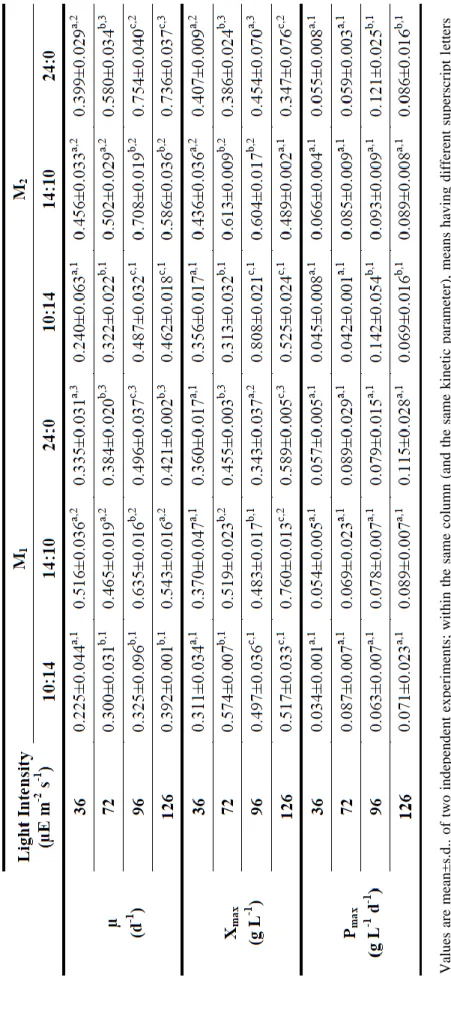
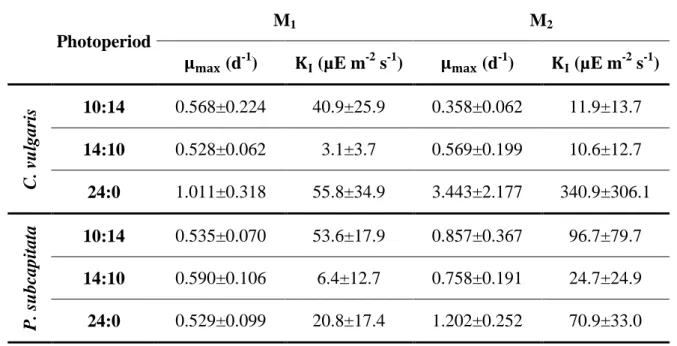
Table 2.1. Principal advantages and disadvantages of the most commonly used harvesting methods ... 10 Table 3.1. Kinetic parameters for cultures of C. vulgaris using different nutrient concentrations and light conditions ... 26 Table 3.2. Kinetic parameters for cultures of P. subcapitata using different nutrient concentrations and light conditions ... 27 Table 3.3. Monod model parameters of microalgal growth: maximum specific growth rates, (m, d-1) and half saturation constants, (a, µg L-1). Values are presented as the mean ± s.d. of two independent experiments ... 28 Table 4.1. Lipid yields in mg g-1 CDW and specific growth rates in d-1 obtained for C. vulgaris and P. subcapitata obtained for different light intensities and different photoperiods. Values are presented as the mean ± s.d. of two independent experiments... 36 Table 5.1. Specific growth rates (d-1) for different Pi concentrations (µg L-1) for single and
mixed cultures of Synechocystis sp. and P. subcapitata. Values are presented as the mean ± s.d. of two independent experiments ... 44 Table 5.2. Kinetic parameters determined by Monod model for both Synechocystis sp. and P.
subcapitata in single and mixed cultures: maximum specific growth rates (m, d-1), half saturation constants, (a, µg L-1), and affinities (m/a). Values are presented as the mean ± s.d. of two independent experiments ... 47 Table 5.3. Zeta potential (mV), contact angles (in degrees) with water (θW), formamide (θF), and
α-bromonaphtalene (θB), surface tension parameters, and hydrophobicity ( ) between two
entities of the surface (s) when immersed in water (w). Values are presented as the mean ± s.d. of three independent experiments ... 48 Table A.1. Composition of the Bradford reagent (Bradford, 1976) ... A.1 Table A.2. Composition of the DNS reagent (Miller, 1959) ... A.3
Nomenclature
Abbreviations
TFA Total fatty acids
ACCase Acetyl-CoA carboxylase BSA Bovine serum albumin CDW Cell dry weight
DNS Dinitrosalicylic acid FA Fatty acids
FFA Free fatty acids GHG Greenhouse gas IL Ionic liquid
MAE Microwave assisted extraction OD Optical density
Pi Inorganic phosphorus
PBR Photobioreactor PEF Pulsed electric field s.d. Standard deviation
SCCO2 Supercritical fluid extraction using CO2
TEA Triethanolamine TFF Tangent flow filtration UAE Ultrasonic assisted extraction
DLVO Derjaguin-Landau-Verwey-Overbeek
XDLVO Extended Derjaguin-Landau-Verwey-Overbeek
Indexes
max Maximum
sws Between two entities of a given surface, when immersed in water
l Liquid
LW Lifshitz-van der Waals component AB Lewis acid-base component
+ Electron acceptor parameter of the Lewis acid-base component ( ) - Electron donor parameter of the Lewis acid-base component ( )
F Formamide
W Water
B α-bromonaphtalene
Measure units
µ Specific growth rate d-1
X Biomass concentration g L-1
t Time d
P Biomass productivity g L-1 d-1
KI Half saturation constant µE m-2 s-1
I Light intensity µE m-2 s-1
KP Half saturation constant µg L-1
[P] Phosphate concentration µg L-1
A Affinity L µg-1 d-1
∆G Free energy of interaction mJ m-2
γ Surface free energy mJ m-2
CHAPTER 1
1.
Work outline
1.1. Background and project presentation
The continuous use of fossil fuels as the major source of energy has led the world to an energy and environmental crisis, due to the depletion of this source of energy and the increase of exhaust gases emissions that accumulate in the atmosphere and cause global warming. The search for sustainable sources of energy has showed that producing biodiesel from vegetable oil crops, such as palm, rapeseed, and soybean, and animal fats could be a promising alternative (Amaro et al., 2011; Demirbas, 2011; Lee et al., 2010; Ranjan et al., 2010). However, oil production yields from vegetable crops and animal fats do not achieve the current demand for transport fuels (Chisti, 2007; Demirbas, 2011). Furthermore, producing biodiesel from vegetable crops is time consuming and requires great areas of arable land that would compete with the one used for food crops, leading to starvation in developing countries (Costa & de Morais, 2011; Demirbas, 2011; Demirbas & Demirbas, 2011).
Due to these limitations, attentions are now focused on using microalgae. When growing autotrophically, microalgae assimilate CO2 and produce biomass and other compounds, such as
lipids, that can be used to produce biodiesel. Through photosynthesis, microalgae also assimilate other nutrients, such as nitrogen and phosphorus, which can be obtained, for example, from wastewater (Carvalho Júnior et al., 2011). Apart from their uses in the production of biodiesel, microalgal biomass can have a lot of different applications. The combination of CO2 uptake with
effluent treatment, as well as the synthesis of various products of commercial value provides a promising alternative to actual biodiesel production techniques (Carvalho Júnior et al., 2011; Chisti, 2007). Additionally, microalgae present several advantages over oil crops, including (Chisti, 2007; Clarens et al., 2010; Lee et al., 2010; Mercer & Armenta, 2011): i) higher lipid contents – oil levels of 20-50% by weight of dry biomass are common in several microalgae; ii) higher growth and biomass production rates – normally microalgae double their biomass within 24 hours; iii) shorter maturity rates; iv) require far less land, thus not compromising food production and supply.
1.2. Main objectives
The main aim of this study is to evaluate the potential of the microalgae Chlorella vulgaris and Pseudokirchneriella subcapitata in environmental applications, such as CO2 capture and
bioenergy production.
To evaluate the ability of these microalgae to efficiently capture CO2 from the atmosphere,
different experiments should be performed to determine the more appropriate conditions that lead to higher biomass productivities. In this sense, both microalgae were grown in flasks with the same volume and the following assays were carried out: i) batch experiments were performed for both microalgae using the same experimental conditions (working volume, temperature, pH, light intensity, photoperiod and culture medium); ii) different light intensities, photoperiods and concentrations of the culture medium were applied, to determine the best growth conditions; iii) cell growth and kinetic parameters were evaluated by daily monitoring optical density (OD) at 683 nm.
As microalgae are a great source of a wide variety of compounds, it is also an objective to evaluate if these organisms have the ability to produce compounds of interest, such as proteins and polysaccharides in the tested conditions. The presence of extracellular proteins and polysaccharides in microalgal cultures was studied by applying the Bradford (1976) and Miller (1959) methods, respectively.
Another aim of this study is the determination of oil contents of these microalgae and the effect of different light intensities and photoperiods on lipid yields. Quantification of intracellular lipids was performed using a colorimetric method, to determine the growth conditions that increase lipid yields.
It will also be studied the interaction between the microalga P. subcapitata and the cyanobacterium Synechocystis sp. These interactions were determined by growing these organisms together and analyzing physicochemical properties of microalga and cyanobacterium surface (zeta potential and hydrophobicity). These experiments give information about the behavior of these organisms when growing together and under stress conditions and also about their ability to adhere to different surfaces, which can be very useful for application of these organisms in wastewater treatment or in a technological process called bio-flocculation. In this area, the following assays were realized: i) batch experiments were performed for both organisms in separate flasks and also mixed cultures using the same experimental conditions; ii) a stress condition (in this case, limited phosphorus concentration) was induced to verify the response of the organisms; iii) cell growth and kinetic parameters were evaluated by cell
Work outline
counting; iv) zeta potential and hydrophobicity of each organism’s surface were determined as major characteristics of physicochemical cell surface properties.
1.3. Thesis organization
This work is divided in six chapters. Chapter 1 presents the main goals, context, and motivations for the development of this study. It consists in a guideline for the overall work presented in the further chapters.
Chapter 2 provides a brief review of the literature. Characteristics of microalgae, as well as the major applications are described. The main technologies applied in microalgal cultivation and downstream processing are also referred in this chapter.
Chapter 3 focuses the effect of light intensity, photoperiod, and growth medium concentrations on the ability of C. vulgaris and P. subcapitata to capture CO2 from the
atmosphere. Batch experiments were carried out with synthetic wastewater at room temperature with artificial illumination and all the cultures were aerated with CO2 at atmospheric
concentration.
Chapter 4 shows how different light supplies can affect lipid productivities of the microalgae C. vulgaris and P. subcapitata. Lipid contents were determined using a colorimetric method, to easily determine in which conditions these microalgae have higher lipid productivities.
Chapter 5 provides the study of the interaction of the microalga P. subcapitata with the cyanobacterium Synechocystis sp. when grown under limiting phosphorus concentrations with physicochemical characterization of their surface.
Chapter 6 presents an overview of all the developed work, with emphasis on the main conclusions and on the perspectives for further research.
CHAPTER 2
2.
Literature review
This chapter focuses on the major applications of microalgae, with emphasis on the technological processes associated with CO2 removal and bioenergy production.
2.1. Microalgae
Microalgae are prokaryotic or eukaryotic photosynthetic microorganisms that can be found in aquatic or terrestrial ecosystems (Gouveia, 2011; John et al., 2011; Mata et al., 2010). The number of microalgal species is not known, but in some references the numbers estimated round the 200 000 to some millions of species (Norton et al., 1996).
Due to their unicellular or multicellular simple structure, microalgae have a photosynthetic mechanism similar to land-based plants; they can grow rapidly and in a wide variety of environmental conditions. Furthermore, being submerged in an aqueous environment allow microalgae to easily access to water, CO2 and other nutrients, thus converting more efficiently
solar energy into biomass (Gouveia, 2011; John et al., 2011).
These organisms are classified in different groups, according to some parameters like morphologic characteristics, cell wall and photosynthetic pigments composition, and chemical nature of their by-products (Brennan & Owende, 2010; Tomaseli, 2004). Prokaryotic cells, known as cyanobacteria (Cyanophyceae), resemble more to bacteria rather than algae. They do not have membrane-bound organelles, such as plastids, mitochondria, nuclei, Golgi bodies and flagella. Examples of eukaryotic microalgae include green algae (Chlorophyta), red algae (Rhodophyta) and diatoms (Bacillariophyta). These organisms have the above mentioned organelles, which are responsible for cell control, reproduction and survival (Brennan & Owende, 2010; Mata et al., 2010).
Microalgae are autotrophic organisms: they reproduce themselves using photosynthesis, requiring only inorganic compounds such as CO2 to convert solar light energy into chemical
energy (Brennan & Owende, 2010; Mata et al., 2010). However, some microalgal species are also able to use exogenous organic nutrients as energy source. These algae are known as mixotrophic, as they can grow both autotrophic or heterotrophically (Brennan & Owende, 2010).
2.2. Applications of microalgae
Due to its high biomass productivity and to the ability to perform photosynthesis, biological conversion of light energy into chemical energy in the form of organic carbon compounds (Falkouski & Raven, 2007), microalgae have numerous applications in diversified areas (Brennan & Owende, 2010; Mata et al., 2010; Spolaore et al., 2006).
Through photosynthesis, microalgae are able to assimilate CO2 from the atmosphere, as
well as from flue gas emissions, thus reducing the risk of exhaust gases accumulations in atmospheric air (Ho et al., 2011; Tang et al., 2011). Additionally, these photosynthetic organisms assimilate other compounds, such as nitrogen and phosphorus. These nutrients are frequently found in wastewaters, meaning that microalgae can be a promising alternative in wastewater treatment (Rawat et al., 2011; Silva-Benavides & Torzillo, 2012). Furthermore, microalgal biomass can have a lot of applications, in such different areas (Mata et al., 2010; Parmar et al., 2011; Spolaore et al., 2006). Algal biomass is suitable for human food and animal feed, as they are an important source of natural vitamins, minerals and fatty acids. They can be used to feed different animals, such as cats, dogs, aquarium fish, birds, horses and cows (Hu, 2004; Spolaore et al., 2006). A lot of high-valued compounds from microalgae, like pigments, antioxidants, β-carotenes, proteins, polysaccharides, triglycerides, fatty acids and vitamins, can be used as raw materials for the production of cosmetics, drugs and functional food (Hu, 2004; Mata et al., 2010; Singh et al., 2005). The fatty acids produced by microalgae can be extracted and used for biodiesel production and products such as proteins and residual biomass can be fermented to produce ethanol or methane (Brennan & Owende, 2010; John et al., 2011; Parmar et al., 2011).
2.3. Microalgal cultivation
Autotrophic cultivation of microalgae requires light supply, CO2, water, and inorganic
salts. Several variables are known for their influence in the cultivation process: light distribution and saturation, temperature, pH, salinity, quality and amount of nutrients, concentration of dissolved oxygen, and toxicity of the medium, which is mainly due to the presence of heavy metals (Chisti, 2007; Eriksen, 2008; Pires et al., 2012). Microalgal growth medium requires the presence of the inorganic elements that constitute algal cells: nitrogen, phosphorus, and iron. Marine microalgae are commonly grown in sea water supplemented with nitrate and phosphate fertilizers, whereas other microalgae can be cultivated in wastewaters, thus reducing cultivation costs and providing wastewater treatment (Molina Grima et al., 1999). CO2 from the atmosphere
or from flue gas emissions should be supplied continuously during light periods, thus enabling carbon dioxide mitigation. Alternatively, light must be supplied using solar light, artificial light,
Literature review
or both. Microalgae cultivation can be carried out in closed systems, where culture conditions are strictly controlled, or in open systems.
2.3.1. Closed photobioreactors
Using closed photobioreactors (PBRs) for microalgal growth can be more advantageous, as culture conditions and growth parameters, such as pH, temperature, mixing, CO2 and O2 concentrations are strictly controlled; evaporation and contaminations can be
easily avoided, and higher cell concentrations can be achieved. Despite these advantages, PBRs have some limitations in terms of overheating, difficulties in scale-up, and higher costs of construction (Posten & Schaub, 2009). The most commonly used PBRs include flat plate reactors, bubble-column reactors, and tubular reactors (Posten, 2009; Ugwu et al., 2008; Xu et al., 2009). A schematic representation of these geometries is shown in Figure 2.1.
Flat plate PBRs are known for their large illumination surface area (Ugwu et al., 2008; Xu et al., 2009). Higher biomass productivities are achieved with these PBRs, which make them suitable for outdoor cultures. Additionally, the use of flat plate bioreactors is very good for immobilization of microalgae (Ugwu et al., 2008). Accumulation of dissolved oxygen is relatively low, when compared with horizontal tubular reactors. In terms of costs and operating/maintenance conditions, these reactors are relatively cheap, easy to clean-up and readily tempered (Lee, 2001; Ugwu et al., 2008; Xu et al., 2009). The main disadvantages of flat plate bioreactors include difficulties in scale-up, due to the requirement of many compartments and support materials, and difficulties in temperature control (Lee, 2001; Ugwu et al., 2008).
Bubble-column PBRs have been extensively used in bioprocessing, wastewater treatment, and in chemical process industry (Xu et al., 2009). Generally, bubble-column reactors are vertical and compact – requiring less land, relatively cheap, and easy to operate. The high mass transfer coefficient and extremely low physical stress obtained in these reactors make them suitable for microalgal culture, especially for aquaculture (Sánchez Mirón et al., 2000; Xu et al., 2009). The main problems posed by these reactors are high energy costs associated to mass circulation, the possibility of cell sedimentation, and difficulties in scale-up, as an increase in column diameter causes an exponential decrease in light penetration (Xu et al., 2009).
The majority of tubular PBRs is made of transparent plastic or glass and consists in the arrangement of tubes to form a straight, coiled, or looped pattern. Microalgae are recirculated
A. B. C.
Figure 2.1. Most common PBR geometries: A. flat plate reactor; B. bubble-column reactor; C.
tubular reactor (Posten, 2009).
along the tubes using a pump or airlift technology (Ugwu et al., 2008; Xu et al., 2009). Tubular bioreactors can be horizontal, near horizontally, conical, and inclined (Ugwu et al., 2008). The large illumination surface area of these systems is ideal for outdoor culture of microalgae. Additionally, these reactors are low-cost and high biomass productivities can be achieved (Ugwu et al., 2008; Xu et al., 2009). The main problem associated with the use of tubular reactors is the poor mass transfer, which poses several difficulties, especially in terms of scale-up (Molina Grima et al., 2001). Some operational conditions are difficult to control due to temperature oscillations, formation of pH gradients along the tubes, and accumulation of high O2 concentrations. Using these reactors also requires larger areas of land (Molina
Grima et al., 2001; Ugwu et al., 2008; Ugwu et al., 2003).
2.3.2. Open ponds
In the past few years, cultivation of microalgae using open systems has been extensively studied. These systems can be divided into two categories: natural ponds, which include lakes, lagoons, and ponds, and artificial ponds or containers (Lee, 2001; Ugwu et al., 2008). The most commonly used systems include shallow big ponds, tanks, circular ponds and raceway ponds (Lee, 2001; Parmar et al., 2011; Ugwu et al., 2008).
Microalgae production in open systems is less expensive in terms of construction and operation and has larger production capacity (Borowitzka, 1999; Posten & Schaub, 2009; Pulz, 2001). Biomass productivities achieved with these systems are lower than those achieved with closed PBRs, which is mainly due to insufficient mixing, oscillations in the culture conditions, and higher susceptibility to the co-existence of other organisms that act as competitors and predators. Additionally, it is common in these systems the diffusion of CO2
Literature review
to the atmosphere, evaporative losses of water, and poor light utilization by cells (Lee, 2001; Posten & Schaub, 2009; Pulz, 2001; Ugwu et al., 2008).
2.4. Downstream processing of microalgae
Producing biofuels or other compounds from microalgal metabolites and biomass requires a set of processes that include harvesting of biomass, dewatering and drying, and also extraction and purification of the metabolites of interest. As one of the aims of this work is bioenergy production using microalgae, the following sections will emphasize the downstream processes involved in the recovery of microalgal metabolites, with focus on biodiesel production from microalgal lipids.
2.4.1. Harvesting
Cell harvesting consists in the separation of algal cells from the culture broth using one or more solid-liquid separation procedures. Since microalgae have small sizes, ranging from 3 to 30 μm, and after the cultivation step cell densities are very low (0.3-5.0 g L-1), recovery of algal biomass can be very difficult and cost-effective (Molina Grima et al., 2003; Uduman et al., 2010). To reduce costs, cell harvesting often occurs in a two-step process: i) bulk harvesting, where biomass is firstly separated from the bulk suspension by the processes of flocculation, flotation, or gravity sedimentation, reaching a final concentration of about 2-7% total solid matter; ii) thickening, where algal cells are further concentrated through centrifugation or filtration, resulting in a paste of 15-25% total solid matter (Olaizola, 2003). Selection of the adequate harvesting technique depends on some parameters, such as cell size and density, value of target product, biomass concentration, and culture conditions (Brennan & Owende, 2010; Olaizola, 2003; Uduman et al., 2010). The major techniques used for cell harvesting include centrifugation, filtration, and flocculation (Molina Grima et al., 2003; Oh et al., 2001; Rossignol et al., 1999). Table 2.1 shows the main advantages and disadvantages of the referred harvesting methods.
In centrifugation, solid particles suspended in the liquid phase are allowed to deposit by the action of centrifugal forces. Among the different harvesting methods, centrifugation is the preferred one, as it has the ability to process large volumes relatively faster than other methods and to produce concentrates that remain fully contained during recovery (Molina Grima et al., 2003; Pires et al., 2012; Sim et al., 1988). However, this method presents several disadvantages, including: i) the possibility to damage cells due to the high shear stress forces
Table 2.1. Principal advantages and disadvantages of the most commonly used harvesting methods
Harvesting method Advantages Disadvantages Centrifugation
High biomass recovery
High capacity
Fast
High costs
Cell damage
Filtration Low cost
Slow process
Possibility of fouling
Possibility of cell damage
Flocculation
Simple and fast
Low cost
Recycling of the clarified culture medium
Toxicity of flocculants
Some flocculants are very expensive
involved; ii) energy demanding; and iii) relatively expensive (Knuckey et al., 2006; Lee et al., 2009; Sim et al., 1988). For these reasons, it is thought that centrifugation is ideal for the recovery of high-valued products (Lee et al., 2009; Molina Grima et al., 2003). Furthermore, centrifugation is not suitable to harvest microalgae from a saline medium because salt concentration is responsible for an increase in corrosion (Pires et al., 2012).
In the filtration process, the suspension is allowed to pass through a membrane, where the solid particles are retained. This is a low-cost process, but it is not appropriate for processing large volumes, as it is very slow. Additionally, the use of filter presses strongly depends on cell size. It is suitable for the recovery of large cells, such as Coelastrum prosboscideum and Spirulina platensis, but it is not able to retain cells whose diameter is similar to that of bacteria like Scenedesmus, Dunaliella, and Chlorella (Molina Grima et al., 2003). Another bottleneck of this method is the accumulation of matter in the filtering membrane (fouling), which is responsible for a reduce in the permeability of these filters, diminishing process velocity and efficiency (Rossi et al., 2004). As well as in the centrifugation process, the shear forces reached in filtration can cause damage to some cells (Jaouen et al., 1999). For this reason, it is common to apply tangent flow filtration (TFF), such as microfiltration or ultra-filtration, to harvest microalgal biomass. In TFF processes, the bulk flow is parallel to the membrane and perpendicular to the permeation flux, reducing shear stress forces involved (Pires et al., 2012; Rossignol et al., 1999).
Flocculation occurs when suspended particles interact with flocculants and aggregate in large flocks that settle to the bottom of the tank owing to gravitational and fluid drag forces (Harith et al., 2009; Knuckey et al., 2006). This method has been successfully applied in the clarification of wastewater and drinking water and color removal in paper industry and is
Literature review
appropriate for the harvesting of large particles, such as microalgal cells (Harith et al., 2009). It is a simple and fast process and has reduced costs, when compared with other solid-liquid separation methods (Harith et al., 2009; Knuckey et al., 2006; Molina Grima et al., 2003). There are three different types of flocculation: chemical flocculation, bio-flocculation, and electro-flocculation. The most commonly used flocculants are aluminum sulfate, aluminum chloride, and ferric chloride. To select the most appropriate flocculant, it is important to clearly define the aim of the separation process and to ensure that the flocculant will not pose problems in the downstream processing of microalgal biomass. Furthermore, flocculants applied should be cheap, effective even for low flocculant concentrations, and non-toxic (Lee et al., 2009; Oh et al., 2001; Rossignol et al., 1999).
2.4.2. Drying
After harvesting of biomass, water content in microalgal paste is still very high, which difficults the choice for a cost-effective dewatering process. The main drying processes used for microalgal biomass include sun-drying, spray-drying, and freeze-drying (Molina Grima et al., 2004).
Sun-drying is the dewatering process that is applied to the majority of crops. This is a low-cost process, but the high water content present in the biomass is responsible for a huge increase in drying times. In addition, this method requires large drying surfaces (Desmorieux & Decaen, 2005; Molina Grima et al., 2004; Prakash et al., 1997). Due to the highest demand for food and fuels verified in the last decades, this method is not suitable when the final aim of biomass is the production of food and bioenergy (Molina Grima et al., 2004).
In spray-drying, atomizers or gas-liquid jets are used to form a fine spray of solution droplets, which are brought into continuous contact with hot air in a large chamber. These systems have several advantages: i) continuous operation; ii) the final product (powder) does not require further size reduction; and iii) rapid drying. However, this is a high costly method, implying that it is only suitable for the recovery of high-valued products (Leach et al., 1998).
In freeze-drying or lyophilization, algal biomass is frozen and the ice crystals sublimed by slight warming without thawing. Lyophilization comprises three steps: i) freezing to solidify the material; ii) sublimation drying to reduce moisture to below 20% w/w; and iii) desorption to reduce bound moisture to the required final value (≈ 1% w/w) (Snowman, 1996). This drying method has high equipment and energetic costs, being suitable for fine applications, where it is important to keep biochemical properties of the biomass constant.
However, it is a fast and efficient process for water removing (Brennan & Owende, 2010; Molina Grima et al., 2004).
2.4.3. Cell disruption and extraction of microalgal metabolites
There are several methods described for the extraction of microalgal metabolites, those being enzymatic extraction, pulsed electric field extraction (PEF), ultrasound and microwave assisted extraction (UAE and MAE), expeller press extraction, organic solvent extraction, supercritical fluid extraction (Amaro et al., 2011; Mercer & Armenta, 2011; Taher et al., 2011), and ionic liquid mediated extraction (Kim et al., 2011). The referred extraction procedures can be divided into three groups: i) those that can be applied directly after the harvesting process; ii) those that are strongly affected by the presence of water, requiring previous drying; and iii) those that can be applied to both wet and dried biomass. Extraction procedures, such as enzymatic and pulsed electric field, can be applied directly to the harvested microalgal paste (containing about 15-25% total solid matter), without further dewatering. UAE, MAE, and expeller press extraction are examples of extraction procedures that can be applied to both wet and dried biomass. The extraction procedures that require previous drying include organic solvent extraction, supercritical fluid extraction, and ionic liquid mediated extraction.
Enzymes can be applied in the extraction metabolites from microalgae, as they can mediate the hydrolysis of cell walls, facilitating the release of their contents into an appropriate solvent. Enzymes can be applied directly to wet biomass and their application with little volumes of organic solvents can improve recovery yields, as well as extraction times (Mercer & Armenta, 2011). In general, enzymes used to cell wall degradation include lipases and cellulases. Despite being expensive, enzymes offer several advantages over other cell wall disruption methods. Enzymes present higher degradation selectivity than other mechanical disruption methods. Furthermore, algal cell walls are more recalcitrant than cell walls from other microorganisms, being very resistant to degradation. Thus, the use of mechanical disruption methods will require higher energy amounts (Sander & Murthy, 2009; Shah et al., 2004).
The use of PEF technology seems to be a potential alternative for the recovery of algal metabolites (Taher et al., 2011). This technique applies brief pulses of a strong electric field to cells, allowing the permeabilization of cell matrices, as well as the mass transport across the cell membranes (Guderjan et al., 2005; Taher et al., 2011). Although high recovery efficiencies can be increased employing organic solvents, this method requires far less
Literature review
organic solvents than the conventional organic solvent extraction methods (Guderjan et al., 2007; Guderjan et al., 2005).
UAE and MAE improve extractions of co-products from microalgae significantly, with high efficiencies, reduced extraction times andincreased yields, as well as moderate costs and negligible added toxicity (Mercer & Armenta, 2011). In UAE metabolites from microalgal cells can berecovered by cavitation. The cavitation phenomenon occurs when vapor bubbles of the liquid are formed in an area where pressure of the liquid is lower than its vapor pressure. As these bubbles grow when pressure is negative and compress under positive pressure, a violent collapse of the bubbles is promoted. When bubbles collapse near cell walls, damage can occur, leading to the release of cell contents (Cravotto et al., 2008; Mercer & Armenta, 2011; Taher et al., 2011). Application of this ultrasound-assisted method to both dry and wet biomass can improve extraction efficiencies by reducing extraction times and increasing recovery yields. In turn, MAE is supported by the principle that microwaves directly affect polar solvents and materials. Even when they are applied to dried cells, trace amounts of moisture are affected: temperature increases due to microwaves, moisture is evaporated, and pressure in the cells increases, leading to adamage or rupture of the cell wall, with the release of its contents (Balasubramanian et al., 2011; Mandal et al., 2007). Microwave theoryand the extraction principle are described in detail in Mandal et al. (2007). The use ofmicrowaves followed by organic solvent extraction using small amounts of solvent contributes to an efficient and inexpensive extraction procedure, which does not require previous dehydration of biomass.
Pressing techniques lie on the principle that when microalgal cells are submitted to high pressures, they start to crush, releasing their contents to an adequate solvent. As the methods described before, pressing can be advantageous when used as a pretreatment for organic solvent extraction, for example (Shen et al., 2009a; Taher et al., 2011). Although this method is very simple and inexpensive, it presents some disadvantages, such as high power consumption and maintenance costs (Taher et al., 2011).
The use of organic solvents to extract microalgal contents is the most applied method, especially for lipid recovery. The most used organic solvents are hexane, cyclohexane, benzene, ethanol, acetone, and chloroform (Brennan & Owende, 2010; Mercer & Armenta, 2011; Molina Grima et al., 2003). These solvents have shown to be quite effective in the extraction of microalgal metabolites, especially from dried biomass. A good solvent may present the following characteristics: i) to be insoluble in water; ii) to have high affinity for
extraction; iv) to have a considerably different density from that of water. Furthermore, the applied organic solvent should be inexpensive, non-toxic, and reusable (Mercer & Armenta, 2011; Ranjan et al., 2010). The main disadvantages of this method are associated with the high volumes of toxic and harmful organic solvents required.
One alternative to avoid the use of volatile and toxic organic solvents for metabolite extraction (especially lipid extraction) from microalgae is to use supercritical fluids as solvents (Amaro et al., 2011; Halim et al., 2011; Mercer & Armenta, 2011). Supercritical fluids are compounds that behave both as a liquid or a gas when exposed to temperatures and pressures above their critical temperature and pressure points. The most used supercritical fluid is CO2 (SCCO2) because it presents low critical temperature (31.1 °C) and pressure (72.9
atm) (Mercer & Armenta, 2011). SCCO2 extraction presents several advantages over the
traditional organic solvent extraction procedures, such as: tunable solvating power, low toxicity and flammability, favorable mass transfer rates, and production of solvent free extracts because at room temperature CO2 behaves as a gas (Amaro et al., 2011; Crampon et
al., 2011; Halim et al., 2011; Macías-Sánchez et al., 2007). The main disadvantage associated with this method is its expensiveness, which is mainly due to the high costs of the infrastructure and the required operational conditions (Halim et al., 2011).
Ionic liquids (ILs) have been reported as an attractive alternative for volatile and toxic organic solvents because of their non-volatile character, thermal stability, and high solvatation capacity (Kim et al., 2011; Lateef et al., 2009). ILs are salts of relatively large asymmetric organic cations coupled with smaller organic or inorganic anions. These organic salts can be liquid at room temperatures or low melting point solids (<100 °C) (Khodadoust et al., 2006; Lateef et al., 2009; Young et al., 2010). By altering the nature of both cation and anion of the ionic liquid, either hydrophilic or hydrophobic ionic liquids can be prepared, to make them suitable for different applications (Lateef et al., 2009).
After the extraction procedures, the metabolites recovered should be refined and purified according to their purpose and applications. For example, lipids can be used for biodiesel production, thus requiring further processing, as referred below.
2.4.4. Biodiesel production
Biodiesel constitutes the best candidate to substitute diesel fuel, as it can be used directly as fuel, requiring some engine modifications, or blended with petroleum diesel and used in diesel engines with few or no modifications (Leung et al., 2010). Chemically, biodiesel is a mixture of esters with long-chain fatty acids, such as lauric, palmitic, stearic,
Literature review
oleic, etc. (Demirbas & Demirbas, 2010). Recently, this biofuel has become more attractive due to its environmental benefits: it is biodegradable and has lower sulfur and aromatic content than diesel fuel, meaning that it will emit less toxic gases. Furthermore, it presents several advantages over conventional petroleum diesel, such as higher combustion efficiency and cetane number. The main disadvantages of biodiesel include the high costs of production, its higher viscosity, lower energy content, and higher nitrogen oxide emissions (Demirbas & Demirbas, 2010; Leung et al., 2010). Biodiesel can be produced from extracted lipids through four different methods: direct use or blending of oils, microemulsification of oils, thermal cracking or pyrolysis, and transesterification, also known as alcoholysis (Balat & Balat, 2010; Leung et al., 2010; Ma & Hanna, 1999). Additional information of the referred methods can be obtained in Balat & Balat (2010) and Ma & Hanna (1999). Transesterification constitutes the most applied method for biodiesel production, as it presents several advantages over the others. For example, blending and microemulsification cause some problems, such as carbon deposition and oil contamination, whereas pyrolysis is responsible for the production of low valuable products, as well as the production of gasoline instead of diesel (Sharma & Singh, 2009). Therefore, transesterification, the chemical conversion of triglycerides in glycerol and esters in the presence of an alcohol, seems to be the most appropriate method for biodiesel production.
As shown in Equations 2.1 to 2.3, the transesterification is a multi-step reaction where triglycerides are converted into diglycerides, monoglycerides, and finally into glycerol during three reaction steps. These reactions are reversible and each one results in the formation of 1 mol of fatty acid ester (Leung et al., 2010; Ma & Hanna, 1999).
( ) ↔ ( ) (2.1) ( ) ↔ ( ) (2.2) ( ) ↔ ( ) (2.3)
R represents a small hydrocarbon chain, whereas R1, R2, and R3 represent long-chain
hydrocarbons, also known as fatty acid chains.
Variables affecting biodiesel yields during transesterification are: i) the employed alcohol and molar ratio; ii) type of used catalyst; iii) amount of free fatty acids (FFA); iv) water content; and v) reaction temperature and time (Ehimen et al., 2010; Ma & Hanna, 1999;
There are two types of transesterification: transesterification applied to the extracted oil and transesterification directly applied to the oil source, without previous lipid extraction, also known as transesterification in situ. Although both methods are very similar, it is thought that transesterification in situ could lower the production costs of biodiesel fuel, as this process can produce biodiesel directly without the extraction step (Ma & Hanna, 1999).
This literature review shows the wide variety of applications of microalgae: from CO2
uptake and wastewater treatment to the production of metabolites with interest in diversified areas, such as cosmetics, pharmaceuticals and biofuels. The following chapters provide three different studies that have been performed to have an overview of some of the referred applications of microalgae.
CHAPTER 3
3.
The effect of light supply and medium composition on CO
2capture
3.1. Introduction
Anthropogenic activities are responsible for an increase in the atmospheric greenhouse gas (GHG) concentrations, which, in turn, are responsible for global warming (O'Neill & Oppenheimer, 2002). In the last decades, emissions of CO2, one of the main contributors of
greenhouse effect and global warming, have drastically increased, raising its concentration to approximately 30% higher than levels in the pre-industrial period (Mikkelsen et al., 2010). A solution for this environmental problem is CO2 capture, both from flue gases (4-14% CO2) and
from the atmosphere (≈ 0.04% CO2). Recently, a lot of different studies have focused the CO2
capture from flue gases and only a few have mentioned the capture from atmospheric air, due to the high CO2 levels present in the flue gases (Abu-Zahra et al., 2007; Pires et al., 2011; Rao &
Rubin, 2002; White et al., 2003). However, this process may be not enough to stabilize the CO2
level in atmosphere, which leads to the necessity of CO2 capture from the atmosphere (Pielke Jr,
2009).
Actually, there are three ways of CO2 removal from a gaseous stream or mixture: CO2
sequestration using physical methods, CO2 capture by chemical reactions, such as amine-based
absorption systems (Rao & Rubin, 2002), and CO2 capture by biological processes (Workman et
al., 2011). In biological processes, CO2 is captured by photosynthetic organisms, according to
the following expression (Falkouski & Raven, 2007):
→ ( ) (3.1)
Besides CO2 removal, the biomass produced during photosynthesis can be used to produce
electricity. However, this process will release the acquired CO2 to the atmosphere, eliminating its
effect. Thus, carbon capture should be coupled with the production of other compounds of interest, such as proteins and polysaccharides, that can be further used in the production of cosmetics, drugs and functional food (Hu, 2004; Singh et al., 2005).
for approximately 40% of the overall amount of carbon annually fixed on the planet (Jacob-Lopes et al., 2008). However, there are concerns that the ocean contribution in CO2 removal will
not be the same in the future (Gent, 2012; Swart & Fyfe, 2012). A promising capture process is the culture of microalgae, that use the solar energy with efficiency ten times greater than terrestrial plants (Pires et al., 2012). However, this process is still not economically viable. Research studies are required, mainly regarding the culture conditions (light intensity, photoperiod, temperature, pH and nutrient qualitative and quantitative profiles) and the photobioreactor design in order improve the knowledge on microalgae technology and its application.
This chapter aims to analyse the influence of light intensity, photoperiod and nutrient quantitative profile in the growth and consequent CO2 uptake of two microalgae (Chlorella
vulgaris and Pseudokirchneriella subcapitata), which cultures were aerated with atmospheric CO2 at room temperature. Excretion of proteins and polysaccharides was also analysed, to
observe if these microalgae were able to produce other compounds of interest at the same time.
3.2. Materials and methods
3.2.1. Microorganisms and culture medium
Stock solutions of the freshwater green algae Chlorella vulgaris and Pseudokirchneriella subcapitata obtained from American Type Culture Collection – ATCC (Figure 3.1 A and B, respectively) were prepared in OECD test medium (OECD, 2011), with the following composition (per liter): 12 mg MgCl2·6H2O, 18 mg CaCl2·2H2O, 15 mg
A. B.
Figure 3.1. Microscopic photographs of the microalgae C. vulgaris (A) and P. subcapitata (B) taken from a Leica
DM LB2 microscope (Leica Microsystems, Germany) incorporated with a DFC300 FX camera and the acquisition software IM50. Photographs were obtained using a 100× oil immersion objective.
The effect of light supply and medium composition on CO2 capture
MgSO4·7H2O, 1.6 mg KH2PO4, 0.08 mg FeCl3·6H2O, 0.1 mg Na2EDTA·2H2O, 0.185 mg
H3BO3, 0.415 mg MnCl2·4H2O, 3 µg ZnCl2, 1.5 µg CoCl2·6H2O, 0.01 µg CuCl2·2H2O, 7 µg
Na2MoO4·2H2O, and 50 mg NaHCO3. Nitrogen was supplied in the form of NaNO3 for C.
vulgaris, and in the form of NH4Cl for P. subcapitata (15 mg L-1). The cells were incubated in
500 mL flasks at room temperature, under continuous fluorescent light with an intensity of 72 µE m-2 s-1 at the surface of the flasks. Agitation was obtained by bubbling atmospheric (filtrated through a 0.22 µm cellulose acetate membranes, Orange Scientific, Belgium) air in the bottom of the flasks.
3.2.2. Experimental setup
Experiments were performed in 500 mL flasks operating in batch with a working volume of 450 mL. Cells were cultivated for 12 days in the following experimental conditions: initial cell concentration of 0.05-0.08 g L-1, room temperature (22±1 ºC), and continuous aeration with the injection of atmospheric air in the bottom of the flasks. The assays were carried out under different light intensities: 36, 72, 96, and 126 µE m-2 s-1. For each light intensity, different light cycles were evaluated: 10:14, 14:10, and 24:0 (light:dark). Additionally, for all light intensities and photoperiods tested, two different nutrient concentrations were used: the one described above, M1, and other where concentrations of all
nutrients were doubled, M2. All the experiments were conducted in duplicates. The
experimental units are represented in Figure 3.2.
3.2.3. Analytical methods
Light intensity was monitored using an IsoTech Lux-1335 light meter. Duplicate samples were collected at 24 h intervals and biomass concentration was determined by measuring optical density at 683 nm, OD683 (Kwon et al., 2005), using a V-1200
spectrophotometer (VWR, Germany). Each sample was diluted to give an absorbance in the range of 0.1–1.0. The relationship between OD683, y, and the dry cell weight, x, of C. vulgaris
and P. subcapitata was established by linear regression (see Figure A.1): ( ) ( ) and ( ) ( ), respectively. The pH of the cultures was also determined everyday using a HI 8424 pH meter (HANNA Instruments, USA).
3.2.4. Quantification of extracellular proteins and polysaccharides
One milliliter samples of each culture were collected daily and centrifuged at 16 500 × g for 10 min in an Eppendorf 5424 centrifuge (Eppendorf, Germany). The supernatants were stored at -20 °C in eppendorfs until being analyzed. Proteins and polysaccharides contained in thawed supernatants were then analyzed using the Bradford (1976) and Miller (1959) methods, respectively. Both methods were optimized to be applied in a 96-well polystyrene microtiter plates.
For protein quantification, standards with concentrations ranging from 0 to 0.01 g L-1 were prepared from a stock-solution (10 g L-1) of BSA (bovine serum albumin), purchased from Sigma-Aldrich, USA. Colorimetric detection of extracellular proteins was determined by adding 160 µL of both standards and samples to different wells, followed by the addition of 40 µL of Bradford reagent (see composition and preparation protocol in the Annex A.2). After an incubation period of 5 minutes at room temperature, absorbance at 595 nm was measured using a SpectraMax M2 (Molecular Devices, USA). Water (160 µL) with 40 µL of Bradford reagent was used as blank. Protein concentration was then determined by linear regression of absorbance measured at 595 nm versus BSA concentration in g L-1 (see Figure A.2), according to the expression: ( ) ( ).
Standards of glucose were prepared with concentrations ranging from 0 to 1.5 g L-1 from a stock-solution of 5.0 g L-1. Quantification of reducing sugars started by placing 25 µL of each sample and each standard in different eppendorfs, followed by the addition of 25 µL of DNS (dinitrosalicylic acid) reagent (see composition in Annex A.4). Each eppendorf was incubated at 80 °C for 5 min in a thermostatic bath. After this incubation period, 250 µL of water were added to stop the reaction. Finally, 200 µL of the solution present in the
The effect of light supply and medium composition on CO2 capture
eppendorfs was transferred to different wells and absorbance was measured at 540 nm using the SpectraMax M2 (Molecular Devices, USA). The used blank was water submitted to the same procedure as samples. Polysaccharide concentration was then determined by linear regression of absorbance measured at 540 nm versus glucose concentration in g L-1 (see Figure A.3), according to the expression: ( ) ( ).
3.2.5. Kinetic parameters
Cell concentration values obtained everyday were used to determine specific growth rates (µ, d-1), maximum biomass concentration (Xmax, g L-1), and biomass productivities (P,
g L-1 d-1) of each microorganism, as described by Tang et al. (2011). Specific growth rates were calculated from Equation 3.2:
( ⁄ )
(3.2)
where and were the biomass concentration (g L-1) on days and , respectively. Biomass productivities were calculated from the variation in biomass concentration (g L-1) within a cultivation time (d), according to Equation 3.3:
(3.3)
Specific growth rate values for different light intensities (I, µE m-2 s-1) were then used to determine the mathematical Monod model (Fergola et al., 2007), expressed by Equation 3.4:
(3.4)
where is the maximum specific growth rate and is the half saturation constant. This
model was fitted to the experimental data using a non-linear minimization function (NonLinearRegress) of the software package Mathematica (Wolfram Mathematica 8). These parameters were chosen to minimize the function given by the sum of squared residuals ∑ .
3.2.6. Statistical analysis
The kinetic parameters were determined from two independent experiments and data was analyzed using Paired-Samples t-test from the statistical software SPSS 17.0 (Statistical Package for the Social Sciences). Significance level for the separation was set at p < 0.05.
3.3. Results and discussion
As with all plants, microalgae also require light to perform photosynthesis, converting inorganic carbon into biomass. The light energy is converted into chemical energy (stored in chemical bonds of produced compounds). The microalgal growth depends on light intensity, spectral quality and photoperiod. The sunlight is available in a discontinuous mode and its intensity varies during the day. Taking into account the application of microalgae cultures for CO2 capture, the light effect on microalgal growth should be studied to evaluate the requirements
of artificial light for their cultures. Additionally, nutrient profile and concentration also influence microalgal growth, thus becoming necessary studying the effect of different nutrient concentrations in CO2 capture from microalgae.
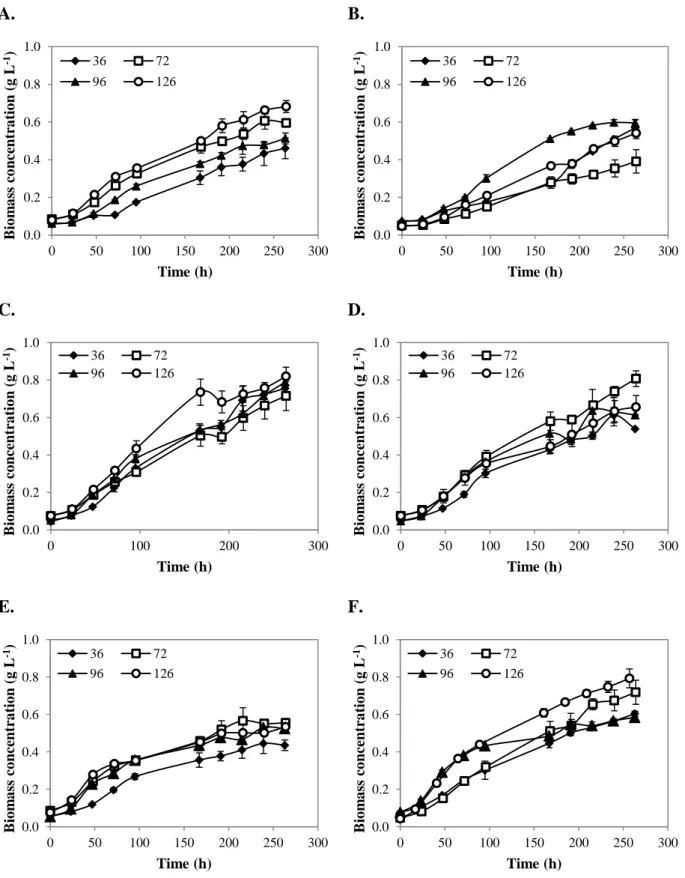
Figure 3.3 and Figure 3.4 show the growth curves of C. vulgaris and P. subcapitata, respectively, for different light and culture medium conditions at room temperature and aerated with CO2 at atmospheric concentration. For almost all cultures, it was observed the lack of an
adaptation phase or a very short one. For example, for almost all cultures the exponential phase started before completing the first day of culture. However, for photoperiod of 10:14 and low light intensities, both microalgal species showed longer adaptation phases. Generally, almost all cultures presented an exponential growth phase with the same duration, reaching the stationary phase at the seventh day of culture. Similar behavior was observed by Jacob-Lopes et al. (2009), when the effect of light cycles on the cultures of the cyanobacterium Aphanothece microscópica Nägeli was analyzed. However, for cultures where nutrient concentration was doubled and light supply was higher (longer light periods and higher light intensities), stationary phase was not reached at all before the end of the experiment. This result indicates that nutrients can be a growth limiting factor in cultures where its concentration was lower. Two possible limiting nutrients were nitrogen and phosphorus. According to the study performed by Bhola et al. (2011), C. vulgaris reached its maximum concentration for nitrogen and phosphorus concentrations of 5 g L-1 and 0.04 g L-1, respectively. In this study, nitrogen and phosphorus were supplied at 0.03 g L-1 and 0.0032 g L-1, respectively. As these values are lower than those used in the study performed by Bhola et al. (2011), the possibility of nutrient limitation is very high, especially for the assays conducted under lower nutrient concentrations.
The effect of light supply and medium composition on CO2 capture
A. B.
C. D.
E. F.
Figure 3.3. Growth curves of C. vulgaris grown in M1 (A, C and E) and in M2 (B, D and F) for different light
conditions: light intensity (36, 72, 96 and 126 µE m-2 s-1) and photoperiod (10:14 – A and B; 14:10 – C and D; 24:0 – E and F). Values are presented as the mean ± s.d. of two independent experiments.
0.0 0.2 0.4 0.6 0.8 1.0 0 50 100 150 200 250 300 B io m a ss co ncent ra tio n ( g L -1) Time (h) 36 72 96 126 0.0 0.2 0.4 0.6 0.8 1.0 0 50 100 150 200 250 300 B io m a ss co n centra tio n ( g L -1) Time (h) 36 72 96 126 0.0 0.2 0.4 0.6 0.8 1.0 0 100 200 300 B io m a ss co ncent ra tio n ( g L -1) Time (h) 36 72 96 126 0.0 0.2 0.4 0.6 0.8 1.0 0 50 100 150 200 250 300 B io m a ss co ncent ra tio n ( g L -1) Time (h) 36 72 96 126 0.0 0.2 0.4 0.6 0.8 1.0 0 50 100 150 200 250 300 B io m a ss co ncent ra tio n ( g L -1) Time (h) 36 72 96 126 0.0 0.2 0.4 0.6 0.8 1.0 0 50 100 150 200 250 300 B io m a ss co ncent ra tio n ( g L -1) Time (h) 36 72 96 126
A. B.
C. D.
E. F.
Figure 3.4. Growth curves of P. subcapitata grown in M1 (A, C and E) and in M2 (B, D and F) for different light
conditions: light intensity (36, 72, 96 and 126 µE m-2 s-1) and photoperiod (10:14 – A and B; 14:10 – C and D; 24:0 – E and F). Values are presented as the mean ± s.d. of two independent experiments.
0.0 0.2 0.4 0.6 0.8 1.0 0 50 100 150 200 250 300 B io m a ss co ncent ra tio n ( g .L -1) Time (h) 36 72 96 126 0.0 0.2 0.4 0.6 0.8 1.0 0 50 100 150 200 250 300 B io m a ss co ncent ra tio n ( g L -1) Time (h) 36 72 96 126 0.0 0.2 0.4 0.6 0.8 1.0 0 50 100 150 200 250 300 B io m a ss co ncent ra tio n ( g L -1) Time (h) 36 72 96 126 0.0 0.2 0.4 0.6 0.8 1.0 0 50 100 150 200 250 300 B io m a ss co ncent ra tio n ( g L -1) Time (h) 36 72 96 126 0.0 0.2 0.4 0.6 0.8 1.0 0 50 100 150 200 250 300 B io m a ss co ncent ra tio n ( g L -1) Time (h) 36 72 96 126 0.0 0.2 0.4 0.6 0.8 1.0 0 50 100 150 200 250 300 B io m a ss co ncent ra tio n ( g L -1) Time (h) 36 72 96 126